Study of Waster Water Treatment by
Laboratory Model of WWTP Through
Coagulation Process Using Chitosan Sulphate
Viewed from COD Parameters
Suseno
*, Peni Pujiastuti
* *D3 Studies Program of Chemical Analyst, Faculty of Engineering, Universitas Setia Budi
Surakarta ,
Jl . Let.Jen . Sutoyo , Surakarta
E-mail:
[email protected]
Abstract -- It has been modeled Wastewater Treatment
Plant (WWTP) and conducted experiments of wastewater treatment in Kampung Batik Laweyan solo using a model of the WWTP. WWTP consists of three tubs, where number 1 of tub is used to hold unprocessed waste, number 2 is used for coagulation and number 3 is used for the process of sedimentation. Sewage treatment experiment conducted by flowing sewage from number 1 of tub the nember 2. In the number 2 of tub, Chitosan Sulfate added and stirring, after which the sewage flowed into the number 3. Number 3 of tub is a sectional tub so that clots will hit the bulkhead and then a process of sedimentation. The output of the number 3 is the waste that has been processed and then analyzed its COD parameter. The experiments made from the variation of waste flow rate and the speed of affixing chitosan sulfate. Variations in flow rate of the waste that is: 2 L / h, 3 L / h, 4 L / h, 5 L / h and 6 L / h. For each flow rate of the waste created variation rate of addition of chitosan sulfate, that is 50 mg / min, 100 mg / min, 200 mg / min, 300 mg / min and 400 mg / min. For each variation of these experiments determined the percentage reduction in COD.
Consider from the waste flow rate, the experimental results showed that the greater of the flow rate causes the smaller of the percentage of COD reduction, where the percentage reduction in COD seen constant starting at a flow rate of waste 3 liter / hour.
Consider from the rate of Chitosan Sulfate addition, experimental results show that the faster addition of chitosan sulfate causes percentage reduction in COD greater, where the percentage reduction in COD seen constant starting at a speed addition of Chitosan Sulfate 300 mg / min.It can be concluded that the optimum flow rate of the waste is 3 liters / hour, while the optimum speed of Chitosan Sulfate affixing is 300 mg / min.
Keywords: chitosan, chitosan sulfate, coagulation, COD
I. INTRODUCTION
Kampoeng Batik Laweyan is one of the batik industry centers in the Village Laweyan, Laweyan District, the town of Surakarta, Central Java. In this
area, the production of batik is a business that has been going on for decades. Not less than 22 industry produces batik with batik motifs. The government currently makes Kampoeng Batik Laweyan Surakarta as one part of the policy development One place one product.
With the support of the Ministry of Environment, Gesellschaft für Technische Zusammenarbeit (GTZ) and the Government of Surakarta, has made Wastewater Treatment Plant (WWTP) of batik at Kampoeng Batik Laweyan. The WWTP was inaugurated on March 18, 2008.
Based on the test results of the WWTP effluent Kampoeng Batik Laweyan, it still has the WWTP effluent COD and TSS prices are high, COD of 120 mg / L and TSS of 250 mg / L and is colored solid (Pujiastuti and Supadmi, 2009).
Pujiastuti and Supadmi (2009), has conducted research on the Adsorption Efficiency Improvement of WWTP Kampoeng Batik Laweyan Surakarta with Dual Filter Adsorption systems of activated carbon and natural zeolite in terms of the parameters COD and TSS. The results showed that the dual filter of activated carbon and natural zeolite can reduce the COD by 60% and 82.4% for TSS with COD nuber is 48 mg / L and TSS number is 44 mg / L, pH 6.81 and still dark colored. But increasing the efficiency of the WWTP is still less than the maximum because of the waste processed by the Dual Filter still not meet the water quality standard of waste according to local regulations, Central Java Province, No.10 of 2004 in particular on the parameters COD, TSS and color.
Suseno (2011) has researched the use of chitosan as a coagulant to reduce effluent turbidity in the batik industry Kampoeng Batik Laweyan Surakarta. The results showed chitosan is able to reduce turbidity reduction of waste but not maximized, which only amounted to 57.12%.
Suseno (2012) has conducted research into a modified chitosan became chitosan sulfate to test the
Page 65 of 436
ability of chitosan sulfate as a coagulant for wastewater batik industry at Kampoeng Batik Laweyan Surakarta. The results showed that the chitosan sulfate can reduce industrial effluent turbidity batik up to 80.76%.
Based on the results of the above studies, it is necessary to hold further research in order to improve the ability of chitosan and its application as a coagulant in the waste water batik industry at Kampoeng Batik Laweyan Surakarta.
Research titled“Study Of Waste Water Treatment By Laboratory Model Of WWTP Through Coagulation Process Using Chitosan Sulphate Viewed From Cod Parameters Kampoeng Batik Surakarta, aims to make modifications in the WWTP effluent treatment of Kampoeng Batik Laweyan Solo.
WWTP Kampoeng Batik Laweyan Solo who had been using the Dual Filter Adsorbsi will be modified by coagulation process using chitosan sulfate coagulant.
WWTP Kampoeng Batik Laweyan Solo who had been using the Dual Filter Adsorbsi will be modified by the process of coagulation using chitosan sulfate coagulant. The study was conducted using a laboratory-scale model of the WWTP. This study was conducted in three phases: modeling WWTP, sewage treatment stage using WWTP models, and phase analysis of the parameters COD original waste and waste processing results. Experiments conducted with a variety of waste treatment flow rate of waste and variation of weight chitosan sulfate.
II. EXPERIMENT
A. WWTP Modelling
WWTP models are made in the form of tubs with size (30 x 30 x 30) cm 3 pieces consisting of 1 tub (sewage tanks), tubs 2 (pack of affixing the chitosan sulfate and stirring process) and 3 bath (bath deposition of floc results of the coagulation process. WWTP Construction models are as follows:
B. Waste Treatment Experiment
Experiments waste processing is done by means of a continuous flow of tub waste 1, heading 2 and bath tub 3. Flow rate of waste is made varies yaiu (6, 5, 4, 3, 2) liters per hour. In this experiment also affixed chitosan sulfate at 2 bath with affixing the speed variation (50, 100, 200, 300, 400) mg per minute. The experimental results of various varisi its COD was determined numbers and determined the percentage of COD reduction compared to the original sample COD (unprocessed).
C. COD Analysis of the Results of Processing
Pipetted 10 ml test sample, put in a 250 ml erlenmeyer. Then add 0.2 g of powder and a few grains HgSO4 boiling stones. Also add 5 ml of K2Cr2O7 solution 0.25 N. After that, add 15 ml of sulfuric acid reagent-silver sulfate than slowly cooled in the cooling water. Erlenmeyer associated with Liebig cooler and bring to a boil on a hot plate for 2 hours. Then let cool and wash the inside of the cooler with distilled water until the sample volume to approximately 70 ml.
Cool to room temperature, add the indicator ferroin 2 to 3 drops, FAS titration with a solution of 0.1 N to brownish red colors, note the requirements of FAS solution. Blank experiment was also conducted in the same manner with the sample analysis procedure but the sample was replaced with distilled water.
III. RESULTS AND DISCUSSION
A. Results
Experiment results shown in the table as follows: Table 1 Data on the percentage reduction of COD
Waste flow rate ( liter/hour)
% COD reduction in the variation of the addition rate of chitosan sulfate
50 mg/min
100 mg/min
200 mg/min
300 mg/min
400 mg/min
2 50,44 52,57 53,95 55,21 55,58
3 50,17 52,42 53,92 55,18 55,30
4 47,68 50,06 52,32 53,70 53,83
5 46,32 48,81 50,80 52,77 52,92
6 44,66 46,53 48,67 50,54 50,79
From the experimental data were then created two kinds of curves, namely:
1.
curve relationship wastewater flow rate vs. percentage reduction in CODPage 66 of 436
Fig. 2 curve relationship wastewater flow rate vs. percentage reduction in COD
2.
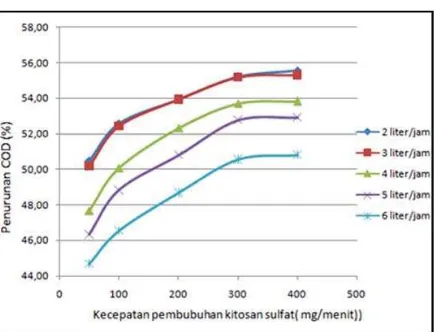
curve relationship affixing speed chitosansulfate versus the percentage decrease in COD
Fig. 3. curve relationship affixing speed chitosan sulfate vs. percentage COD reduction
A. Discussion
By observing Figure 2 is a flow velocity curve vs. percentage COD reduction of waste, it appears that the slower the flow rate of the wastewater COD reduction percentage will be even greater. This is because the smaller the flow rate (slow flow), the contact time with the chitosan sulfate waste components will be even larger (longer) which will cause the coagulation process run better.
If the comparison between the speed of 3 liters / hour with 2 liters / hour, it appears that the per cent reduction in COD is only slightly different, it shows that at a speed of 3 liters / hour percentage COD reduction has begun constant. It can be said that based on the observation of the image is the optimum flow rate is 3 liters / hour.
If the observed figure 3 the curves of chitosan sulfate affixing speed vs. percentage reduction in COD, it appears that the greater speed of chitosan
sulfate affixing causes the greater of percentage reduction in COD. This was due to the greater speed of the addition of chitosan sulfate, then the number of sulfate chitosan that interacts with components of waste per unit of time greater, so the more the number of molecules of chitosan sulfate. With the increasing number of molecules of chitosan sulfate particles, the more waste can also coagulated by chitosan sulfate. This causes the small amount of organic substances that are on the processed waste. If the amount of organic matter less causes the COD parameter is also getting smaller, so that the percentage reduction in COD getting bigger.
If the comparison between the rate of 300 mg / min with 400 mg / min, it appears that per cent reduction in COD is only slightly different, it shows that at a speed of 300 mg / min percentage COD reduction has begun constant. It can be said that based on the observation of the image, the optimum rate of addition of chitosan sulfate is 300 mg / min.
Based on the data in Table 1, it is known that chitosan is able to reduce the number of COD batik industry, however, riding on existing data it can be seen that the largest percentage of COD reduction is 55.58%. That alone should be at the rate of addition of chitosan sulfate large (400 mg / min) and the slowest flow rate is 2 liters / hour. It can happen because chitosan sulfate is not soluble in water, so that settles quickly though chitosan sulfate coagulation process is not maximized.
IV. CONCLUSION
1 Chitosan Sulfate able to reduce the COD of wastewater batik industrial
2 The optimum processing conditions on wastewater flow rate 3 liters / hour and the rate of
addition chitosan sulfate 300 mg / min.
REFERENCES
[1] Alaerts, G. dan Santika, S.S., 1987,
“Metoda Penelitian Air”, Usaha Nasional,
Surabaya.
[2] Astuti, F. (2004), “Pengolahan Limbah
Cair Industri Batik dengan Koagulan dan
Penyaringan”, Tesis Magister, Program Pascasarjana, Universitas Gadjah Mada, Yogyakarta.
[3] BPPT, (1999), “ Teknologi Pengolahan
Air: Cara Pengolahan Air Sumur Untuk Kebutuhan Air Minum dengan Filter
Ganda”BPPT: Jakarta.
Page 67 of 436
[4] Cahyaningrum, S. E. 2001. Karakteristik
Adsorpsi Ni (II) dan Cd (II) pada Kitosan dan Kitosan Sulfat
[5] dari Cangkang Udang Windu (penausm
onodon), Tesis Pasca Sarjana , UGM, Jogjak
arta.
[6] Darjito. 2001. Karakterisasi Adsorpsi Co(II
) dan Cu(II) pada Adsorben Kitosan Sulfat,
Tesis Program Pasca Sarjana, UGM, Yogyakarta.
[7] FKBL, (2008), “Panduan Operasional:
Pengelolaan Instalasi Pengolahan Air Limbah (IPAL) Kampoeng Batik Laweyan
Kota Surakarta”FKBL: Solo.
[8] Industri Batik Mahkota, 2008, “ Proses
Pembuatan Batik” , Surakarta
[9] Joglosemar, (14-02-2009), “Warga
Keluhkan Bau IPAL Laweyan, harian Joglo
Semar”, edisi 14 Februari 2009,
http://harianjoglosemar.com
[10] Kedaulatan Rakyat, Januari 2009,
“Produksi Bersih dari ‘Kampoeng Batik’ Laweyan” 22/03/2009.
[11] Mahatmanti, F.W. 2001. Studi Adsorben Lo
gam seng(II) dan Timbal (II) pada
[12] Kitosan dan Kitosan Sulfat dari Cangkan
g Udang Windu (PenousMonodon), Tesis
Program Pasca Sarjana, UGM, Yogyakarta. [13]Mahida, U.N, 1986, “Pencemaran Air dan
Pemanfaatan Limbah Industri”, Rajawali
Press, p.23, Jakarta
[14]Masriati R.(2006), “Pengolahan Limbah
Cair Industri Kerajinan Songket Tradisional dengan Adsorbsi Menggunakan Kabon
Aktif”, Tesis Program Magister Teknik
Kimia, Program Pasca Sarjana Universitas Sriwijaya Palembang.
[15]Mu’minah, (2008), “Aplikasi Kitosan
Sebagai Koagulan Untuk Penjernihan Air
Keruh”, Tesis, Program Pascasarjana, ITB, Bandung.
[16] No. H, Lee and Meyers S.P. 2000. Core lation Between Physicochemichal
Characteristic and Binding Capacities on Chitosan Product, Journal of
Food Science, Vol 65 no 7 1134-1137.
[17] Pujiastuti, P, (2003), “Sebaran
Karakteristik Air Limbah Industri Batik Sebagai Sumber Utama Pencemaran Air Tanah Dangkal Di Sentra Batik Laweyan
Surakarta” Prosiding Workshop Litbang Balai Besar Kulit & Tekstil Yogyakarta, ISBN 979-8379-08-3
[18] Puspitasari A (2007). Pembuatan Dan Pemanfaatan Kitosan Sulfat Dari Cangkang Bekicot (Achatina Fullica) Sebagai Adsorben Zat Warna Remazol Yellow Fg 6, Skripsi UNS Surakarta
[19] Sari, TI, Ali F., dan Rafsanjani, B. (2006),
“Pembuatan Karbon Aktif dari Ampas Tebu dan Aplikasinya dalam Pengolahan Limbah Cair”, Jurnal Teknik Kimia no. 4 Vol 10,
hal 1-1-6, Universitas Sriwijaya Palembang. [20] Sastrohamidjoyo H., 2001, Spektroskopi,
Liberty, Yogyakarta
[21] Soedarsono dan Syahputra, B (2007),
“Pengolahan Air Limbah Batik dengan
Proses Kombinasi Elektrokimia, Filtrasi dan
Adsorbsi”, Laporan Penelitian, Fakultas
Teknik, Jurusan Teknik Lingkungan, Universitas Sultan Agung, Semarang.
[22] Widodo A, Mardiah, dan Andy Prasetyo,
(2005), “Potensi Kitosan Dari Sisa Udang Sebagai Koagulan Logam berat Limbah
Cair Industri Tekstil” , Jurnal Teknik Kimia, ITS, Surabaya.