DEVELOPMENT OF A SELF-EFFICACY SCALE FOR PRESCHOOL TEACHERS ON SCIENCE TEACHING: VALIDITY AND
RELIABILITY STUDY
Sümeyya Kuş Gürbey1, Mustafa Metin2*
1Kayseri Provincial Directorate of Labor and Employment Agency, Kayseri, Turkey
2Department of Mathematics and Science Education, Faculty of Education, Erciyes University, Kayseri, Turkey
[email protected]1, [email protected]2
*Corresponding Author
Received: 31 December 2021; Accepted: 10 February 2022; Published: 03 March 2022
To cite this article (APA): Kuş Gürbey, S., & Metin, M. (2022). Development of a self-efficacy scale for preschool teachers on science teaching: Validity and reliability study. Southeast Asia Early Childhood Journal, 11(1), 106-129. https://doi.org/10.37134/saecj.vol11.1.7.2022
To link to this article: https://doi.org/10.37134/saecj.vol11.1.7.2022
ABSTRACT
The study was carried out in order to develop a valid and reliable scale aimed at determining the self-efficacy of preschool teachers regarding science teaching. In the study, survey method was used within the scope of quantitative research approach. The sample of the study consists of 612 teachers who are actively working in preschool institutions in the 2020-2021 academic year. In the study, a self-efficiency scale consisting of 52 items was used as a data collection tool. In order to ensure the validity of the scale, the content, face and structure validity were examined. Expert opinions were obtained for the content and face validity, and exploratory and confirmatory factor analysis were applied for the structure validity. As a result of expert opinions and exploratory factor analysis, four items were excluded from the scale and the scale consisting of two factors was confirmed by confirmatory factor analysis. As a result of confirmatory factor analysis, RMSEA value was found to be 0.058, GFI value was found to be 087, CFI value was found to be 0.91 and IFI value was found to be 0.91. In order to determine the reliability of the scale, Cronbach Alpha coefficient was calculated. As a result of the reliability analysis, the Cronbach alpha reliability coefficient of the scale was calculated as 0.97. As a result of the study, a valid and reliable 48-item scale consisting of a two-factor structure was developed to determine the self-efficacy of preschool teachers regarding science teaching.
Keywords: preschool, pre-school science education, science-oriented self-efficacy, scale development
INTRODUCTION
Preschool teachers are responsible for organizing an effective learning environment with stimuli that match the interests and abilities of students (Demiriz, 2001). Since the science topics to be told to children are not specifically specified in the preschool curriculum, teachers should determine the relevant topic content when planning their lessons and organize activities in a way that will be of interest to children and do it with them. Teachers are free to choose the science subject they will tell students about, and the proficiency of teachers in science plays an important role in determining these subjects (Anderson and Gulberg, 2014). In this respect, pre-school teachers' science practices are determined by their competencies in science subjects.
Bandura (1997) stated that competence consists of two components as “self-efficacy”
and “result expectation”. The expectation of results is the individual's assessment of behaviors that will cause certain results, while self-efficacy is the belief that the individual will successfully perform a behavior that should achieve results (Wai Leng et al., 2021). But, sometimes an individual's perception of his/her self-efficacy may not reflect his/her true competence. Only the person's perceived self-efficacy has an important role in regulating his/her behavior (Senemoğlu, 2003). For this reason, many people have an aversion to learning by being under the influence of situations that cause them to feel inadequate even though they have the ability, and they may stop making efforts and experience failures with the thought of
“I can't do it anyway”. On the other hand, individuals with high self-efficacy in a particular subject can succeed in the end by entering this job with the effort of doing their best no matter how hard the job is to be done (İsrael, 2007).
In terms of teaching, self-efficacy can be expressed as the knowledge, skills and attitudes that teachers are expected to have in order to fulfill their duties and responsibilities (Gözüm and Güneş, 2018). Teachers with a high level of self-efficacy tend to conduct research- based and student-centered teaching in their courses (Schriver and Czerniak, 1999). In science education, self-efficacy is closely related to the science teaching of teachers and the science activities they will organize. In this context, teacher self-efficacy is very important in achieving the intended achievements in science teaching. Based on this point, preschool teachers play an important role in realizing the goal of educating science literate individuals from preschool to high school, as well as in providing attitudes, interests and skills towards science in early childhood (Gözüm and Güneş, 2018). Considering this situation, the importance of preschool teachers' competencies in the field of science is revealed. In his study, Kesgin (2006) stated that teachers with high self-efficacy will achieve higher performance by setting higher goals for themselves in the lessons. In this context, it is thought that the degree to which preschool teachers consider themselves adequate in terms of science education also affects their science education performance. Similar to this idea (Chan, 2003) stated in his study that teachers who feel sufficient about carrying out science education, that is, who have high self-efficacy, will be more effective in the educational process.
Considering the effects of preschool teachers on children, it seems that preschool teacher competencies are an issue that should be investigated (Gömleksiz and Serhatlıoğlu, 2013). Considering that science teaching in preschool is mostly done in practice through activities, it is necessary to develop measurement tools to measure and evaluate the knowledge, skills and competencies of teachers for applications in science teaching. When the literature is examined, it is seen that there are studies in which the self-efficacy of teachers and teacher candidates in science teaching is determined. It is seen that these studies are aimed at determining the self-efficacy of classroom teachers in science teaching (Küçük et al., 2013;
Menon 2020; Sultan 2020; Yıldız Budan and Gökçakan 2012). It is seen that the aim of studies is to determine the self-efficacy of preschool teacher candidates in science teaching (Our- Akçay 2015; Aydoğdu and Peker 2016; Uyanık Balat et al., 2018; Şeker and Çavuş 2017; Ültay et al., 2019). Also, it is seen that science knowledge is aimed at examining the self-efficacy of teachers and prospective teachers in science teaching in terms of various variables (Saraçaoğlu and Yenice 2009; Yalmancı and Aydın 2014).
In addition, there are also scale development studies conducted to determine the self- efficacy of teachers in science education in the literature. Some of these studies include:
"Academic Self-efficacy Scale" by Jerusalem and Schwarzer (1981); "Teacher Proficiency Scale" by Gibson and Dembo (1984); “Self-Efficacy Belief Scale of Classroom Teachers in
Science Teaching" by Riggs and Enochs (1990); “Self-efficacy beliefs of teachers" by Tschannen-Moran and Hoy (2001); “The Scale for Determining the Beliefs of Pre-Service Teachers about Science Teaching” by Yılmaz-Tuzun (2008); “Self-efficacy Belief Scale in Science Teaching in Classroom Teaching" by Vural and Hamurcu (2008); “The Scale for Determining the Competence of Preschool Teachers in Relation to Science Activities" by Özbey and Alisinanoglu (2009); “The Scale for Determining the Attitudes and Beliefs of Preschool Teachers in Science Teaching" by Maier et al., (2013); “The Scale for Determining the Self-Efficacy of Classroom Teachers in Science Teaching" by Yangın and Sidekli (2016);
“Science Teaching Self-Efficacy Scale" by Gözüm and Güneş (2018): and “Self-Efficacy Scale for Science Education Before School" by Buldur and Alisinanoglu (2020).
When the literature is examined, it is seen that the scale development studies conducted to determine preschool science education practices are limited. It is also emphasized by researches that the studies aimed at preschool science education are in a development process (Özen Uyar and Ormancı, 2016; Taşkın and Şahin, 2008). According to the studies conducted, it was seen that the sample of the scale development studies aimed at determining teacher self- efficacy in preschool science teaching was composed of preschool teacher candidates. Besides, it was observed that some of the studies on determining the self-efficacy of preschool teachers were conducted with scales developed with a sample of other field teachers, while others were conducted with scales developed to determine the level of self-efficacy of teachers in general terms. However, in order to determine the self-efficacy of preschool teachers in science teaching, it has not been observed that there is a scale development study in which preschool teachers are again in the sample. In addition, it has been observed that there is a limited number of scales that can measure the self-efficacy of preschool teachers for science applications in a wide-ranging and up-to-date way.
In the preschool period, when the foundations of science education were laid, the success of teachers, the high self-efficacy beliefs that they can perform their duties and responsibilities are very important for raising science literate individuals (Yılmaz et al., 2004).
In this context, it is considered important to examine the opinions of teachers who are active in the field regarding the applications in preschool science education. Using a valid and reliable scale which was developed with this study by researchers, it will be possible to determine the self-efficacy levels of preschool teachers in preschool science applications. The results obtained will provide information about the level at which preschool science practices can be carried out by teachers. In addition, it is thought that the development of this scale will fill the gap in the field of literature due to the fact that the scale developed taking into account the current competencies of teacher self-efficacy is a limited number for applications in preschool science education.
In this context, the aim of the study is to develop a valid and reliable scale aimed at determining the science teaching self-efficacy of preschool teachers. The research problem in accordance with the purpose of the study: Is the scale developed to determine the science teaching self-efficacy of preschool teachers valid and reliable?
Sub-problems
1. Is the scale developed to determine the science teaching self-efficacy of preschool teachers valid?
2. Is the scale developed to determine the science teaching self-efficacy of preschool teachers reliable?
METHODOLOGY
The study is a scale development study and one of the quantitative research methods, the survey method, was used in the research. Quantitative research method is a research method that aims to measure the relationship between variables by decisively determining their limits in studies and to reach generalizations (Yıldırım and Şimşek, 2016). A survey method is a research approach that aims to describe a situation that exists in the past or still exists as it. In this method, the event, individual or object that is the subject of research is tried to be defined in its own conditions and as it is, no effort can be made to change or influence it. The main thing is to be able to properly observe and determine what you want to know (Frankel, et al., 2012).
The most important advantage of the survey method is that it presents information taken from a sample of a fairly large number of individuals (Büyüköztürk et al., 2015). The reason for using the survey method in this study is that the screening studies can provide us with information to be obtained from a sample that may consist of quite a lot of individuals in order to determine the validity and reliability of the developed self-efficiency scale.
Study Group
The study group of the study consists of 412 preschool teachers who were determined using random sampling method among preschool teachers who work in kindergartens and want to participate in the research voluntarily. When determining the number of people in the sample, the rule that the number of questions in the scale used should be at least five times the number of people was taken into account (Bryman and Cramer, 2001). The demographic characteristics of the teachers participating in the study are presented in Table 1.
Table 1
Demographic Characteristics of the Teachers Participating in the Study
Gender Frequency Percent Service Year Frequency Percent
Female 321 77,9% 5 years and below 56 13,6%
Male 91 22,1% 6-10 year 111 26,9%
Age Frequency Percent 11-15 year 154 37,4%
20-25 28 6,8% 16-20 year 53 12,9%
26-30 53 12,9% 21-25 year 26 6,3%
31-35 100 24,3% 26-30 year 5 1,2%
36-40 125 30,3% 30 years and above 7 1,7%
41-45 67 16,3% Graduated Program Frequency Percent
46-50 21 5,1% Pre-school Teaching 265 64,3%
51-55 11 2,7% Early Child Development 104 25,2%
56-60 5 1,2% Others** 43 10,4%
61 and above 2 0,5% The Worked Institution Frequency Percent
Place of Duty Frequency Percent MoNE* Schools 316 76,7%
Village-Town 69 16,2% Private Schools 83 20,1%
County 124 30,1% Others*** 13 3,2%
City Center 219 53,2%
* MoNE: Ministry of National Education
**Educational Institutes related to Early Child Education
*** Kindergartens affiliated to foundations, associations and any institution
Table 1, according to the teachers surveyed were examined in terms of gender, 77.9%
reputation of a woman, 22.1% of male, when it is examined in terms of age range, 6.8% is 20- 25, of 12.9% reputation is 26-30, 24.3% is 31-35, 30.3% reputation is 36-40, 16.3% reputation is 41-45, 5.1% is 46-50, 2.7% is 51-55, 1.2% is 56-60, 0.5 it is observed that over the age of 61. When examined in terms of the teacher's duty, 16.2% of the village or town, in %30.1’
districts, in 53.2% of the teachers were examined according to years of service tenure in the city center 13.6% and under 5 years, 26.9 %’ reputation between 6-10 years, 37.4% between 11-15 years, 12.9% between 16-20 years, 6.3% between 21-25 years, 1.2% between 26-30 years, 1.7% and above, it is seen that 30 years of service in the profession. In addition, when teachers are examined in terms of the program they have graduated from, 64.3% of them are pre-school teachers, 25.2% of them are child development and 10.4% of them have graduated from other programs; when the teachers are examined in terms of the type of institution they work in, it is seen that 76.6% of them work in MoNE schools, 20.1% of them work in private schools and 3.2% of them work in other institutions.
In the study, Confirmatory Factor Analysis (CFA) application was also carried out with a different sample group consisting of 200 preschool teachers outside of this sample. When choosing these teachers, it was taken into account that teachers are actively working in preschool institutions and voluntarily participate in the research. A random selection was made among the teachers who have these characteristics and a sample was determined for the CFA application.
Characteristics of teachers participating in the CFA in terms of gender, 75% are female and 25% are male, when the age range is examined, 1.2% are 20-25, 15.8% are 26-30, 36.6%
are 31-35, 27.4% are 36-40, 11% are 41-45, 5.5% are 46-50, 1.5% are 51-55, 1% are between the ages of 56-60. When teachers were examined in terms of their place of work, 18.2% worked in a village or town, 21.6% worked in a district, and 59.2% worked in a city center; when teachers were examined according to years of Service ,12,8% 5 years and under, 27.9%
between 6-10 years of reputation, 35,5% between 11-15 years of reputation, 14,9% between 16-20 years of reputation, 5.3% between 21-25 years, 2,1% between 26-30 years and 1.5% of them have a year of service in the profession over 30 years. In addition, teachers work in preschool education for 68.3% of the programs they graduate from, child development for 22.2% and other programs for 18.4%; 80% of teachers work in MoNE schools, 17.6% in private schools and 2.4% in other institutions in terms of the type of institution they work in.
Developing the Data Collection Tool
Within the scope of the research, a five-stage process was followed when developing a scale for determining the self-efficacy of preschool teachers for science teaching. In determining this five-stage process, the scale development steps of many researchers were taken into account in the literature (Buldur and Alisinanoğlu 2020; Maier et al., 2013; Metin, 2010; Metin, 2014;
Metin et al., 2012a; Metin et al, 2012b; Özbey and Alisinanoğlu 2009; Tabachnick and Fidell,
2013; Tschannen-Moran and Hoy 2001). These five stages, which are determined as Item Pooling, applying for expert opinions, pre-trial, construct validity and reliability analysis, are explained in detail below.
Creating the Item Pool
At this stage, in order to determine which aspects of preschool teachers' self-efficacy towards science teaching should be paid attention to, the self-efficacy and science education self- efficacy scales included in the field article were examined. In general, self-sufficiency related to Gibson and Dembo (1984) “Teacher Competency Scale”; Jerusalem and Schwarzer (1981)
“Academic self-efficacy Scale”; the Tschanne-Moran and Hoy (2001) “Teachers’ self-efficacy beliefs” such as the developed scales were examined. From these scales, information has been obtained on what to look for when developing a self-efficacy scale. Also, in Literature, Science self-efficacy related to previously developed scales were revised; these, such as Riggs and Enochs (1990) “Classroom Teachers’ Science Teaching Self-efficacy Beliefs Scale”; Yılmaz- Tuzun (2008) “Classroom Teacher Candidates to Determine Their Beliefs About Science Teaching Scale”; Vural and Hamurcu (2008) “School Teacher, Science Teaching Self-efficacy Beliefs Scale; Yangın and Sidekli (2016) “Classroom Teachers' Science Teaching Self-efficacy Scale to Determine”; by Gözüm and Güneş (2018) “Science Teaching Self-efficacy Scale.” In the study of these scales, it was tried to decide how a scale for science teaching was developed and which aspects are important. In addition to that, studies such as scale development developed in the field of preschool education have also been studied. These, such as Özbey and Alisinanoğlu (2009) “Pre-school Science Teachers to Determine Their Proficiency in Respect of the Activities Scale”; Maier et al., (2013) “Pre-determining The Scale of School Teachers in Science Teaching Attitudes and Beliefs”; Buldur and Alisinanoğlu (2020) “Science Education in Preschool for Self-efficacy Scale.” From the scales developed in the literature, it has been decided which points we will develop scale items for in our study. In addition, interviews were conducted with 11 preschool teachers in order to determine the status of preschool teachers in the process of implementing science activities and the items to be added to the item pool. During the interview process, questions were asked to teachers about what they were doing in the process of implementing science activities, whether there was a science corner in their classrooms, their thoughts about the use of materials, whether they include extracurricular activities, about their self-efficacy and the documents they used in science activities. A five-point Likert-type draft scale consisting of 60 items “Always (5)”, “Most of the time (4)”, “Sometimes (3)”, “Rarely (2)”, “Never (1)” was developed using the previously prepared scales in the literature and the data obtained as a result of interviews with teachers.
Consulting Expert Opinion
Even if a draft scale consisting of 60 items was created at the item pooling stage of the scale, it is important to ensure the validity of the scope and appearance of the items of the written scale. In order to ensure the validity of the content of whether the draft scale items developed for this purpose adequately reflect the desired behavior to be measured, in other words, they were sent to 2 academicians and 2 preschool field specialists who work in the field of preschool education. Field experts and academicians were asked to review the items related to determining the self-efficacy of preschool teachers for science education included in the scale at the point of whether it fully measures the teachers' thoughts and evaluate the validity of the content of the scale. As a result of their review, field experts have proposed that nine items be
removed from the scale, five items be rearranged and one new item be added. In addition, according to the recommendations of academicians, the items of the scale are divided into categories. The necessary arrangements have been made and the scale consisting of 52 items has been sent to an academic who is a measurement -evaluation specialist. The measurement- evaluation specialist was asked to make an assessment about the scale's content validity, face validity, and whether the items fit the desired characteristics to be measured. After the arrangements made in accordance with the opinions of the measurement and evaluation specialist, the scale was rearranged. However, this scale was examined by a language expert in terms of spelling, intelligibility and suitability and a five-point Likert-type scale consisting of 52 items (27 positive and 25 negative items) was introduced. In the study, after the content validity, the face validity was tried to be ensured. The validity of face indicates what a scale seems to measure more than what it measures. The face validity of a measurement tool is that it actually appears to measure the characteristics that that measurement tool wants to measure (Metin, 2014). It was determined that the face validity of the scale was ensured in accordance with the opinions of field experts, academicians, measurement and evaluation and language expert about the validity of the scale's opinion.
Preliminary Trial Stage
At the pre-trial stage, the developed draft scale was applied to a group of preschool teachers consisting of 25 teachers. Information was obtained from preschool teachers about the response time of the scale, the intelligibility of the items, and whether it was suitable for preschool teachers. From the opinions of preschool teachers; It was concluded that the 52-item scale is understandable, the number of items in the scale and the expressions in the item are appropriate for teachers, and the scale can be answered in 25 minutes.
The Stage of Construct Validity
In order to determine whether a developed scale is valid, it is recommended by many researchers to look at the content, face, structure and criterion validity (Field, 2005; Metin, 2014; Pallant, 2020). In accordance with the expert opinions, the content and face validity of the draft scale consisting of 52 items was provided. After the pre-test stage of the scale, it is necessary to ensure the structural validity of the scale. For this purpose, factor analysis is performed on the scale and similar structures are collected under the same factor (Kline, 2005;
Tabachnick and Fidell, 2013). The draft scale for determining the self-efficacy of preschool teachers for science education was applied to 412 preschool teachers. Before conducting the factor analysis, it is necessary to look at the normal distribution of the data obtained from the pre-school teachers' answers to the scale (Pallant, 2020). For this purpose, it is suggested to examine Skewness and Kurtosis values, histogram graph, Q-Q plot test, Kolmogorov-Smirnov values (Pallant, 2020; Tabachnick and Fidell, 2013). If the answers given by preschool teachers exhibit a normal distribution, it is expressed to proceed to the construction of factor analysis (Metin, 2014). As a result of this application, Exploratory Factor Analysis (EFA) and confirmatory factor analysis (CFA) were applied to the scale data, which determined whether it exhibited a normal distribution or not. Basic Components Analysis (TBA) was used in exploratory factor analysis. In the scope of this study, the KMO (Kaiser-Meyer-Olkin) value, which indicates whether the factor analysis applied to the scale developed is appropriate, was examined. In addition, it was noted that the Barlett Test of Sphericity value, which indicates whether there is any correlation between the scale variables, is higher than one (Kline 2005).
In addition, importance was also given to the information that the number of factors in the scale model is equivalent to the number of factors with an eigenvalue of more than one, and the factor loads should be at least 0.30 (Tabachnick and Fidell, 2013). In order to determine the ideal factor structure, the necessary rotation operations were performed and according to the result of the rotation process, it was decided to apply the “oblique rotation” method. As a result of the rotation, attention was paid to the fact that the load value was not less than 0.30 and not boarding in the distribution of the data into factors. Besides, whether the factor structure obtained as a result of the EFA analysis is appropriate or not has been tested using Structural Equation Models. In this direction, it has been determined whether the factor model determined as a result of Exploratory Factor Analysis is appropriate with the Confirmatory Factor Analysis method. In Confirmatory Factor Analysis, RMSEA, CFI, GFI and X2 (chi-square) criteria were evaluated as criteria for determining the suitability of the model (Pallant, 2020; Tabachnick and Fidell, 2013). Exploratory Factor Analysis for the scale was tested with the SPSS 22.0 program, while the Lisrel 8.5.1 program was used to implement Confirmatory Factor Analysis.
Reliability Calculation Stage
As a result of factor analysis, the Cronbach alpha internal consistency coefficient and the reliability coefficients of the sub-factors of the final scale were calculated. It is desirable that this value is above 0.7. Low values are usually reached on scales with few items. That is why the Cronbach alpha value is closely related to the number of items included in the scale (Kline 2005).
FINDINGS
The findings of the research were obtained from the scale applied to 412 preschool teachers in order to prepare a valid and reliable opinion scale aimed at determining the self-efficacy of teachers working in preschool institutions regarding science teaching in the 2020-2021 academic year. The results obtained are presented under the following three headings:
• Findings Related to the Descriptive analysis of the Scale Data
• Findings on the Validity of the Scale
• Findings Related to the Reliability of the Scale
Detailed descriptions of these titles are given in the following sections.
Findings of Descriptive Analysis
Before the factor analysis of the scale, it was examined whether the data of the scale applied to 412 preschool teachers exhibited a normal distribution. In order to determine the distribution status of the data of the scale applied in this context, the skewness and kurtosis coefficients of the items were examined.
Table 2
The Descriptive Statistics of Scale Items
Item Skewness Kurtosis Item Skewness Kurtosis Item Skewness Kurtosis
I1 -1.361 1.406 I19 -.785 -.317 I37 -.771 -.243
I2 -.964 .542 I20 -.974 .237 I38 -1.244 1.152
I3 -.712 -.514 I21 -.489 -.636 I39 -1.020 -.158
I4 .732 -.282 I22 -.843 .114 I40 -1.266 .807
I5 .467 -.647 I23 -.632 -.264 I41 -.557 -.576
I6 -1.070 .615 I24 -.739 -.476 I42 -.204 -.708
I7 -1.149 .834 I25 -.693 -.428 I43 -1.126 .691
I8 -1.388 1.269 I26 -.963 .356 I44 -.658 -.503
I9 -1.242 .815 I27 -.058 -1.059 I45 -.866 .089
I10 -.585 -.668 I28 -.649 -.380 I46 -.567 -.343
I11 -.993 .145 I29 -1.156 .798 I47 -1.200 1.048
I12 -.891 .440 I30 -.897 -.214 I48 -1.028 .497
I13 -.636 -.854 I31 -1.000 .009 I49 -.697 -.250
I14 -.782 -.412 I32 -.769 -.414 I50 -.815 -.122
I15 -.583 -.440 I33 -.798 -.053 I51 -.513 -.675
I16 -1.334 1.352 I34 -.580 -.377 I52 -.514 -.549
I17 -.648 -.479 I35 -.545 -.521
I18 -1.077 .174 I36 -1.248 .975
Mean Median Variance Standard
Deviation
Skewness Kurtosis
Statistical Values 119. 43 203 1118.83 33.44 -.12 -135
Standard Error 1.64 .12 .240
When Table 2 is examined, it is seen that the skewness and kurtosis values of the items are between (-2) and (+2). Skewness and kurtosis values between (-2) and (+2) indicate that the scores participants receive from the items are distributed normally (George & Marley, 2010). Considering these values, it can be stated that the data of the self-efficacy scale applied to 412 preschool teachers exhibit a normal distribution.
Findings on the Validity of the Scale
The scope and appearance validity of the scale developed within the scope of the research were primarily examined. The content and face validity of the scale was provided by field experts, measurement and evaluation specialist and language expert. In order to ensure the structural validity of the scale consisting of 52 items, Exploratory Factor Analysis (EFA) and Confirmatory Factor Analysis (CFA) methods were applied first.
Exploratory Factor Analysis (EFA)
Before the EFA analysis, the results of the KMO and Barlett Test were examined to determine whether the data obtained from the study were suitable for factor analysis.
Table 3
The Results of the KMO and Barlett Tests of the Scale of Vision KMO and Bartlett's Test
Kaiser-Meyer-Olkin Measure of Sampling Adequacy. .96
Barlett's Test of Sphericity
Approx. Chi-Square 16465.64
df 1326
Sig. .000
When Table 3 is examined, it is seen that the KMO value is 0.96. According to Pallant (2020), the fact that the KMO value is greater than 0.6 means that a sufficient sample has been provided and that the sample is suitable for exploratory factor analysis (EFA). According to Tavşancıl (2002), the KMO value is considered to be excellent when it approaches 1, and unacceptable when it is below 0.5. Accordingly, the scale developed within the scope of the research is suitable for EFA. In addition, the fact that the significance value is below p<005 according to the Bartlett Test result means that the result is significant.
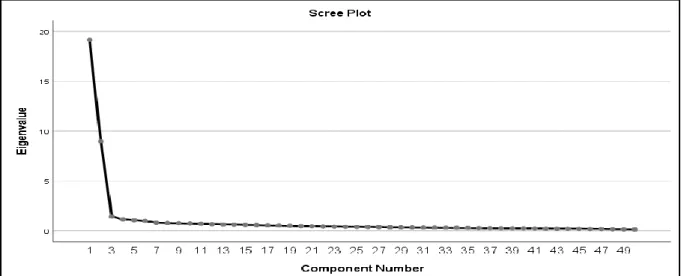
In determining the number of factors, the eigenvalue should be greater than one (Büyüköztürk, 2008), and the breaking point of the slope should be looked at in the line graph (Pallant, 2020). Such cases as the described variance ratio and the contribution of the factor to the total variance ratio are taken into account. As a result of the first EFA, items 13th and 42nd, which were determined to be overlapping, were removed from the scale. As a result of the second factor analysis conducted with the remaining 50 items, it was determined that the 5th item also showed overlapping and was removed from the scale. In order to determine the number of factors in the scale, the line graph of the eigenvalues of the scale items was looked at.
Figure 1. The Line Graph of the Eigenvalues of the Scale Items
When Figure 1 was examined, considering that a fracture occurred after two factors, the number of factors was limited to two and EFA was applied for the third time; item No. 4 showing overlapping was removed from the scale. As a result of EFA applied for the fourth time to a total of 48-item scale, the eigenvalues and variance values of the two-factor scale are given in Table 4.
Table 4
The Eigenvalues and Percentages of Variance of the Items in the Scale
Factor Eigenvalue
Percentage of Variance
Percentage of Total Variance
Factor 1 19.00 39.60 39.60
Factor 2 8.62 17.96 57.56
According to Table 4, it is seen that the 48 items included in the scale are collected under two factors whose eigenvalue is greater than 1. The total variance value of these two factors that they explain about the scale is 57.56%. According to Pallant (2020), it is an acceptable value for the total variance described to be over 40%.
In order to determine the items of the scale under two factors, “Oblimin”, the “oblique rotation method” was applied to the obtained data. In cases where the factors are considered to be related to each other, the “Oblimin” oblique rotation method is preferred (Tabachnick and Fidell, 2013). The factor items and loads formed as a result of the oblique rotation method of the Oblimin are given in Table 5.
Table 5
The items Under the Factors as a Result of the Rotation of the Oblique
Item
No Items
Factor 1
Factor 2 1 I can organize the science and nature corner in a way that attracts the attention of students. 0.835 47 I can support students to gain life skills through science activities. 0.820 16 I can ensure the active participation of students in preparing materials in the corner of science
and nature. 0.819
2 I can develop materials that will embody abstract concepts in science teaching. 0.811 12 I can develop material for science that will contribute to the mental development of students. 0.809
7 I can design materials with students that will support the development of fine and coarse motor
of their muscles. 0.809
26 I can design materials that will develop students' imagination. 0.809
9 I like to follow the innovations in science 0.806
36 I can organize out-of-class activities for students to socialize. 0.798 43 I can organize out-of-class events that will improve cooperation between students. 0.794
29 I can design science activities where students can observe. 0.792
38 I can create environments where students can work as a group during science activities. 0.790 45 I can design activities aimed at contributing to the cognitive development of students in the
corner of science and nature. 0.789
6 I can design events for special days and weeks with students in the science and nature corner. 0.788 48 I can help students understand the nature of science with science activities. 0.784 22 I can design original materials with materials from the corner of science and nature. 0.781 20 I can design different experiments suitable for the students' level. 0.770 33 I can provide students with scientific process skills through science activities. 0.765 40 I can take the necessary security measures during science activities. 0.760
8 I can grow plants with students in the schoolyard. 0.753
28 I can design science activities other than auxiliary books or resources. 0.746 15 I can use methods or techniques to correct misunderstandings in science. 0.716 51 I can evaluate students in science activities in an informal way (such as observation. rubric.
rating scales). 0.681
31 I can arrange a trip to the zoo with the students. 0.655
3 I can organize an animal feeding event with students in the schoolyard. 0.628 18 I can examine living things (worms. ants. frogs. etc.) in the schoolyard with students. 0.625 24 I can give feedback on students' misconceptions about science activities. 0.573
25 I find it difficult to use different methods and techniques when organizing science events. 0.805 49 I find it difficult to make the gains in the curriculum with science activities. 0.804 23 I have trouble developing science materials that will contribute to the affective development of
students. 0.794
52 I find it difficult to organize events that will allow them to access scientific knowledge in science
education. 0.794
21 I have a hard time deciding which method to choose in teaching abstract concepts. 0.791
32 I have problems with research and review studies at science events. 0.783
41 I have a hard time designing activities where students can gain scientific process skills. 0.780 34 I have trouble designing a new product in the corner of science and nature. 0.774 46 I find it difficult to develop original material for current and new topics. 0.771 44 I have a hard time doing science project execution work with students. 0.770 50 I find it difficult to use activities aimed at science achievements in the corner of science and
nature. 0.756
14 I have a hard time choosing science subjects suitable for students' readiness levels. 0.755
35 I have trouble preparing science materials that will contribute to the language development of
students. 0.731
17 I have a hard time designing educational materials that will contribute to the social development
of students. 0.721
19 I have trouble associating concepts in science activities with everyday life. 0.719 11 I do not have the experience to prepare the corner of science and nature. 0.699 37 I find it difficult to take safety precautions despite the dangerous situations that may occur during
out-of-class activities. 0.699
39 I do not have the skills to organize a library trip with students. 0.677
10 I have a hard time choosing science subjects suitable for students' readiness levels. 0.676 30 I don't feel comfortable experimenting with students in the science corner. 0.623 27 I need help organizing a trip to the National Park and Gardens with students. 0.443
When Table 5 is examined, it is seen that there are 27 items under the first factor and 21 items under the second factor. When the items collected under the factors were examined, it was seen that all the items collected under the first factor contained positive statements and the items collected under the second factor contained negative statements. Accordingly, the first factor was determined as: “The Belief in Having Self-Efficacy in Science Teaching”
(BSEST)”, the second factor was determined as: “Belief in Self-Inadequacy for Science Teaching (BSIST)”.
The correlation values deciphering the relationship between the factors determined in the scale are shown in Table 6.
Table 6
Correlations between Scale Factors
BHSEST BSIST
BHSEST 1 .306
BSIST .306 1
The Pearson correlation coefficient between two variables or factors is between 0.70 - 1.00 at a high level; if it is between 0.30 - 0.69 at a moderate level, if it is between 0-0,29, it indicates that there is a low level a positive relationship, if this coefficient is negative, it indicates that there is a negative relationship (Pallant, 2020). When Table 6 is examined, the correlation between the factors, if it is above 0.3, it can be said that it is convenient to use
“Oblimin” as the rotation method.
Confirmatory Factor Analysis (CFA)
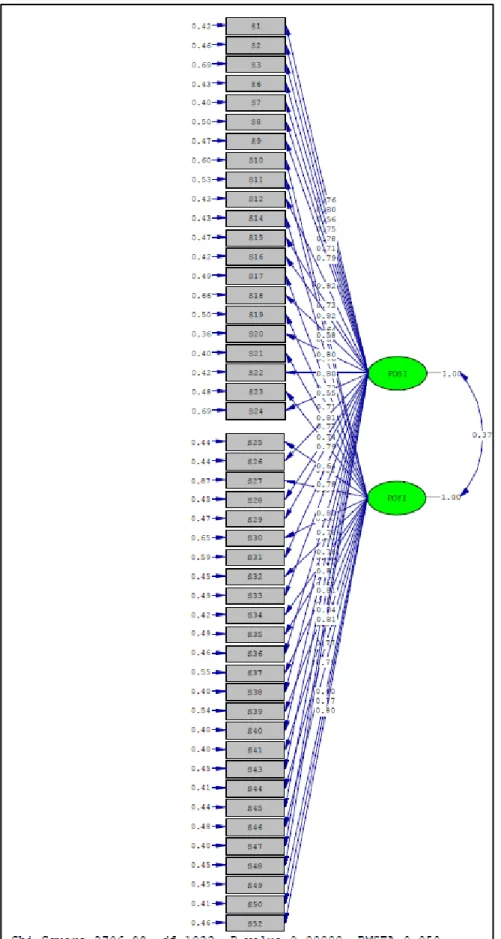
The purpose of confirmatory factor analysis is to examine the degree to which a certain structure is confirmed by the data considered in advance (Büyüköztürk et al., 2013). The two- factor structure obtained from the exploratory factor analysis of the preschool teachers’ science teaching self-efficacy scale was analyzed and the suitability of the structure was examined according to the results of the modification index and compliance statistics. A cross-section of the CFA result of the 48-item scale consisting of a two-factor structure is shown in Figure 1.
In the confirmatory factor analysis, the chi-square test and the value of freedom (vf) results were first looked at. If the value obtained as a result of dividing the found chi-square value by the value of df is five or below, the structure is an acceptable value (Hooper and Mullen, 2008; Munro, 2005; Şimşek, 2007), the fact that this ratio is less than three indicates that there is a perfect fit (Jöreskog and Sörbom, 1993; Sümer, 2000; Kline, 2005). In the study,
the x2 value of the scale was determined as = 2436.43; vf=1033 (p<0.00); (χ2/vf) =2.36.
According to these values, it can be said that the structure of the scale is in perfect fit. In addition, in order to verify the two-factor structure of the scale, the RMSEA value must be between 0.050 and 0.080 (Seçer, 2015). In order to be able to say exactly which factors have been verified, compliance indices should also be looked at. In order to verify the two-factor structure, it is necessary to compare the model fit indices obtained as a result of the analysis and the model fit indices given in the field article (Schumacher and Lomax, 2004). If it is determined that the model fit indices obtained in this study are in the desired interval or value, the two-factor structure of the scale is confirmed.
The fit indices, acceptable value and perfect fit limit values calculated with the CFA of the scale are given in Table 7.
Table 7
Acceptable value, perfect fit and appropriate values of the Self-efficacy scale.
The criterion
of compliance Acceptable Limit The Limit of Perfect fit
The Limit of the Self- efficacy Scale
NFI =0,90 and above =0,95 and above 0,91
NNFI = 0,90 and above = 0,95 and above 0,90
IFI = 0,90 and above = 0,95 and above 0,91
RFI = 0,90 and above = 0,95 and above 0,92
CFI = 0,95 and above = 0,97 and above 0,91
GFI = 0,85 and above = 0,90 and above 0,87
AGFI = 0,85 and above = 0,90 and above 0,85
RMR =0,050 - 0,080 in between = 0,000 - 0,050 in between 0,75 RMSEA =0,050 - 0,080 in between = 0,000 - 0,050 in between 0,058
When Table 7 is examined, it is seen that the RMSEA value is 0.058 according to the CFA result obtained from the study. It is acceptable that the RMSEA value is between the range of 0.005-0.080 (Field, 2005). In addition, the fact that the NFI, NNFI, IFI, RFI and CFI values are above 0.90 and the GFI and AGFI values are above 0.85 indicates that the factor structures of the scale are within acceptable limits (Hair et al., 1998). As a result of factor analyses, it is seen that the confirmatory factor model adaptation indices of the two-factor structure of the 48- item scale aimed at determining teacher self-efficacy in preschool science education are within the desired range and within acceptable limits.
Figure 2. The Confirmatory Factor Analysis Model of the Scale Items
Findings on the Reliability of the Scale
After the construct validity was established in the study, the Cronbach Alpha reliability coefficient α=0.965 was found in the reliability analysis calculation of the scale consisting of 48 items and it was concluded that the entire scale was reliable because this value was above 0.7. The results of the reliability coefficient of each factor in the scale are given in Table 8.
Table 8
Reliability Coefficients of the Factors
Factors
Cronbach Alpha Coefficient 1st Factor: The Belief in Having Self-Efficacy in Science Teaching (BSEST) 0,97 2nd Factor: Belief in Self-Inadequacy for Science Teaching (BSIST) 0,95
Science Teaching Self-Efficacy Scale (STSES) 0,965
When Table 8 is examined, as a result of the reliability calculation performed for each factor of the scale, it can be said that the scale prepared is reliable because the Cronbach alpha for each factor is above 0.70.
CONCLUSION, DISCUSSION AND RECOMMENDATIONS
Within the scope of the study, a valid and reliable scale was developed in order to determine the self-efficacy of preschool teachers in science teaching. The validity and reliability study of the 52-item draft scale was conducted with 412 teachers working in preschool institutions. In order to determine the self-efficacy of preschool teachers for science education, the developed STSES is of the Likert-type and has a five-point rating. The scale consists of the options”
Always (5)”, “Most of the time (4)”, “Sometimes (3)”, “Rarely (2)”, “Never (1)”.
In order for the scale developed to determine the self-efficacy of preschool teachers for science teaching to be valid and reliable, the issues that need to be considered are important.
In a scale development study, in order for the prepared scale to be valid, it is necessary to ensure the validity of the scope, appearance and structure of the scale (Field, 2005; Kline, 2005; Metin, 2014; Pallant, 2020). The scope validity and appearance validity of the scale prepared in the study were tried to be provided in accordance with the expert opinions. In the studies conducted for the development of the scale, it is seen that expert opinions are used to ensure the validity of the content and appearance of the scale (Aksu et al., 2014; Buldur and Alisinanoğlu 2020;
Maier et al., 2013; Tabachnick and Fidell, 2013; Tschannen-Moran and Hoy 2001).
In order to ensure the structural validity of the scale, exploratory factor analysis is used, which allows the structures measuring similar characteristics to be grouped under similar factors (Pallant, 2020). The Barlett Test of Sphericity, which shows whether a scale is suitable for factor analysis and shows whether there is a correlation between the value of KMO and the scale variables, is taken into account (Kline 2005). Within the scope of the study, it was determined that the KMO value of the self-efficacy scale was 0.96 and the Barlett Test of Sphericity value was (16465.64; p<0.05). The fact that the KMO value is greater than 0.6 indicates that a sufficient sample has been provided. It is stated that the Bartlett Test result is below the significance value of p<0.05 greater than one, which is an indication that the scale is suitable for factor analysis (Tabachnick and Fidell, 2013; Pallant, 2020). In this context, it can be said that the scale developed is suitable for exploratory factor analysis.
As a result of the applied factor analysis, it was determined that the self-efficacy scale for science teaching has a structure consisting of 48 two-factor items, explaining 57.56% of the total variance. Kline (2005) stated that the scale developed in the social sciences can be considered sufficient to explain 41% of the total variance. In this regard, it can be said that the total percentage of variance of the scale is sufficient. There are 27 items below the first factor of the scale consisting of 48 items and 21 items below the second factor. According to Seçer (2015), there should be at least 2 items accepted in the factor, and the more items there are under each factor, the reliability of the scale and the level of explanation of the factors increase.
In this regard, it can be concluded that the number of items collected from each factor of the scale is more, the percentage of explanation of the factors is higher, and the factors of the scale are appropriate.
The names of the two factors that created the scale were determined as; the first factor:
“The Belief in Having Self-Efficacy in Science Teaching” (BSEST)”, the second factor:
“Belief in Self-Inadequacy for Science Teaching (BSIST)”. Under the "Belief in Having Self- Efficacy in Science Teaching" factor, there are self-efficacy items for areas such as creating a science and nature corner, developing materials, working collaboratively, designing experiments, and imparting scientific process skills. Under the factor of " Belief in Self- Inadequacy for Science Teaching ", there are negative items expressing the inability to use different methods and techniques, to access scientific knowledge, to conduct research and review studies, to ensure the development of students for different learning areas. When the items included in the scale are examined, it is seen that the self-efficacy scales developed by Özbey and Alisinanoğlu (2009) and Buldur and Alisinanoğlu (2020) for preschool science education are focused on similar issues in the literature. The self-efficacy scale developed within the scope of this study, unlike other scales, also took into account the more specific competencies of teachers rather than determining their general self-efficacy status. In the scope of the study, the items related to the self-efficacy of teachers to combine field knowledge, pedagogical knowledge and pedagogical knowledge with field knowledge are included. In addition, the inclusion of self-efficacy items aimed at combining teachers' knowledge with teaching programs, using different methods and techniques in their courses, conducting measurement and evaluation activities in their courses also differs in terms of measuring qualities that are not measured at other scales, and contributes to the field. In the literature, it is seen that preschool teachers emphasize the importance of using pedagogical content knowledge in science teaching (Kutluca, 2021).
To ensure the structural validity of the scale, it is necessary to test whether the factor structure obtained as a result of EFA analysis is appropriate using Structural Equation Models.
The scale developed within the scope of the study, as a result of the Confirmatory Factor Analysis method and Exploratory Factor Analysis methods, it was determined whether the factor model determined was appropriate or not. The x2 value of the scale was found to be: = 2436.43; sd=1033 (p<0.00); (χ2/sd) =2.36. If the value obtained as a result of dividing the found chi-square value by the value of df is five or less, the structure is an acceptable value (Hooper and Mullen, 2008; Munro, 2005; Şimşek, 2007). The fact that this ratio is less than three indicates that it is a perfect fit (Jöreskog and Sörbom, 1993; Sümer, 2000; Kline, 2005).
According to these values, it can be said that the structure of the scale is in perfect harmony.
In addition, as a result of CFA, it was determined that the RMSA value of the scale was 0.058.
In confirmatory factor analysis, it is acceptable that the RMSEA value is between 0.050 - 0.080, it is perfect to be between 0.000-0.050, it is unacceptable to be above 0.080 (Pallant, 2020).
When the RMSA value of the scale within the scope of the study is examined, it is seen that
the scale is at the acceptable limit. However, in order to be able to say exactly that the two- factor structure of the scale has been verified, compliance indices should also be looked at such as NFI, NNFI, IFI, RFI, CFI, GFI and AGFI (Hair, et al., 1998). Within the scope of the study, it is seen that the NFI, NNFI, IFI, RFI and CFI compliance index values of the scale are above 0.90 and the GFI and AGFI compliance index values are above 0.85. Hair, et al. (1998) considering the critical values determined by, for these indices, it shows that the values of the comparative fit index calculated in this study are within acceptable limits. As a result of factor analyses carried out, it is seen that the confirmatory factor model adaptation indices of the two- factor structure of the 48-item scale aimed at determining teacher self-efficacy in preschool science education are within the desired range and within acceptable limits.
In order to determine the reliability of the 48-item scale, the Cronbach alpha coefficient was calculated, which was determined by the EFA and CFA model. The Cronbach alpha value for the first factor of the scale was found to be 0.95 for the second factor of 0.97, and the Cronbach alpha value for the whole scale was found to be 0.965. The Cronbach alpha value, which is the acceptable reliability coefficient of the scales for the entire scale and its sub- dimensions, is 0.70 and above, which means that the scale is reliable (Büyüköztürk, 2007). In this context, the scale developed within the scope of the study has sufficient validity and reliability conditions to measure the self-efficacy of preschool teachers for science education.
Similar to the literature, when the scale developed by Buldur and Alisinanoğlu (2019) to determine the self-efficacy of preschool teacher candidates in science education was examined;
it was seen that the researchers developed a valid and reliable scale which was a single factor, 16 items and a cronbach alpha coefficient of 0.92.
As a result, in this study, a valid and reliable two-dimensional scale consisting of 48 items was developed to determine the self-efficacy of preschool teachers in science education.
The lowest score to be taken from the scale is 48 and the highest score is 240. The high score to be obtained from the scale indicates that the teachers' self-efficacy towards science education is high.
REFERENCES
Aksu, Z., Metin, M., & Konyalioğlu, A. C. (2014). Development of the pedagogical content knowledge scale for pre-service teachers: The validity and reliability study. Mediterranean Journal of Social Sciences, 5(20), 1365–1377
Anderson, K., & Gulberg, A. (2014). What is science in preschool and what do teachers have to know to empower children? Cult Stud of Sci Educ, 9, 275–296
Aydoğdu, B., & Peker, M. (2016). Science and mathematics teaching efficacy beliefs of pre-school teachers.
Universal Journal of Educational Research, 4(11), 2541-2550.
Bandura, A. (1997). Self efficacy: The exercise of control. Freeman
Bryman, A., & Cramer, D. (2001). Quantitative data analysis with SPSS release 10 for Windows: A guide for social scientists. Routledge.
Buldur, A. & Alisinanoğlu, F. (2020). Okul öncesinde fen eğitimine yönelik öz yeterlik ölçeğinin geliştirilmesi [Developing a self-efficacy scale for pre-school science education]. Kastamonu Education Journal, 28(1), 512-520. https://doi.org/10.24106/kefdergi.3704
Büyüköztürk, Ş. (2007). Sosyal bilimler için veri analizi el kitabı [Manual of data analysis for social sciences].
Pegem Yayıncılık.
Büyüköztürk, Ş. (2008). Veri analizi el kitabı, istatistik, araştırma deseni spss uygulamaları ve yorum [Data analysis handbook, statistics, research design spss applications and interpretation] (9th Ed.). Baskı, Pegem-Akademi, 31-37; 167-182.
Büyüköztürk, Ş., Kılıç Çakmak, E., Akgün, Ö. E., Karadeniz, Ş. & Demirel, F. (2015). Bilimsel araştırma yöntemleri [Scientific research methology] (19th Ed.). Pegem Akademi.
Chan, D. W. (2003). Multiple intelligences and perceived self-efficacy among Chinese secondary school teachers in Hong Kong. Educational Psychology, 23(5), 521-533, https://doi.org/10.1080/0144341032000123778 Demiriz, S. (2001). Okul öncesi eğitim kurumlarındaki fen ve doğa etkinlikleri ile ilgili uygulamaların belirlenmesi [Determining the practices related to science and nature activities in pre-school education institutions] IV. Science Education Congress, Ankara
Field, A. (2005). Discovering statistics using SPSS (2nd Ed.). SAGE
Fraenkel, J. K., Wallen, N. E.& Hyun, H. (2012). How to design and evaluate research in education (8th ed.). Mc Graw-Hill, Inc
George, D., & Mallery, M. (2010). SPSS for Windows step by step: A simple guide and reference. 17.0 update (10a ed.). Pearson.
Gibson, S., & Dembo, M. H. (1984). Teacher efficacy: A construct validation. Journal of Educational Psychology, 76(4), 569–582.
Gömleksiz, M. N. & Serhatlıoğlu, B. (2013). Okul öncesi öğretmenlerinin öz-yeterlik inançlarına ilişkin görüşleri [Preschool teachers' views on self-efficacy beliefs]. International Periodical for The Languages, Literature and History of Turkish or Turkic Volume 8/7 Summer 2013, p. 201-221, Ankara-Turkey Gözüm, A. İ. C., & Güneş, T. (2018). Fen bilimleri öğretimi öz yeterlik ölçeği: geçerlik ve güvenirlik çalışması
[Science teaching self-efficacy scale: validity and reliability study]. Mersin Üniversitesi Eğitim Fakültesi Dergisi,14(3): 1176-1199.
Hair, J. F. Jr., Anderson, R. E., Tatham, R. L., & Black, W. C. (1998). Multivariate data analysis (5th Ed.). Prentice Hall.
Hooper, D., Coughlan, J., Mullen, M. (2008). Structural equation modelling: Guidelines for determining model fit. Electron J Bus Res Methods 6, 53–60. https://doi.org/10.1037/1082-989X.12.1.58
İsrael, E. (2007). Öz-düzenleme eğitimi, fen başarısı ve öz-yeterlilik [Self-regulation education, science achievement and self-efficacy]. Doktora Tezi, Dokuz Eylül Üniversitesi Eğitim Bilimleri Enstitüsü, İzmir.
Jerusalem, M., & Schwarzer, R. (1981). Fragebogen zur Erfassung von "Selbstwirksamkeit. Skalen zur Befindlichkeit und Persoenlichkeit In R. Schwarzer (Hrsg.). (Forschungsbericht No. 5). Berlin: Freie Universitaet, Institut fuer Psychologie.
Jöreskog, K. G., & Sörbom, D. (1993). Lisrel 8: Structural equation modeling with the simplis command language. Erlbaum Associates Publishers.
Karasar, N. (2009). Bilimsel araştırma yöntemi [Scientific research method] (20th Ed.). Nobel Yayın Dağıtım.
Kesgin, E. (2006). Okul öncesi eğitim öğretmenlerinin öz-yeterlilik düzeyleri ile problem çözme yaklaşımlarını kullanma düzeyleri arasındaki ilişkinin incelenmesi (Denizli İli Örneği) [Examining the relationship between preschool teachers' self-efficacy levels and their level of using problem solving approaches (Denizli Province Example)]. Yüksek Lisans Tezi. Pamukkale Üniversitesi. Denizli.
Kline, R. B. (2005). Yapısal eşitlik modelleme ilkeleri ve uygulaması [Structural equation modeling principles and application] (2nd Ed.). New York.
Kutluca, A. Y. (2021). Investigation of the interactions among preschool teachers’ components of pedagogical content knowledge for early science teaching. Southeast Asia Early Childhood Journal,10(1), 117-137.
https://doi.org/10.37134/saecj.vol10.1.10.2021
Küçük, M., Altun, E. & Paliç, G. (2013) Sınıf öğretmenlerinin fen öğretimi öz-yeterlik inançlarının incelenmesi:
rize ili örneklemi [Examination of primary school teachers' self-efficacy beliefs in teaching science: Rize province sample]. Amasya Üniversitesi Eğitim Fakültesi Dergisi 2(1), 45-70.
Maier, M. F., Greenfield, D. B., & Bulotsky-Shearer, R. J. (2013). Development and validation of a preschool teachers’ attitudes and beliefs toward science teaching questionnaire. Early Childhood Research Quarterly, 28, 366-378.
Menon, D. (2020). Influence of the sources of science teaching self-efficacy in preservice elementary teachers' identity development. Journal of Science Teacher Education, 31(4), 460-481.
https://doi.org/10.1080/1046560X.2020.1718863
Metin, M. (2010). A study on developing a general attitude scale about environmental issue for students in different grade level. Asia-Pacific Forum on Science Learning and Teaching, 11(2), 1-19.
Metin, M. (2014). Nicel veri toplama araçları [Quantitative data collection tools], S 161-214, Metin, M (Ed.).
Kuramdan uygulamaya eğitimde bilimsel araştırma yöntemleri. 1 Baskı, Pegem Akademi.
Metin, M., Birişçi, S., Coşkun, K. & Kolomuç, A. (2012a). A study on developing “basic computer use performance scale (BCUPS)” for primary students. Procedia Social and Behavioral Sciences, 46, 1771- 1775.
Metin, M., Kaleli Yılmaz, G., Coskun, K. & Birişçi, S. (2012b). Developing an attitude scale towards using instructional technologies for pre-service teachers. The Turkish Online Journal of Educational Technology (TOJET), 11(1), 36-45.
Munro, B. H. (2005). Statistical methods for health care research. Lippincott Williams & Wilkins.