He showed great support and encouragement during the process as I completed this research project. She has given me valuable suggestions and advice which are useful for me to improve this research project. In addition, this research project is also dedicated to my family and friends as an appreciation for their help in my research project.
Last but not least, I would like to dedicate this research paper to future researchers to help them in their research in the future. I proposed “A Study of Brand Loyalty of Apple Product Users in Malaysia” as the research project topic. The main objective of conducting this research project is to investigate the factors influencing consumer brand loyalty towards Apple products in Malaysia.
RESEARCH OVERVIEW
- Introduction
- Research Background
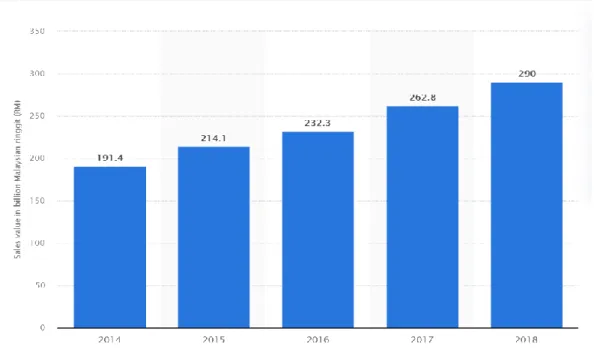
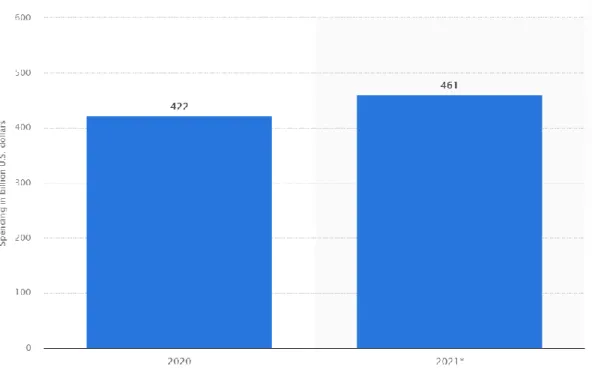
- Consumer Electronic Industry
- Problem Statement
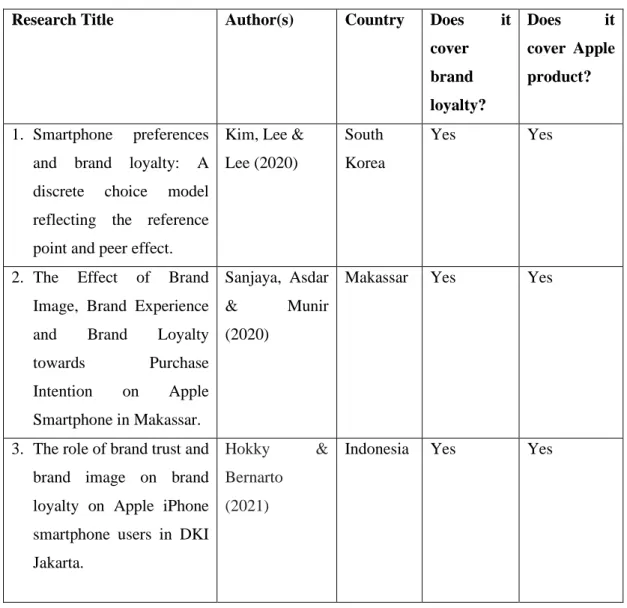
- Research Gap
- Research Objective
- General Objective
- Research Questions
- Significance of Study
To investigate whether there is a relationship between perceived value and brand loyalty among Apple products in Malaysia. IV). To investigate whether there is a relationship between brand uniqueness and brand loyalty among Apple products in Malaysia. Is there a significant relationship between brand awareness and brand loyalty for Apple products in Malaysia? . ii).
Is there any significant relationship between perceived quality and brand loyalty among Apple products in Malaysia? . iii). Is there any significant relationship between brand personality and brand loyalty among Apple products in Malaysia?. Is there any significant relationship between brand uniqueness and brand loyalty among Apple products in Malaysia.
LITERATURE REVIEW
- Introduction
- Customer-Based Brand Equity
- Review of Literature
- Brand Loyalty
- Independent Variable
- Brand Awareness
- Perceived Quality
- Perceived Value
- Brand Personality
- Brand Association
- Brand Uniqueness
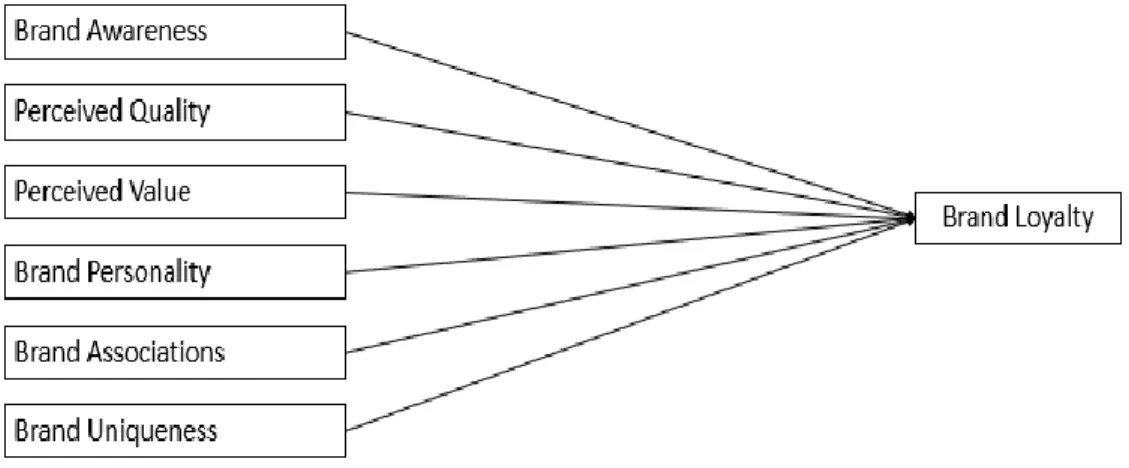
- Conceptual Framework
- Hypothesis Development
- Brand Awareness
- Perceived Quality
- Perceived Value
- Brand Personality
- Brand Association
- Brand Uniqueness
- Conclusion
According to (Romaniuk & Nenycz-Thiel, 2013), the CBBE approach raises serious concerns about causality, especially if there is a relationship between past brand loyalty and current brand associations. Therefore, brand loyalty can improve brand reputation by maintaining a relationship between it and its customers. It further explains that brand image partially influences the correlation between perceived quality and brand loyalty.
They further mentioned that brand uniqueness is one of the main dimensions of brand equity that contributes to customer brand loyalty. Therefore, they concluded that brand personality perceptions influence brand loyalty on smartphone purchase intention. Furthermore, researchers Pinson and Brosdahl (2014) stated that brand personality is positively correlated with brand loyalty.
METHODOLOGY
- Introduction
- Research Design
- Data Collection Method
- Primary Data
- Secondary Data
- Sampling Design
- Target Population
- Sampling Frame and Location
- Sampling Elements
- Sampling Size
- Sampling Technique
- Research Instrument
- Questionnaire Design
- Pilot Test
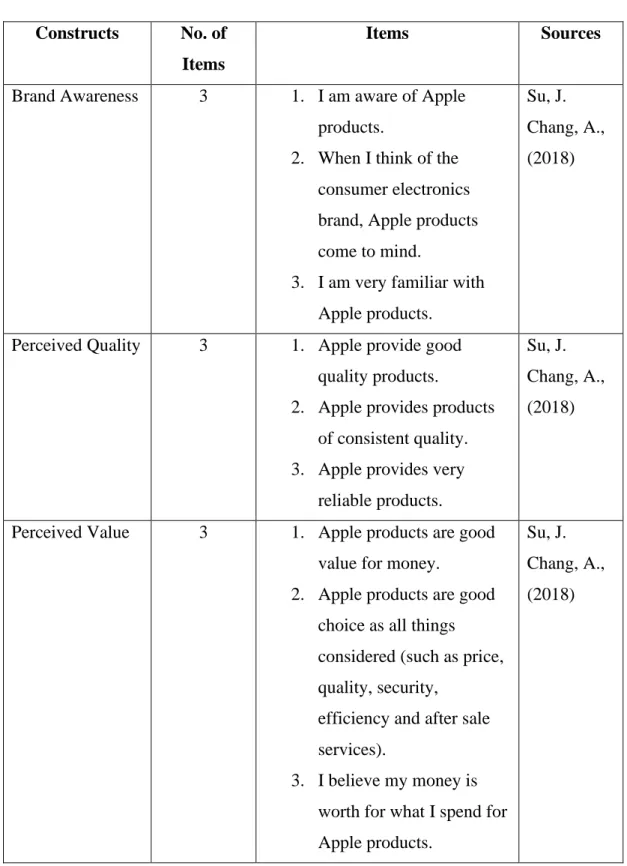
- Construct Measurement
- Scale of Measurement
- Nominal Scale
- Interval Scale
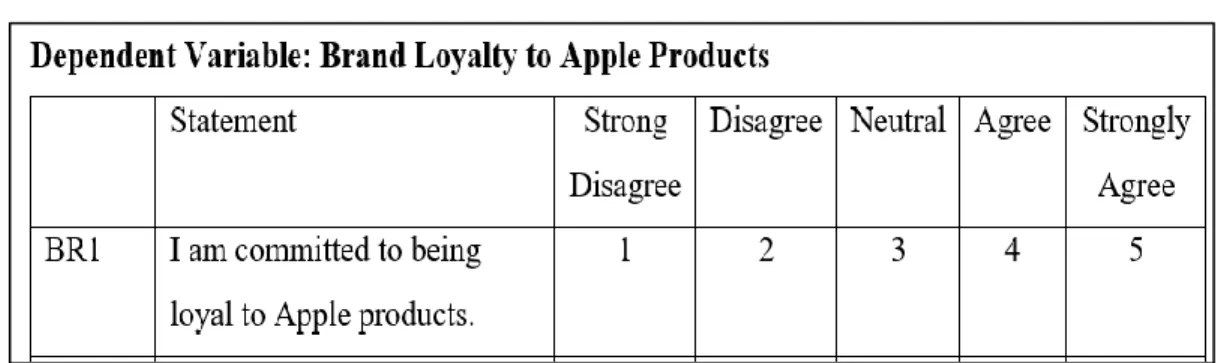
- Likert Scale
- Data Processing
- Questionnaire Checking
- Data Editing
- Data Coding
- Data Analysis
- Descriptive Analysis
- Inferential Analysis
- Conclusion
In this research, primary and secondary data, which are the main sources, were used to collect data. In this research, the questionnaire was applied as the primary source of data and information to obtain accurate outcomes using SPSS analysis. The location and age range of respondents who use Apple products in Malaysia were determined by the responses of the target audiences.
The reason we focus on potential respondents who are genuine Malaysian users of Apple products is because they are more aware of the aspects that influence brand loyalty when using Apple products. In addition, the test samples will be examined before the survey is actually distributed. A well-designed questionnaire allows researchers to collect essential and crucial information from respondents, which helps in achieving the research objectives while providing reliable data.
The first part (Section A) consists of 3 questions based on general information about users of Apple products. In this research, 30 sets of surveys were distributed to the target respondents to assess the reliability of the questionnaire before proceeding to the full test. Based on Zikmund et al. 2003), data checking and adjustments for omissions, consistency, and readability are all part of the data editing process.
Data coding helps the researcher organize the items in the questionnaire by assigning a code or number to each question to indicate the most likely answer, meaning that the researcher has assigned a serial number to all data in the questionnaire. For example, Section C of the survey represents strongly disagree, 2 for disagree, 3 for neutral, 4 for agree, and 5 for strongly agree. Alpha is used to measure the reliability of the variables: brand awareness, perceived quality, perceived value, brand personality, organizational associations and brand uniqueness in the reliability test.
It considers all the factors to determine how they affect the outcome (Nathans, Oswald & Nimon, 2012).
DATA ANALYSIS
- Introduction
- Descriptive Analysis
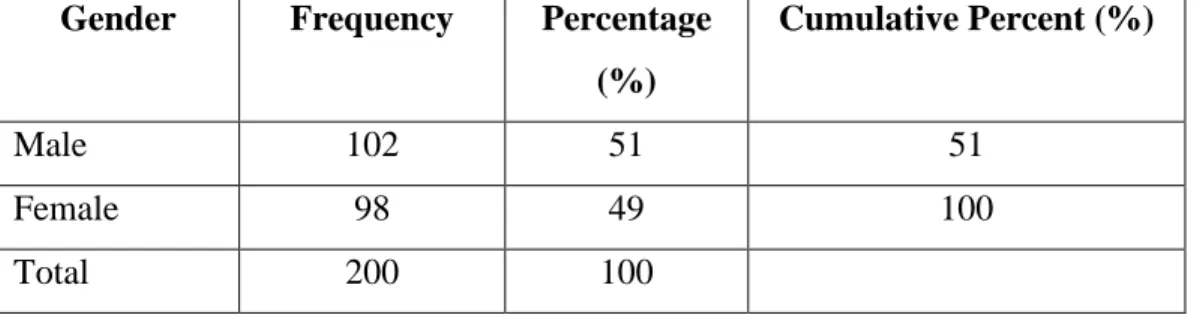
- Respondents’ Demographic
- Central Tendency
- Scale Measurement
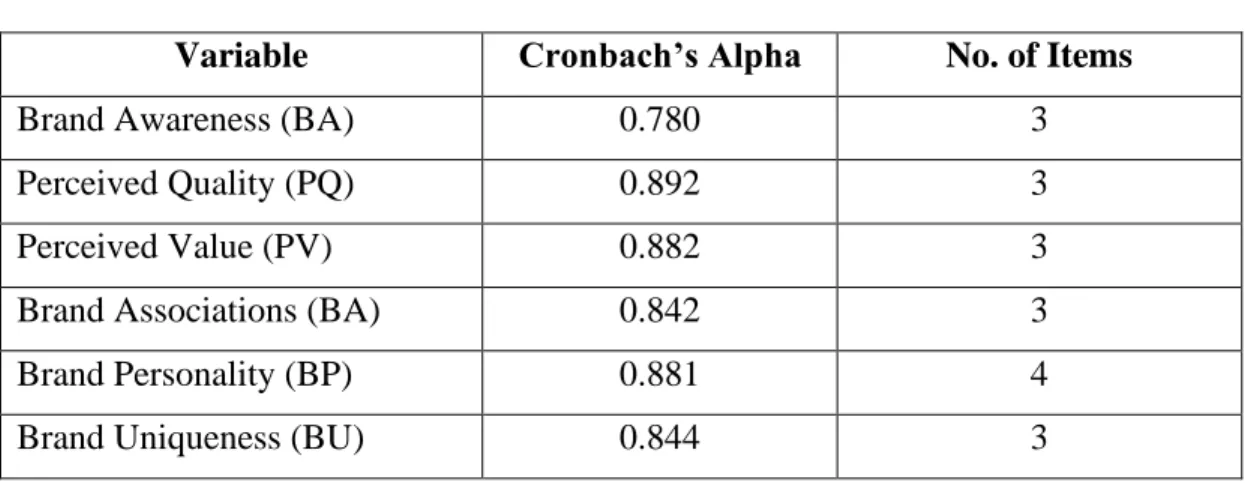
- Reliability Test
- Inferential Analysis
- Multiple Linear Regression
- Hypothesis Testing
The statement "I will continue to buy Apple products" has the highest mean value and the lowest standard deviation value of 4.50 and 0.634. While the statement "Apple products would be my first choice when considering smartphones, laptops, etc." had achieved the lowest mean value and highest standard deviation value of 4.35 and 0.849. Whereas the statement “I am very familiar with Apple products” achieved the lowest mean of 4.43 and the highest standard deviation of 0.669.
PV2 Apple products are a good choice considering everything (such as price, quality, security, efficiency and after-sales services). From Table 4.8 indicated, the statement "I believe my money is worth for what I spend for Apple products" has the highest mean value of 4.43 with the lowest standard deviation value of 0.606, 3 in the list. Moreover, the statement “Apple products are good value for money” had the lowest mean value of 4.34, with the highest standard deviation value of 0.726.
Furthermore, most of the respondents strongly agreed with all statements, which 53.5% for the statement "Apple products are interesting," 62% for the statement "Apple products are attractive. The highest average was achieved under the statement "The company that produces Apple products is reliable" with a score of 4.51. While the lowest average score was the statement "I prefer the company that produces Apple products" with a 4.41.
Most respondents also strongly agreed with all statements, with 48% for the statement "I trust the company that makes Apple products", 49% for the statement. 34;I prefer the company that produces Apple products", and 57% for the statement "The company that produces Apple products is reputable". The highest average was scored under the statement "Apple products really stand out from other brands" with 4.62.
While the lowest mean score was the statement "Apple products are special from other brands" with 4.53.
DISCUSSION, IMPLICATION AND CONCLUSION
Introduction
Summary of Statistical Analysis
Furthermore, 30% of the respondents' income per month consists of lack of income (students), while 27% of the respondents have a monthly salary ranging from RM4,000 to RM9,999. In addition, the central tendency for the summary of means and standard deviation for all variables in this study is as follows. The 34;agree" and "strongly agree" options in the research questions was 4.3 to 4.58, and the standard deviation was also in the range of 0.5 to 0.7, indicating that the data were well spread in the mean and proving that most of respondents agreed and strongly agreed with the statements in the survey questionnaires.
After the reliability test, Cronbach's alpha is 0.75, which means that the variables are trustworthy and suitable in this research. On the other hand, the coefficient of determination (R^2) for brand loyalty of Apple product users is 0.523. Consequently, the findings show that the independent variables and the dependent variable have a moderate linear relationship.
Discussion of Major Findings
- Relationship between Brand Awareness and Brand Loyalty of
- Relationship between Perceived Quality and Brand Loyalty of
- Relationship between Perceived Value and Brand Loyalty of
- Relationship between Brand Personality and Brand Loyalty of
- Relationship between Brand Association and Brand Loyalty of
- Relationship between Brand Uniqueness and Brand Loyalty of
Therefore, H3 is accepted as there is a significant relationship between perceived value and brand loyalty among Apple product users. Therefore, the findings from the study are acceptable and perceived value has a significant relationship with brand loyalty among Apple product users. Based on the significance level analysis, the results showed that the p-value is 0.037, which is less than 0.05.
Therefore, H4 is accepted because there is a significant relationship between brand personality and brand loyalty among users of Apple products. According to Tangsritrakul and Anantachart (2019), brand personality has a substantial beneficial impact on brand loyalty, which has been proven, and brand personality can lead to brand loyalty. As a result, the study's findings are acceptable and brand personality has a significant relationship with brand loyalty among users of Apple products.
Thus, H5 is rejected as there is an insignificant relationship between brand associations and brand loyalty of Apple product users. Oyenuga, Ahungwa and Onojia (2021) stated that brand association has a positive and less impact on brand loyalty. Therefore, this research result was rejected as there is an insignificant relationship with brand loyalty of Apple product users.
Based on the significance level analysis, the results showed a p-value of 0.035, which is lower than 0.05. Therefore, H6 is accepted as there is a significant relationship between brand uniqueness and brand loyalty among Apple product users. From Chansuk and Chaipoopirutana's (2020) research, brand uniqueness has a significant direct effect on brand loyalty by encouraging consumers to repurchase in the future.
This result of the study is therefore acceptable, and brand uniqueness has a significant relationship with brand loyalty among users of Apple products.
Implications of Study
- Managerial Implication
Limitations and Recommendation of the study
Conclusion
1991), Managing Brand Equity: Capitalizing on the Value of a Brand Name, The Free Press, New York, NY. The Impact of Service Quality, Corporate Image and Perceived Value on Brand Loyalty with the Presence and Absence of Customer Satisfaction: A Study of Four Service Sectors of Pakistan. An integrated model of the influence of perceived quality, perceived value, brand association, brand awareness and brand uniqueness on brand loyalty towards a luxury brand in Bangkok, Thailand.
The chain of effects from brand trust and brand influence on brand performance: the role of brand loyalty. The Effects of Social Media Brand Personality on Brand Loyalty in the Latvian Banking Industry: The Mediating Role of Brand Equity. The Role of Brand Trust and Brand Image on Brand Loyalty in Apple iPhone Smartphone Users in DKI Jakarta.
Smartphone preferences and brand loyalty: A discrete choice model reflecting the reference point and peer effect. Retrieved from http://www.brad.ac.uk/management/media/management/els/Introduction-. 2018), "The chain of effects of brand personality and functional congruence to stages of brand loyalty: the moderating role of gender", Asia Pacific Journal of Marketing and Logistics, Vol. Effect of Brand Equity on Consumer Behavior among Students of Veritas University, Nigeria: A Study of Apple Smartphones.
Journal of Management and Marketing Research, 14, 1. The effect of brand image, price and brand awareness on brand loyalty: the rule of customer satisfaction as a mediating variable. The effect of brand image, brand experience and brand loyalty on purchase intent on an Apple smartphone in Makassar. Investigating the impact of brand image and brand loyalty on brand equity: the mediating role of brand awareness.
The main purpose of this study is to conduct research on the brand loyalty of Apple products by consumers in Malaysia.