This project, which consists of three studies, aims to develop CNN classifiers that are better suited for processing EEG signals and to identify the factors that affect the performance of the CNN classifiers, based on the EEG data obtained from the experiments , who studies the influence of music and emotions on the human brain. 54 3.10 Location layout of EEG channels in SEED experiment 55 3.11 Architectural details of (a) the original ResNet18 and its.
CONCLUSION 107
Background
Electroencephalography
For example, EEG is particularly crucial for the diagnosis of nonconvulsive seizure and nonconvulsive status epilepticus (Kaplan, 2007). Furthermore, EEG is used in various cognition studies, such as to map the functional brain topology for the cognitive task of interest.
Challenges Faced in EEG Signal Classification
In the multi-channel time series of EEG data, each different EEG channel measured at different locations on the scalp can be embedded with different relevant features, adding to the complexity of the manual identification of useful EEG features. Many useful EEG signal characteristics may still be beyond the current body of knowledge of the research community.
Deep Learning and Convolutional Neural Network
Each of the concepts is defined as a function of simpler concepts or concepts of a lower hierarchical level (Goodfellow et al., 2016a). There are three important characteristics of CNNs that allow improving the performance of a machine learning system, namely, sparse interactions of computational nodes, parameter sharing, and translational equivariant representation (Goodfellow et al., 2016b).
Problem Statement
CNN is inherently not equivalent to other types of transformations such as rotation, also EEG signals do not usually undergo rotational transformation. Although the potential of a deep learning model as a feature extractor and classifier operating on simple EEG signals would likely be limited by the current size of the available EEG dataset, the growing number of publicly available research databases of EEG signals should justify the study of using very deep networks for ordinary EEG signals.
Objectives
Further performance improvement and more understanding of how the architectural aspects of the deep CNN affect its EEG classification performance are needed, in line with the increasing trend of EEG data availability.
Visual and Auditory Stimuli EEG Classification
The recurrent neural network in their study had achieved an average accuracy of 83.2% using sixty-four EEG electrodes and an accuracy of 81.7% using ten selected EEG electrodes. For a 24-class EEG classification task, an average classification accuracy of 24.4% is achieved, which is significantly better than the random accuracy level of 4.2%.
Emotion Classification
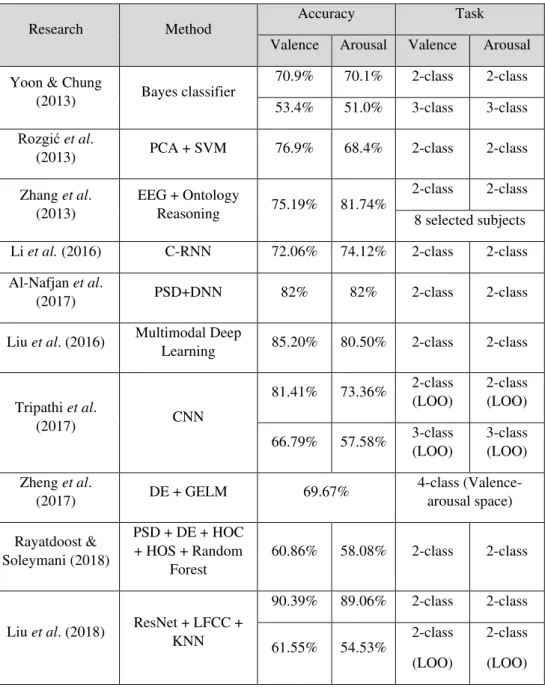
DEAP Dataset Literature Review
Linear frequency cepstral coefficients (LFCC) had also been proposed as a crucial set of features for EEG-based emotion recognition (Liu et al., 2018). Among the studies that had focused on manual computation of the EEG features for emotion classification, a recent study by Liu et al. 2018) had made use of the EEG features extracted automatically by pre-optimized residual network (ResNet).
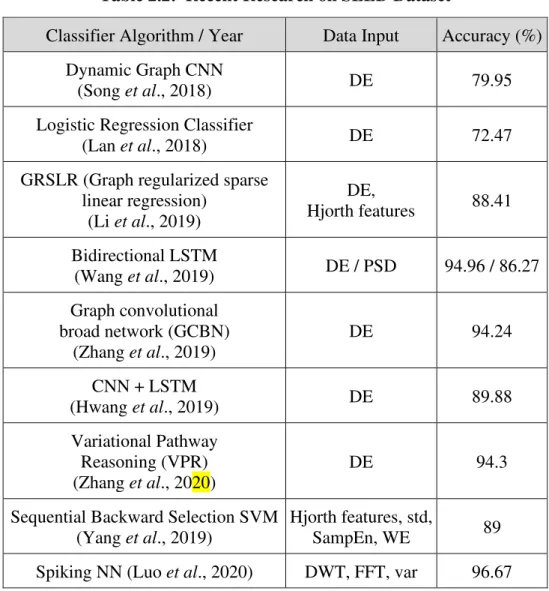
SEED Dataset Literature Review
Algorithms/Methods used in Emotion Classification
Although the amount of currently available public EEG research database may not yet be sufficiently representative of the general population, the trend of increasing number of publicly available EEG databases will justify more research works on the application of very deep neural networks to ordinary EEG signals. In addition to the above focus on ResNet and VGG architectural improvement and comparison, we also proposed the location of EEG channels most useful in emotion recognition.
Music-Listening EEG Classification (Study 1)
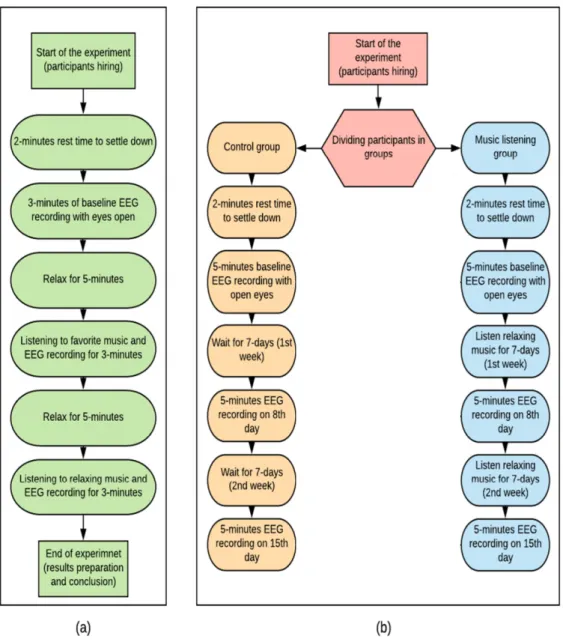
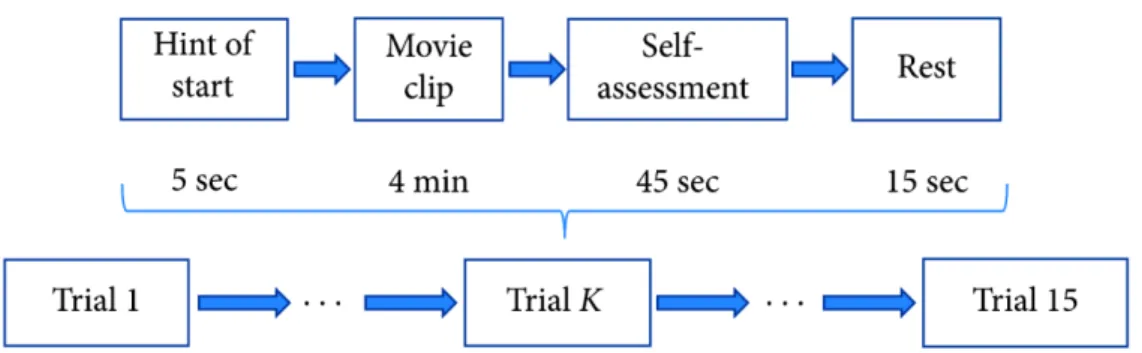
Experiment Description and EEG Signal Recording
Five of the ten subjects were assigned to the control group, while the other five were assigned to the alpha-binaural beat treatment group. Therefore, the EEG data of the short-term music experiment in Phneah and Nisar (2017) is set as the target data set for the classification task in this study.
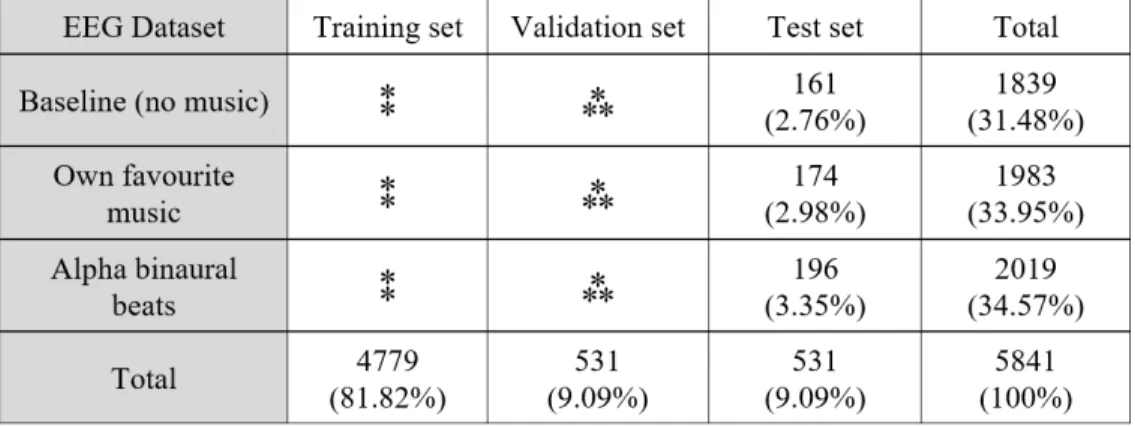
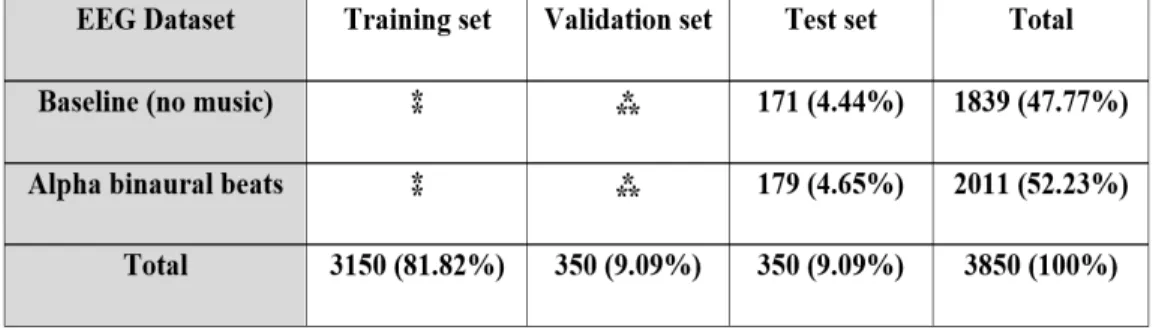
Allocation of EEG Segments into Training, Validation, and Test Datasets
- EEG Dataset for Short-term Music Experiment Binary Classification
- EEG Dataset for Short-term Music Experiment Three-class Classification
The double asterisks (⁑) in Table 3.1 should indicate the number of EEG segments that is approximately half of the total training set. Analogously, triple asterisks (⁂) should indicate the number of EEG segments that is approximately half of the total validation set.
Computing Environment Settings
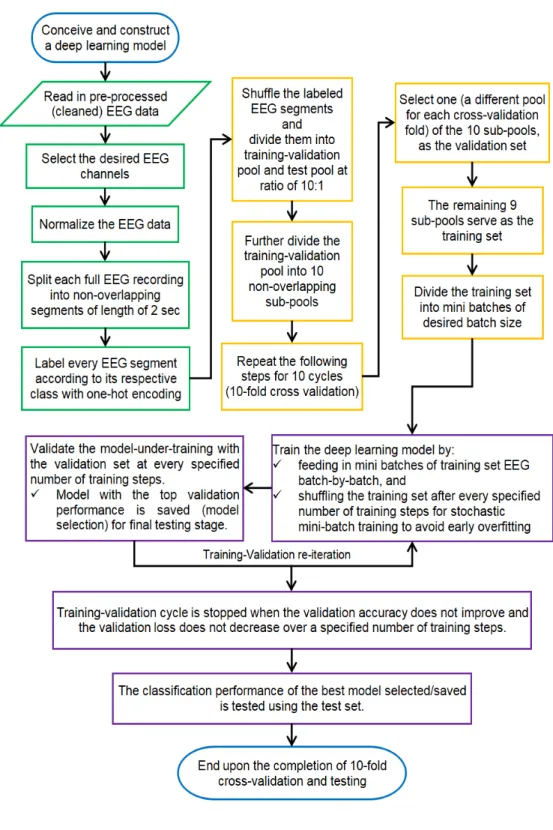
Other important auxiliary Python libraries used in this study include numpy for managing EEG in array data structure form, the os library and the re library for convenient navigation through the system library and for efficient access to the EEG target files. Methodological steps for model training, validation and testing Figure 3.2 illustrates the workflow of the training-validation cycle for.
Methodological Steps of Model Training, Validation, and Testing Figure 3.2 illustrates the work flow of training-validation cycle for the
Design of Classifiers
- CNN Models
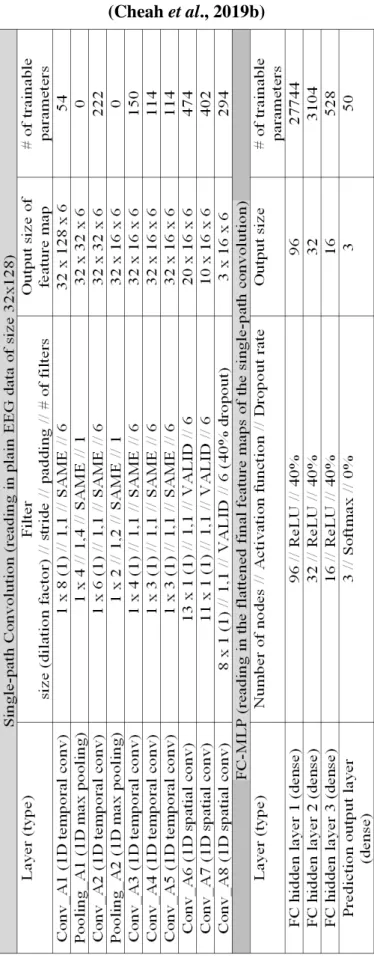
- SVM Classifier
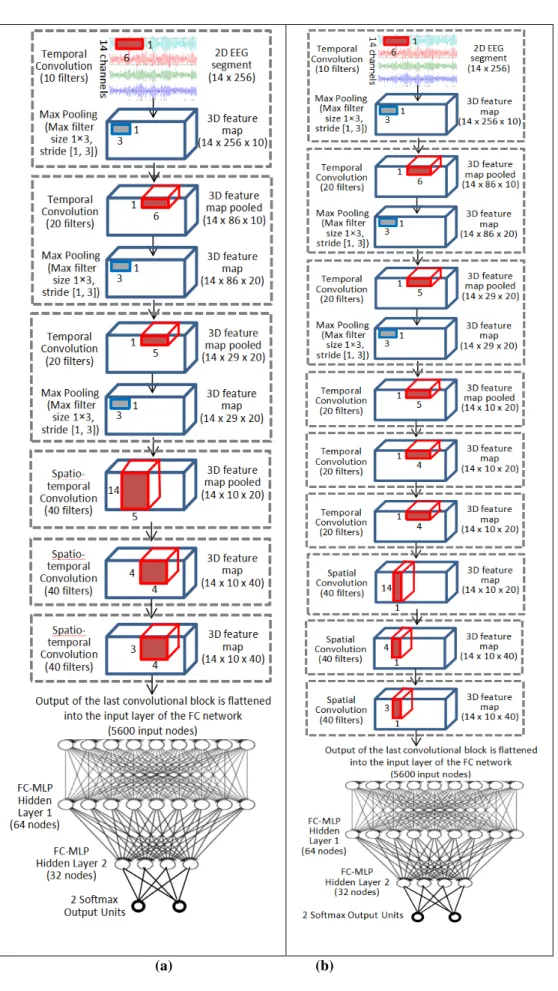
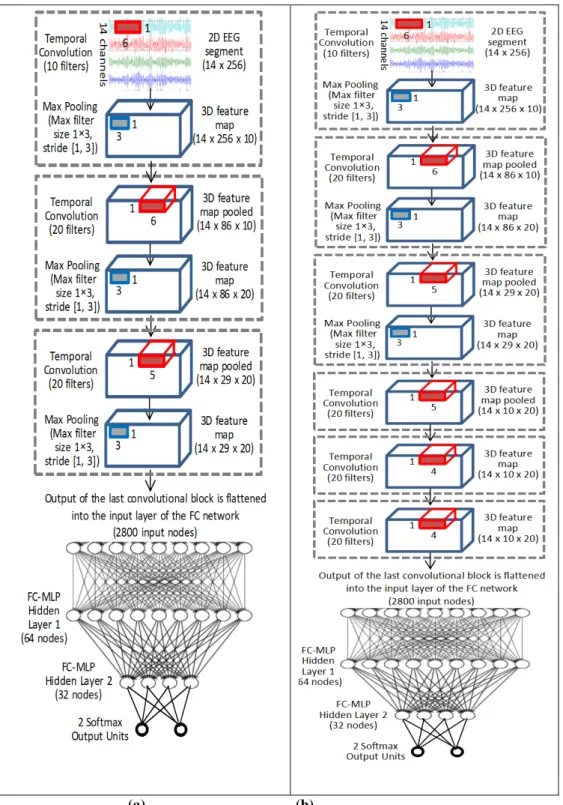
The initial three convolution blocks in Figure 3.4(a) are identical to those of the CNN models in Figure 3.3. Each of the subsequent convolution blocks of Figure 3.4(a) CNN classifier is composed of two-dimensional (spatial-temporal) convolution kernels. Similarly, 𝐴[𝑙−1](𝑥,𝑦) symbolizes the submatrix of 𝐴𝑙−1 of the size of the convolution kernel 𝑊𝑘𝑙 centered on position (x, y) of the matrix 𝐴𝑙−1.
CNN for Personalized Emotion Classification (Study 2)
- DEAP Dataset
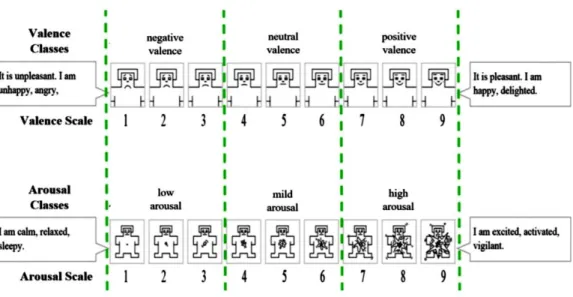
- Emotion-Class Relabeling
- EEG Allocation into Training, Validation, and Test Set
- Architectural Details of the CNN
- Dilated Convolution
- Training, Validation, and Testing of the CNN Models
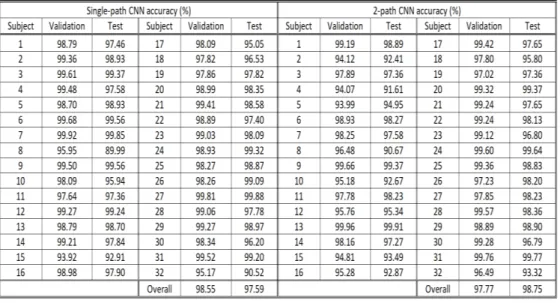
However, none of the one-second EEG segments in the test dataset or the validation dataset have any degree of overlap with the segments in the training dataset. The third fully connected layer is in turn connected to the final output layer of the FC-MLP network of the CNN classifier. In the two-path CNN classifier, one of the two convolution paths is fully implemented with dilated convolution with dilation factor 2.
Residual Network and VGG for Emotion EEG Classification (Study 3)
- SEED Dataset
- EEG Data Preprocessing
- Optimizing ResNet & VGG for EEG Signals
- ResNet Optimization
- VGG Optimization
- Model Training
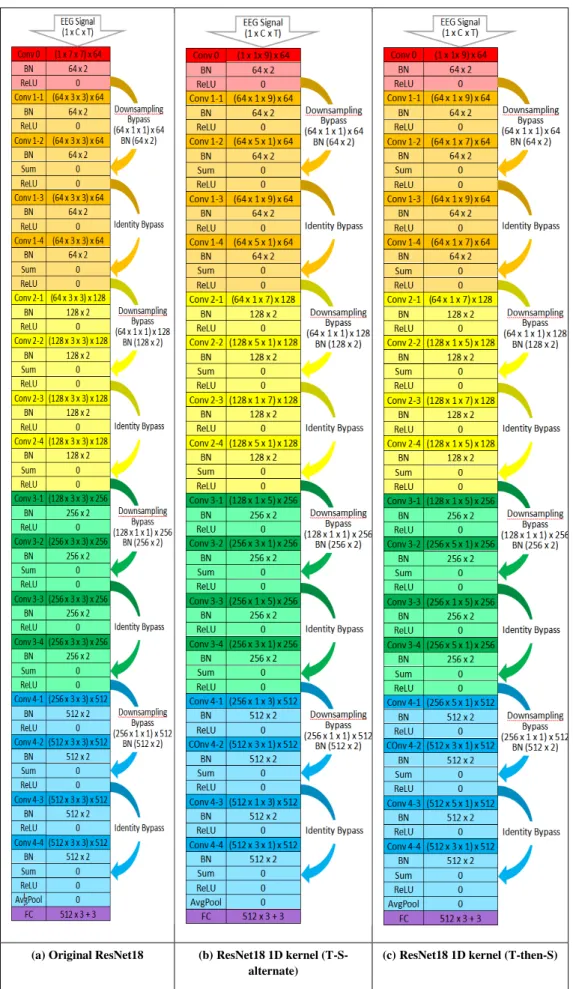
The 2D kernels in ResNet were all restructured into 1D kernels along either the temporal (time) dimension or the spatial (channel) dimension. The right columns of Figures 3.11(a), (b) and (c) indicate the number of parameters that can be trained in each architectural layer of the ResNet variants. We have also investigated the importance of batch normalization in CNN for EEG processing by removing the BN layers of VGG16 as in Figure 3.12(c).
Music-Listening EEG Classification (Study 1)
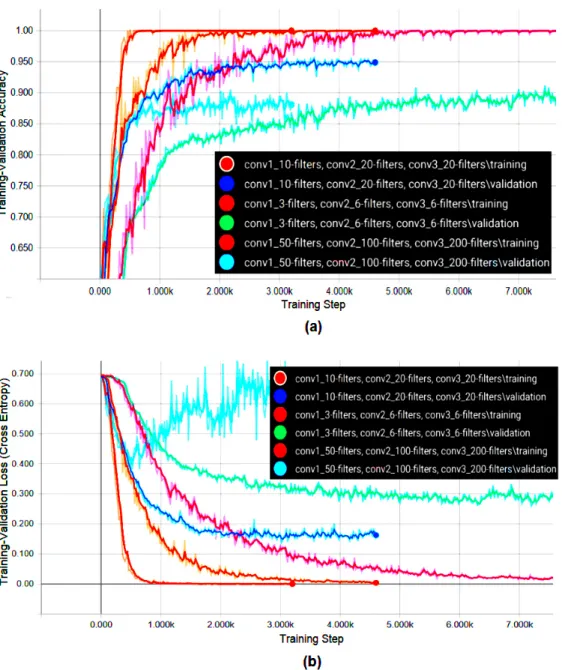
Adjusting for the Suitable Hyperparameters and Constituent Components in the CNN Architecture
A low number of convolution kernels has also resulted in ultimately lower validation accuracy and higher validation loss, possibly due to insufficient capacity of CNN to assume the sufficiently complex representation for the data domain. On the contrary, the CNN classifier with two hidden fully connected layers of 64 and 32 perceptrons has a slower learning progress than the model with a deeper and wider FC-MLP network. It has succeeded in achieving better validation accuracy and lower validation loss. . The performance of CNN without a pooling mechanism is very sensitive to the problem of overfitting, which can be easily seen from the pair of red and light blue curves in Figure 4.3(b).
The Importance of Convolution across the Spatial Dimension for EEG Signal Classification
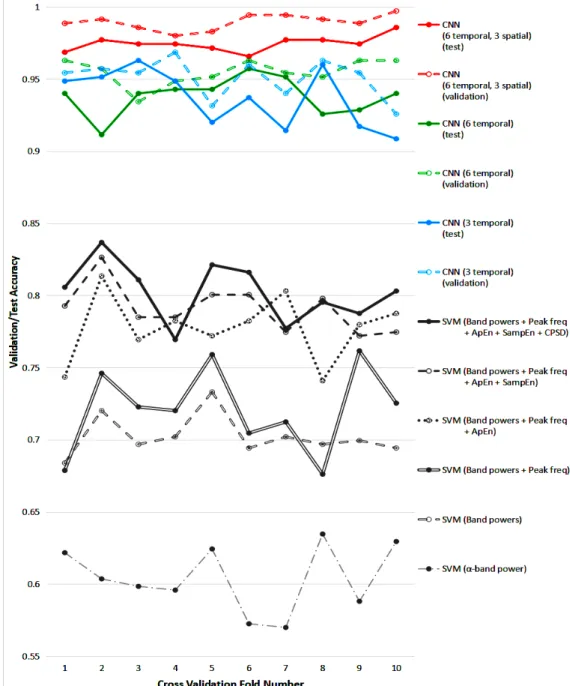
Ten-fold Cross-Validation Comparing the CNN with SVM
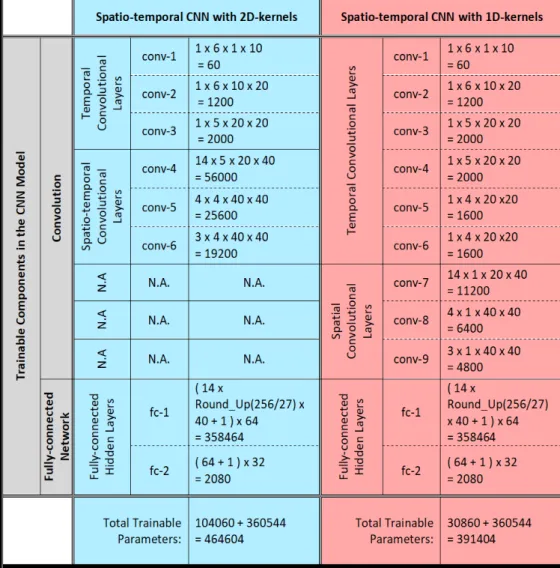
The two spatiotemporal CNN models shown in Figure 3.4(a) and Figure 3.4(b) are trained on the EEG three-class classification task using the short-term music experiment dataset as shown in Table 3.2. The validation and testing performance of both spatio-temporal CNN models are recorded in Table 4.2 and Figure 4.6. Temporal CNN via 10-fold cross-validation based on 3-class classification on a short-term music experiment dataset (Cheah et al.,
Comparing the Computational Efficiency of Different Classifiers in Terms of Size of Model & Computational Time
- Size of Model
- Computational Time
The computation times of the SVM classifier and the different CNN classifiers constructed in this study are compared in terms of both the training and prediction (test) time as presented in Table 4.5 and Figure 4.7. The recorded training time is the average time taken for one of the ten times cross-validation. Nevertheless, the prediction time rather than the training time is of greater importance for the implementation and applied performance of the model.
Brain State Classification based on EEG Signals from Different Brain Lobes
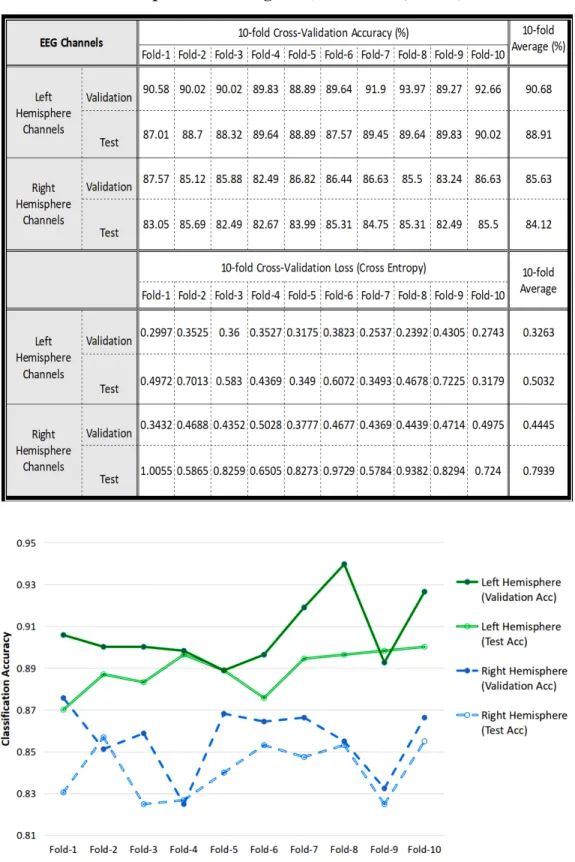
- Left Hemisphere vs. Right Hemisphere of the Cerebra
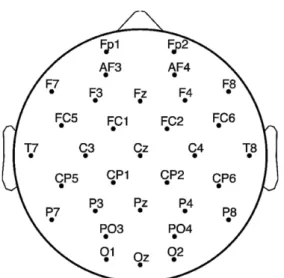
Lateralization of cerebral functions has been recognized as an indicator of successful and efficient neurological development (Liu et al., 2009). The discrepancy in classification performance between the use of six frontal lobe channels and the use of six EEG channels from the temporal, parietal, and occipital (TPO) lobes is even greater than the discrepancy caused between the left-right cerebral hemispheres. On average, the classification test accuracy achieved with six TPO channels is barely 74.69%, which is over 10% worse than the accuracy achieved with six frontal lobe channels of 84.93%.
CNN for Personalized Emotion Classification (Study 2)
The CNN models in this study are designed with a low number of convolutional kernels for the purpose of testing the performance of models with low convolutional capacity in emotion recognition. Also, with fewer kernels in the convolution layers, both the convolutional filters and the output feature maps are more interpretable for potentially identifying new useful EEG features. Meanwhile, with different dilation factors for the operation of convolution kernels, the CNN network is able to obtain the features of the signal at different frequencies.
Residual Network and VGG for Emotion EEG Classification (Study 3)
EEG Channel Significance for Emotion Recognition
- Electrode Distance from the Midline
- Significance Along the Nasion-Inion Axis
- Cerebral Lateralization of Emotion
- Comparing across all the EEG Channel Subsets
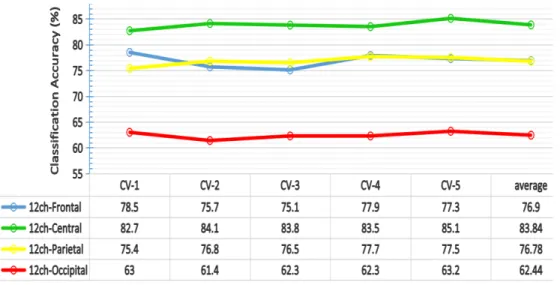
Referring to Figure 4.10(a) & 4.10(b), the importance of different subsets of EEG channels for emotion recognition is investigated, in relation to the distance of the EEG channels from the midline. The classification accuracy as reported in Figure 4.10 follows the trend that the more laterally located the EEG channels are, the higher the classification accuracy they provide. As shown by Figure 4.13 (b), these subsets of EEG channels cover the frontal region (blue), the central-temporal region (green), the central-parietal region (yellow) and the parieto-occipital region (red), respectively.
CNN for EEG Classification
Pooling mechanism has beneficial impact on both the computational efficiency and the classification performance of the CNN model. Replacing the 2D convolution kernels with separate 1D temporal and 1D spatial convolution kernels significantly reduces the trainable parameters in the CNN model and thus the disk memory requirement for the model storage (as presented in both Study 1 and Study 3), but preserves or even the improving the performance of the CNN classifier on EEG signal classification. It is also proven that the order of convolution dimension arrangement within the CNN is crucial for the performance of the classifier on EEG signal processing.
Non-uniform Influence of Music on Regional Brain Waves
Working on the public SEED dataset, the best-performing model (ResNet18-1D-(T-then-S)) among our emotion recognition CNNs achieved a three-class emotion classification accuracy of 93.42%.
Emotion-Relevance of Different EEG Channels
Recommendation for Future Work
Proceedings of the 6th International IEEE/EMBS Conference on Neural Engineering (NER), 6-8 November 2013, California, USA. NIPS'07: Proceedings of the 20th International Conference on Neural Information Processing Systems, December 3-5, 2007, Vancouver, Canada. NIPS'14: Proceedings of the 27th International Conference on Neural Information Processing Systems, 8-13 December 2014, Montréal, Canada.