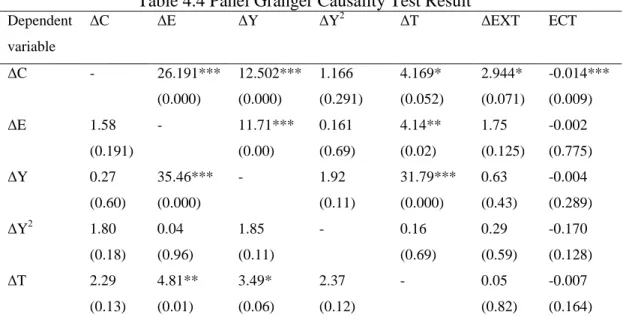
The finding indicates that there is a bidirectional Granger causality between economic growth and energy consumption, tourism and energy consumption, and economic growth and tourism. This thesis titled "THE ROLE OF TOURISM IN THE LINK BETWEEN CO2 EMISSIONS, ENERGY CONSUMPTION AND ECONOMIC GROWTH: EVIDENCE FROM THE G-20 COUNTRIES".
Research Background
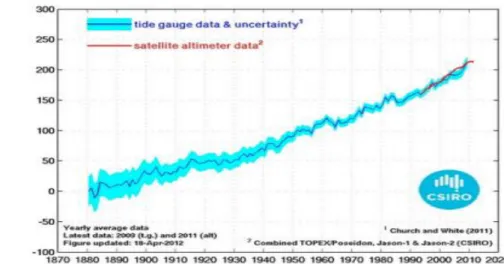
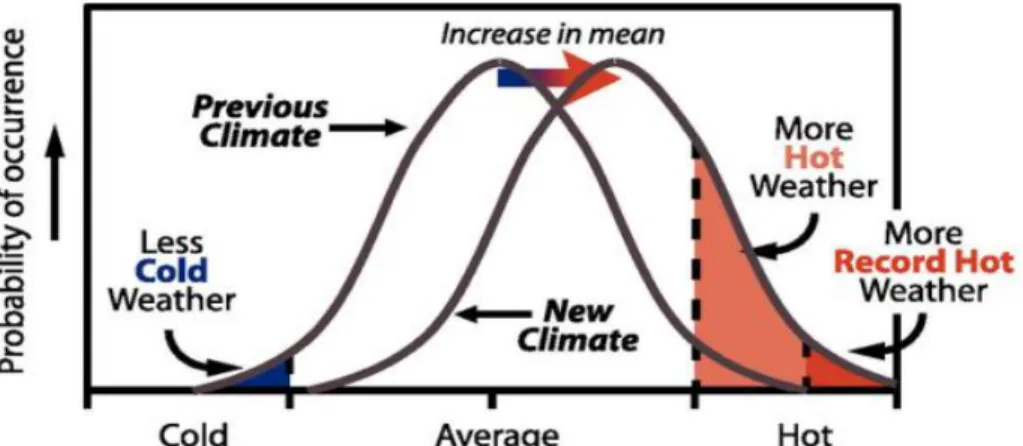
This implies a potential food crisis if no action is taken to counter this global warming and climate change. Greenhouse gases (hereinafter GHG) have been identified as the main cause of global warming and climate change.
The Linkage between Economic Growth, Energy Consumption, and Emissions
Economic Growth and Energy Consumption
The following subsection provides a brief introduction and links between CO2 emissions, economic growth and energy consumption.
Economic Growth and CO 2 Emission
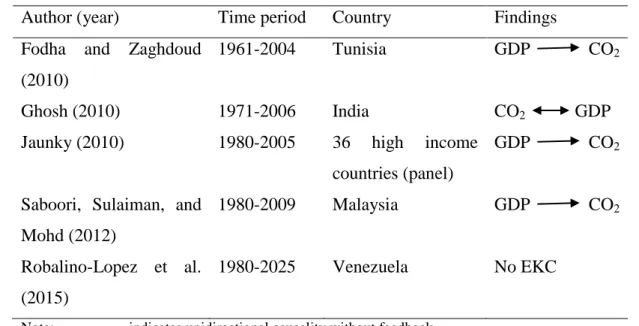
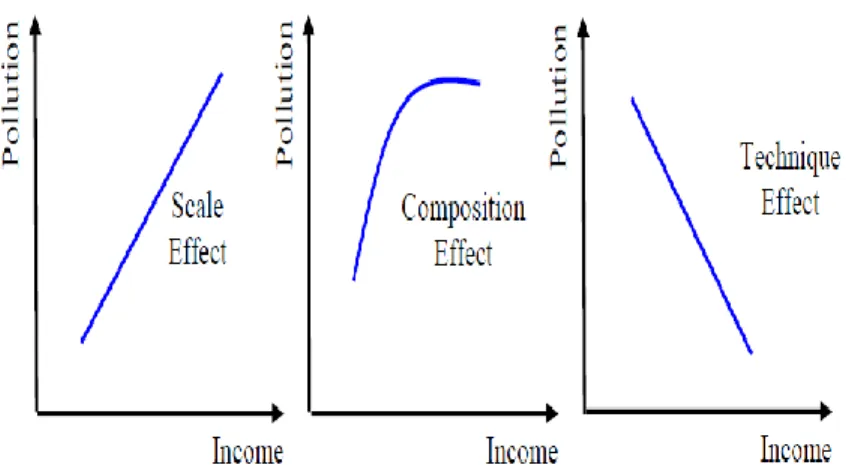
Stern (2004) and Dinda (2004) provided extensive overview of the early EKC works and pointed out potential problem in the analysis (refer to subsection 2.3.2). Details of the evolution of this line of research are left for discussion of literature review in Chapter 2.
Linking Energy Consumption, Economic Growth, and CO 2 Emissions Together
From the above, the energy required for development will ultimately contribute to overall economic growth. Because economic growth and energy consumption may not be enough to explain CO2 emissions, this study includes a new variable in this line of research, namely tourism.
The Role of Tourism
Impact of tourism on economic growth
After that, it is reported that many countries have started to focus on the development of the tourism industry for the growth of the economy (Sahli & Nowak, 2007). In short, the literature discussed above showed that tourism has a positive effect on increasing the output of an economy.
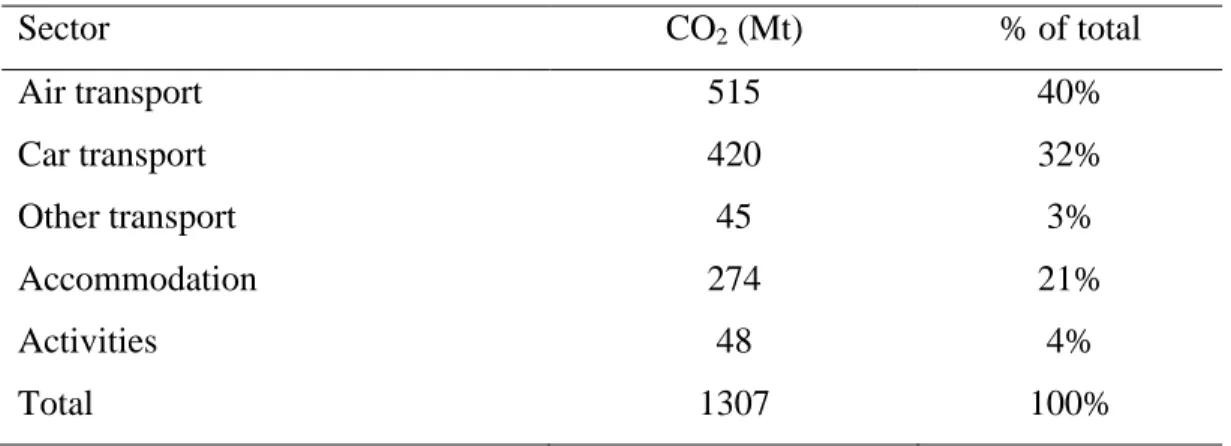
As the dominant contributor to tourism-related CO2 emissions is from air transport (UNWTO-UNEP-WMO, 2008) (see Table 1.1), the International Air Transport Association (IATA) presented a worldwide commitment in 2009 in three ways: fuel improvement. efficiency, stabilization of net emissions and a 50% reduction of emissions by 2050. To meet the commitment of AITA above, a sustainability report by Virgin Atlantic (2013) states that the airline is moving towards a low-carbon economy.
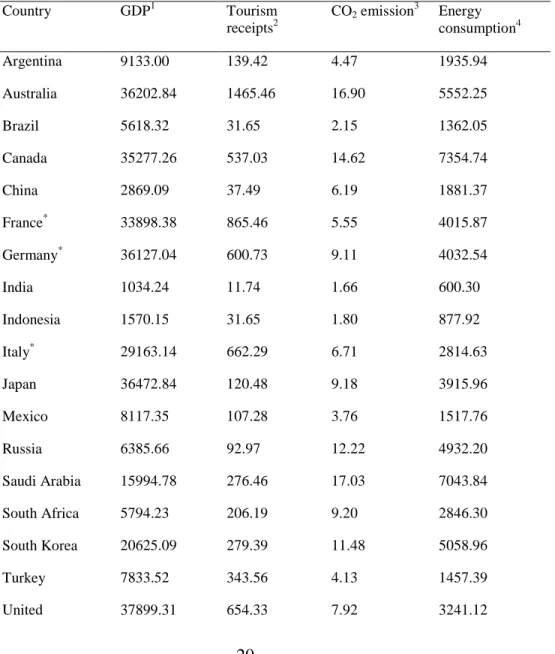
The G-20 Major Economies
Overall, the G-20 countries' CO2 emissions are almost twice the world average in 2010. In terms of economic growth, the G-20 countries' GDP per capita in 2010 is three times the world average.
Problem Statement
Recent work by Lee and Brahmasrena (2013) included tourism in determining the relationship between economic growth and CO2 emissions. To examine the relationship between economic growth and CO2 emissions underlying the EKC hypothesis with energy consumption as an additional variable.
Significance of the Study
Contribution to Existing EKC Framework
This suggests that economic growth and energy use may not be enough to explain the real world CO2 emission pattern. Including a tourism indicator in the framework can be useful to better understand the CO2 emission pattern in the G-20 countries.
Contribution of Public Policies
The discussion in the Problem Statement also revealed that even with energy consumption as an additional variable, these recent studies did not produce conclusive results. As the EU's performance is exceptional in terms of tourism revenue in the panel group (Table 1.2), other countries in the panel, especially the BRICs, can refer to EU tourism-related policies.
Conclusion
There has not been a time series analysis of the energy-pollution-growth relationship with tourism as an additional variable. The result from this study is able to show whether tourism is viable to reduce CO2 emission and promote economic growth at the same time.
Organization of Chapters
The aim of this study is to investigate the relationship between economic growth, energy consumption, CO2 emissions and tourism for a panel of G-20 countries. Furthermore, the investigation of the role of tourism in the energy-pollution-growth nexus using co-integration and Granger causality test is also a new attempt in this line of research.
Introduction
This may be due to spurious regression of a bivariate model due to omitted variables bias. Another reason could be the difference in terms of development, energy use and emission pattern possessed by different countries.
Energy-Growth Nexus
- Overview of Early Energy-Growth Nexus Empirical Work (1970s and 1980s)
- Development of the Energy-Growth Nexus in 1990s
- Literature of Energy-Growth Nexus in 21 st Century
- Summary on the Energy-Growth Nexus
Yu and Jin (1992) used the Engle-Granger (EG) approach and found that energy consumption and economic growth are unrelated in the long run. Third, unidirectional causality was found between energy consumption and GDP in Canada, Belgium, the Netherlands and Switzerland.
Pollution-Growth Nexus
- Environmental Kuznets Curve (EKC)
- Econometric critiques on the EKC
- Past Studies Modifications of EKC
- Summary on the pollution-growth nexus
They found that CO2 and SO2 (sulphur dioxide) emissions are related to economic growth in the long term. Based on the ARDL (Autoregressive Distributed Lag) model, they found that CO2 emissions and economic growth are related in the long run.
Pollution-Energy-Growth Nexus
- The Emergence of Pollution-Energy-Growth Nexus
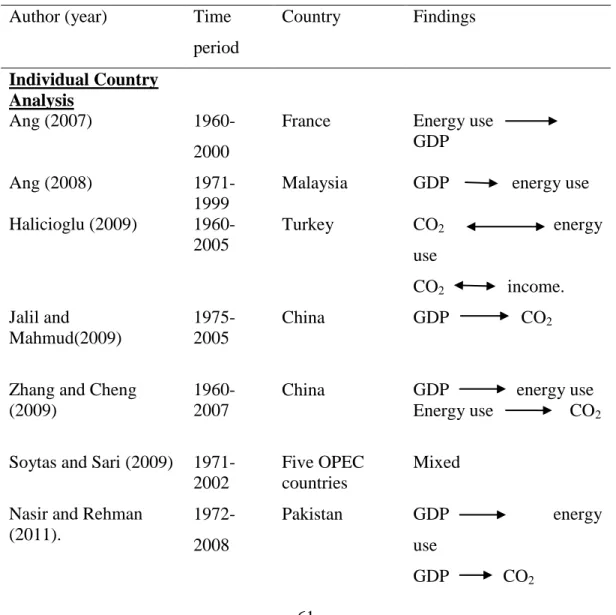
- Individual Country Analysis
- Panel Data Analysis
- Comparison of Panel Data Analysis and Individual Country Analysis
The finding from Johansen's cointegration confirmed the existence of EKC in the long run. From the short-term dynamics, they identified the two-way causal relationship between energy use and GDP.
Summary of Pollution-Energy-Growth Nexus
From another side, the panel analysis aimed to increase the number of observations in the data to produce convincing results. Even the methodologies used in most of the literature were similar (Pedroni or Johansen cointegration, VECM and Granger causality test), the results also varied due to different region and period included in the data.
The Role of Tourism
The Linkage between Tourism and Economic Growth
They proposed a tourism-led economic growth policy which accepts that tourism is a significant sector in the growth of the overall economy in the long term. On the other hand, Oh (2005) and Katircioglu (2009) found that economic growth Granger causes tourism which supported the growth led tourism hypothesis.
The Relationship between Tourism and CO 2 Emission
Their results indicated that the effect of CO2 emissions on international tourism is significantly negative. The study by Lee and Brahmasrene (2013) analyzed the relationship between economic growth, tourism, CO2 emission and FDI for EU countries.
Relating Tourism and CO 2 Emission to Energy Consumption
Therefore, the interaction between energy consumption and tourism may play an important role in the relationship between CO2. In other words, the multiplier effect between energy consumption and tourism can have a significant impact on CO2 emissions.
Conclusion
Again, the time period and country used in the analysis play an important role in the conflicting findings. Brahmasrene (2013), this study takes a step forward to include tourism as an additional variable in the energy-pollution-growth nexus to examine the cointegration relationship, the EKC hypothesis, as well as directional causality between the variables.
Theoretical Framework
A recent work by Lee and Brahmasrene (2013) included tourism in examining the relationship between economic growth and CO2 emissions. The variables CO2 emissions, tourism, energy consumption and GDP are based on the population (per capita).
Panel Unit Root Test
The average standard deviation ratio, SN is the average of the ratios of the long-term standard deviation to the innovation standard deviation for each individual. This non-parametric test has a chi-square distribution with 2N degrees of freedom, where N is the number of cross-sectional units.
Panel Cointegration
Both tests are based on the Engle-Granger (1987) cointegration test, which examines the residuals of a dummy regression conducted using I (1) variables. In total, the Pedroni test provides seven statistics to test the null hypothesis of no cointegration in the heterogeneous panel.
Panel Dynamic Ordinary Least Square (DOLS)
Therefore, they concluded that the DOLS estimator is more promising than OLS and FMOLS in estimating cointegrated panel regression. Let Zit be the regressors resulting from the interaction of ΔXit+j terms with cross-sectional dummy variables, and let Wit'= (Xit', Zit')', then the pooled DOLS estimator can be written as follows:
Generalized Method of Moments (GMM)
Blundell and Bond (1998) argued that the persistence in the explanatory variables may affect the asymptotic properties of the differentiated estimator. As a result, the perturbation term is not serially correlated and the levels of the explanatory variables are weakly exogenous.
Panel Granger Causality
If the variables are co-integrated, this indicates that the variables "move together" in the long run. However, the long-term cointegration and elasticity do not indicate the direction of causality between the variables.
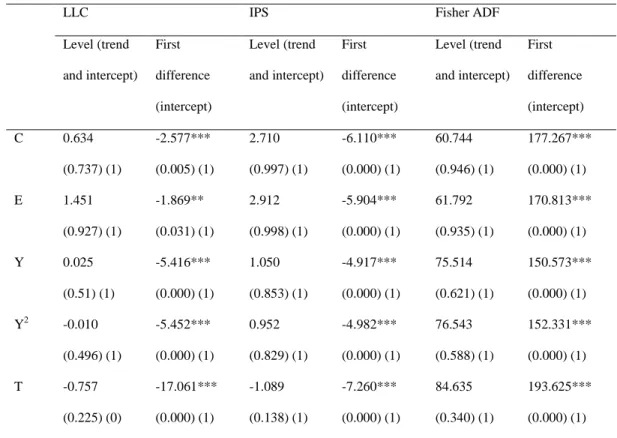
Panel Unit Root Test
However, when the variables are tested using their first difference, the results show the rejection of null hypothesis of non-stationarity. Finally, the three tests show that all the variables are stationary in their first differences.
Panel Cointegration
This result indicates that the variables do not move away from each other in the long-run steady-state relationship.
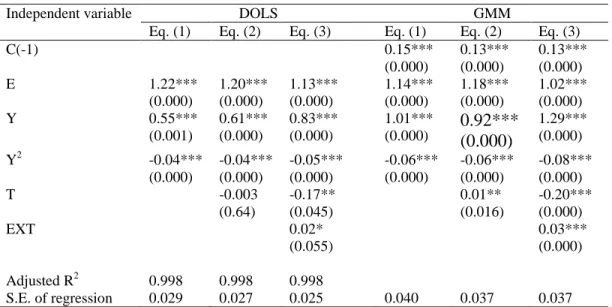
Panel Long Run Estimates
This indicates that the multiplicative effect between energy consumption and tourism can reduce CO2 emissions. Moreover, this finding also shows that the effect of tourism and energy consumption on CO2 emissions is not independent.
Panel Granger Causality Test
Furthermore, there is unidirectional Granger causality running from energy consumption to CO2 emissions, from economic growth to CO2. Finally, the causality between economic growth and CO2 emissions is consistent with the finding of Nasir and Rehman (2011).
Conclusion and Summary
Finally, in the long run, causality runs interactively through the ECT from economic growth, energy consumption and tourism to CO2 emissions. This indicates that economic growth, energy consumption and tourism are long-term determinants of CO2 emissions.
Policy Implication
As major economies in the world, the G-20 countries should lead the way in the implementation and integration of the above practice. As major economies in the world, the G-20 countries must take this responsibility to reduce CO2 emissions in order to reduce the rate of global warming as well as climate change.
Limitation of the Study
Since the inclusion of tourism in the EKC framework is considered a new area of research, future research may use different indicators of tourism to compare the outcome. Finally, the inclusion of the interaction concept between energy consumption and tourism in the model can be considered a new attempt in this line of research.
Recommendation for Future Study
This provides a basic theory and raises the issue of energy efficiency in the tourism sector. Regarding the issue of energy efficiency especially in the tourism sector, more research can be done in the future, i.e.
The relationship between energy consumption, energy price and economic growth: time series evidence from developing Asian countries. Economic Growth and Pollutant Emissions in Tunisia: An Empirical Analysis of the Environmental Kuznets Curve.