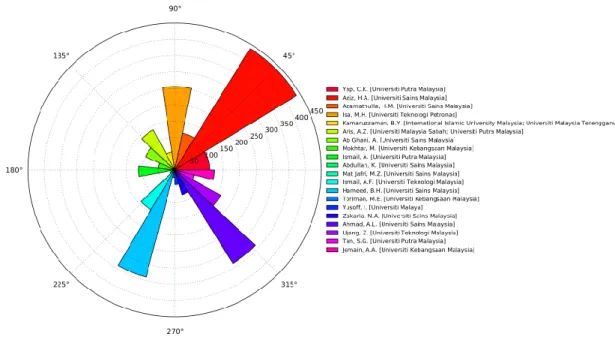
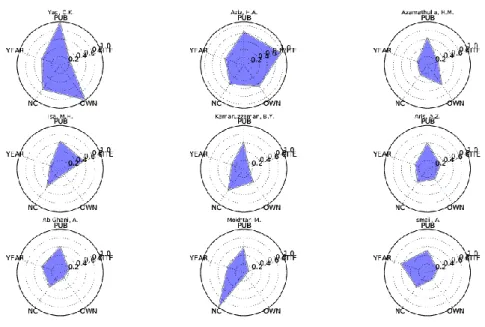
The fact is that we do not take any weight into account when assigning the number of publications to the authors or the institutions. The angle of each arc is proportional to the number of publications (by the authors), while the radius is proportional to citations (by the authors). However, authors with a large number of publications tend to be cited more often (12 out of 20 in Figure 3 have at least 100 citations).
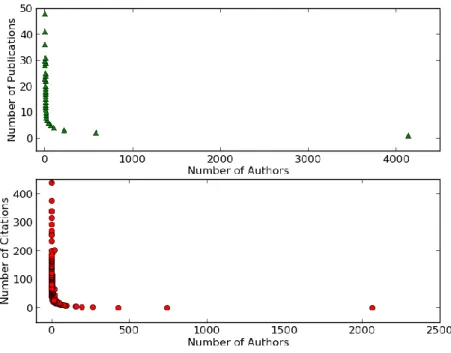
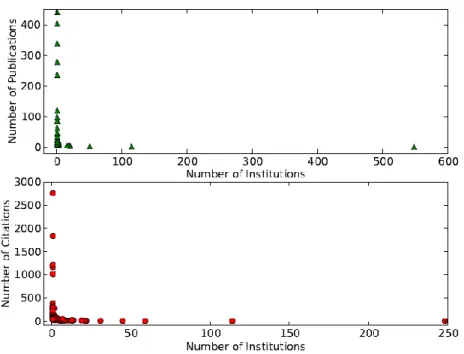
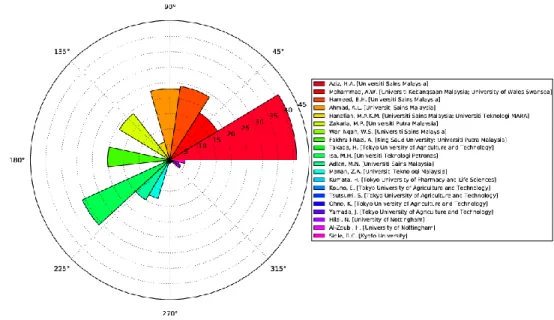
Some highly cited authors have a small number of publications (half of 20 in Figure 4 have less than five publications). Yap, C.K., on the other hand, has the highest number of publications and the highest number of "ownerships". A relatively small number of institutions occupy the bottom lower range in terms of number of publications (top) and citations (bottom).
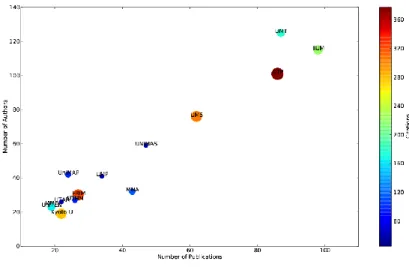
The performance of the main institutions, ranked by number of publications, is shown in Figure 7 (with Figure 8 as a close-up). In general, the number of authors is directly proportional to the number of publications (an almost linear graph in Figures 7 and 8), with some exceptions (clearly shown in Figure 8). USM, being the institution with the second highest number of publications, leads the citations (Figure 4 shows that six authors with the highest citations are actually from USM).
Bubble size is ∝ number of citations (also highlighted as cool-warm color scheme). While in general, the number of publications still correlates well with the number of authors, there are exceptions, such as UMT and UMP. In general, as the number of new authors increases, the number of publications increases, following an exponential trend (Figure 10).
Authors’ Collaboration Network Analysis
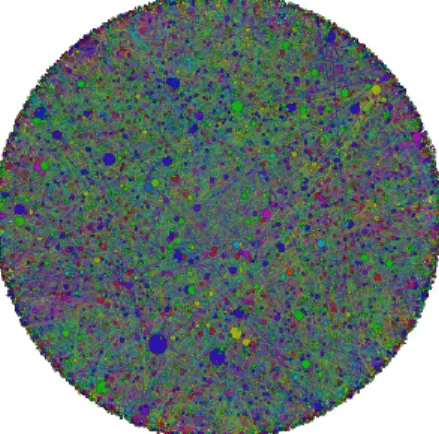
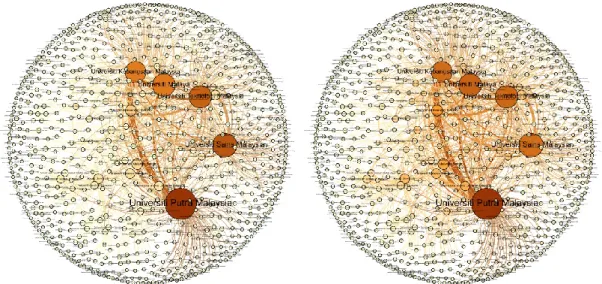
The color represents the groups/communities detected by Gephi and the size of the nodes is proportional to the size of the nodes. Looking at the network created by the top five authors ranked by the number of contributors, Mokhtar, M. In fact, Yusop has the highest betweenness centrality score in the network centrality analysis, making it a critical staff in collaboration between different communities.
Authors with high betweenness centrality normally have a high intra-institutional/inter-institution ratio (Table 8), but in the case of Mokhtar and Ujang they score relatively low, even though they have many intra-collaborators. Mokhtar and Toriman are connected to several other high-profile authors in the cluster and are therefore considered two of the most influential authors in their community. The color represents groups/communities detected by Gephi and the size of the nodes is proportional to that of the node.
Color represents groups/communities detected by Gephi and nodes' size is proportional to the node's number of publications. Since most of the members in the group are from UKM, we can conclude that both authors are the leaders among the UKM community. Surprisingly, Yap, who has the most publications and the most collaborators, does not appear in any top five centralities.
The interactions between communities decreased as we move from Figure 23a to 23f, although the number of communities is approximately the same. UPM, USM, UKM and UTM can be considered good intra-collaboration between their respective communities, with at least 10% of the communities interacting with each other. The interactions between communities are determined by the size of the community and the strength of the community (number of publications), with interactions dominating the right part of the graph.
In the case of UM, although it has 51 local communities, the size of each community is small compared to other ŽPs. A possible explanation for this could be the fact that researchers at UM are very competitive with each other and only work with members of the same community. The ranking is based on the eigenvector centrality score, Intra=number of collaborators within an institution, Inter=number of collaborators between institutions, and Inter Inst=number of unique inter.
The majority of the top 20 authors only collaborate with authors from the same institutions (true to the top 20 authors) and only four interact with authors from different institutions. The ring segments are sorted by the cumulative number of publications (starting from 12 hours) and the ring size is ∝ community size.
Institutions’ Collaboration Network Analysis
RUs generally have more foreign collaboration partners than local ones, although UKM's ratio of FOR/MAL is relatively lower. The lack of foreign collaboration partners may be due to the institutions' reputation (in our case, reputation within water research). FRIM has a higher number of foreign collaborators compared to local collaborators as it is the de-facto custodian of Malaysian forest (foreign institutions will certainly need a "local" contact, especially when the research is conducted in Malaysian forest).
It may also mean that the foreign researchers are more interested in water research in Malaysian forests compared to local researchers. Kyoto University surprisingly has more foreign collaborators than Malaysian collaborators, although the data set is on water research in Malaysia.
CONCLUSIONS
ACKNOWLEDGEMENTS
A historical review and bibliometric analysis of research on lead in drinking water from 1991 to 2007. Research and impact assessment: A bibliometric analysis of research from the nih/niaid hiv/aids clinical trials networks. Google Scholar as a resource for citation and impact analysis for a non-ISI indexed medical journal.