A special problem entitled “Biological Network Analysis and Sub-Network Extraction Tool (Biological Net Extranalysis)” prepared and submitted by Danielle M. Rodriguez in partial fulfillment of the requirements for the degree of Bachelor of Science in Computer Science was reviewed and recommended. for admission. Accepted and approved as partial fulfillment of the requirements for the Bachelor of Science in Computer Science degree.
Mathematical and Computer Science Unit Department of Physical Sciences Department of Physical Sciences and Mathematics. Research has shown that when dealing with complex protein chains from various diseases, there is a large amount of proteins that interact with each other in different ways. Due to the complexity of the control mechanisms involved and the large number of possible interactions, there is a great need for computer-aided tools.
Biological network extraanalysis is a tool that helps the user to visualize the graph, extract the sub-network that contains the relationships that are important in the network, and perform network analysis on the graph.
Background of the Study
The results of this work are part of the Mathematical Modeling of Biochemical Pathways project, an interdisciplinary effort being conducted in partnership with the Mathematical and Statistical Modeling Unit under De La's Center for Natural Sciences and Environmental Research (CENSER). Salle University. The mathematical models that will be established in this project will try to explain the effect of a natural product (as a drug target) in three different cancerous diseases, namely breast cancer, colon cancer and leukemia. The input to be used in this work will come from another process that will take a pathway from the Kyoto Encyclopedia of Genes and Genomes, look for relationships in this pathway that appear in the literature, and add weight to these relationships , according to the circumstances.
A higher weight for a relationship shows that the relationship is much more significant and highly associated with the disease, making it much more desirable to extract and research.
Statement of the Problem
Another important problem in network analysis is the extraction of a subnetwork that can suggest an interesting process consisting of connections of involved proteins [8]. This is useful to find any connections between the above-mentioned proteins and to draw further conclusions about their function in the network. There are several existing tools that have the ability to represent the different centralities of a network and connect these nodes and their interactions, but they do not take into account the number of nodes participating in the interaction between these two nodes of interest . [9].
Objectives of the Study
Save the generated subgraph to a .csv file. i) View the nodes of the loaded path colored according to different centralities including:.
Significance of the Project
Scope and Limitations
Assumptions
Review of Related Literature 6
One possible solution is to check the reachability of the graph to see if it is possible to get from one node to another in the graph. When searching for the reachability matrix of a graph, we also search for the transitive closure of the graph. The transitive closure property of graphs is a problem used in many fields. The authors used transitive graph relations to derive the truth value of the statement.
The upward propagation of annotations is referred to as computing the transitive closure of the annotation set over the graph of GO. The use of transitive closure to collect all annotations relevant to the protein of interest provides the full picture of knowledge about the protein and makes the best use of the ontological structure. The algorithm makes use of disk memory when the data does not fit in main memory.
20] developed two new algorithms (Basic TC and Gobal DFTC) that use depth-first search for graph traversal and a technique called labeling to avoid processing some arcs in the graph. The ability to analyze the topological features of the network would give researchers insight into the structure of the network they are studying.
Kyoto Encyclopedia of Genes and Genomes
Directed Graphs
Adjacency Matrix
JGraphT
JGraph
Matrix Toolkit Java
Network Centrality
Design and Implementation 14
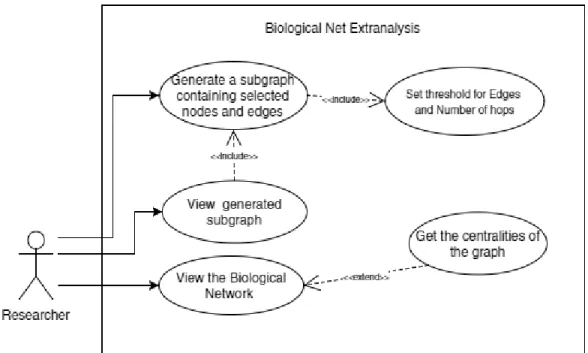
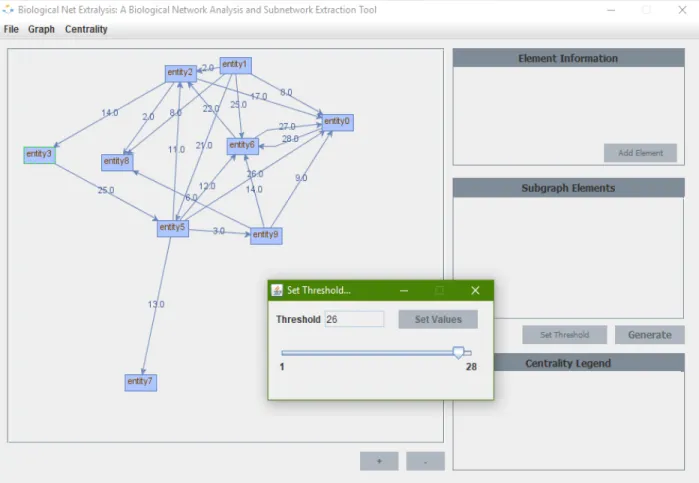
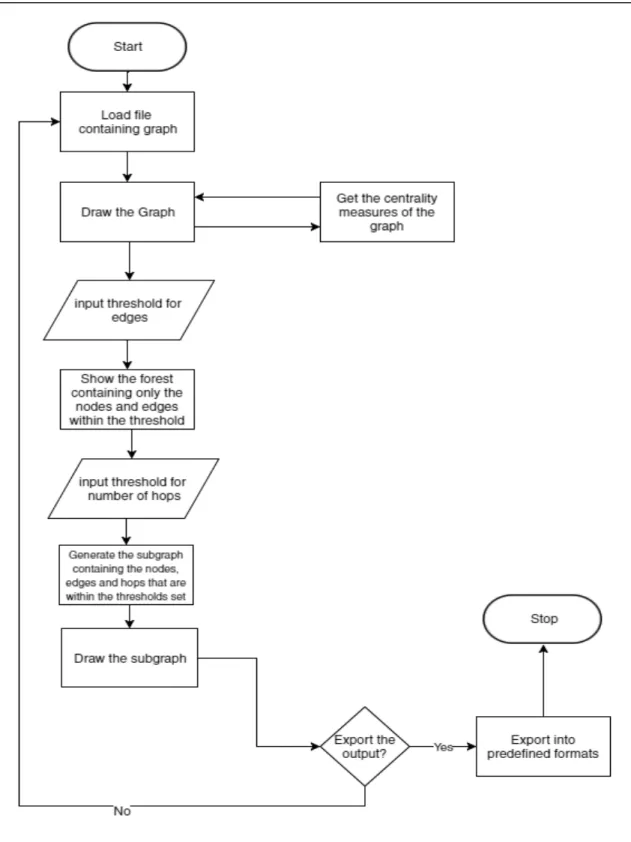
The user must be able to view the Path as a graph and generate a subgraph from it that connects nodes and edges that exceed a threshold. The subgraph also has a limited number of transitive nodes between the required nodes given by the user.
Flow Chart
A visual representation of the subgraph is displayed on the screen and the user is given the choice to export the subgraph. An additional function of the tool is to obtain graph centrality measures which will color the nodes in the graph based on the calculated centrality value. This free Java graphing library is mainly used to store the graph object and perform calculations on it.
Another free Java graph library with a focus on graph rendering for display. This is a library used to display a visual representation of a graph to the user. In this project, it is mainly used to calculate the centrality of the eigenvector of nodes in a graph.
Technical Architecture
Results 18
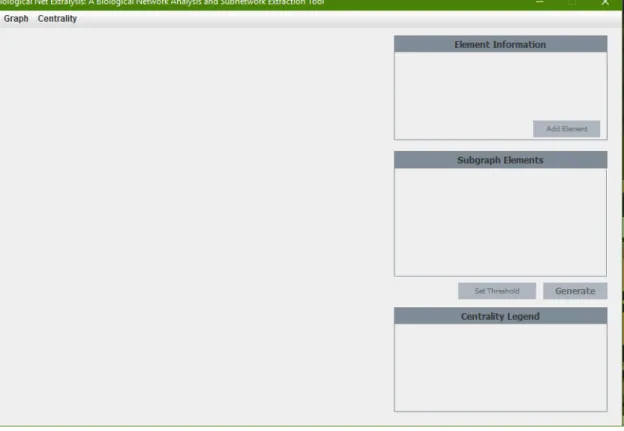
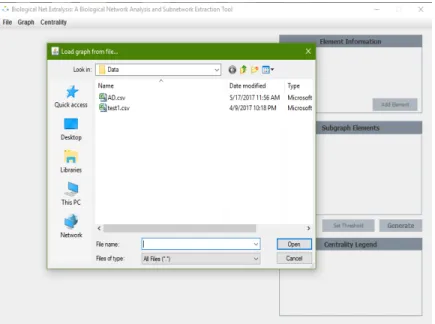
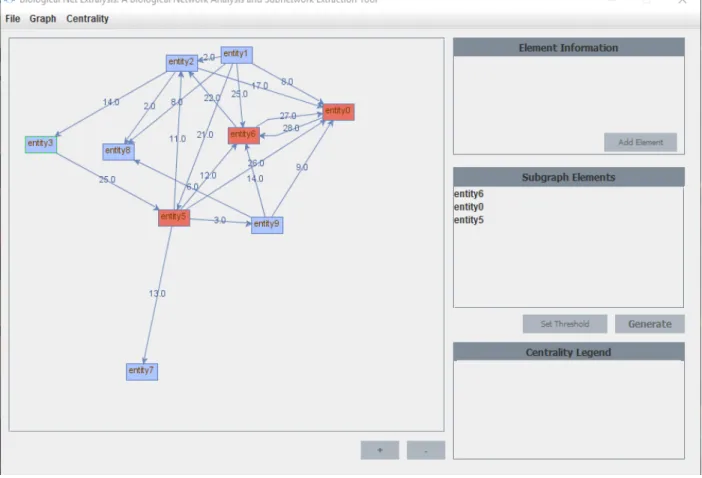
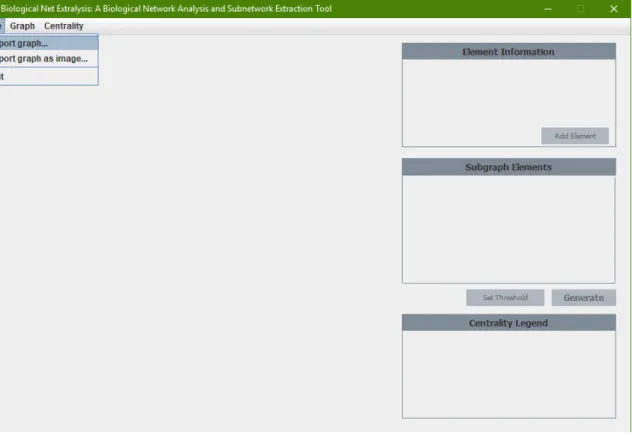
Biological Network Extraanalysis is a tool that visualizes Biological Networks, performs graph analysis, and allows the user to extract a subgraph containing essential nodes or relationships in the graph. When the tool is loaded, the splash screen first appears, then the user is presented with the main program window. The user selects the "Import Graph.." option in the "File" menu and a file selection window appears.
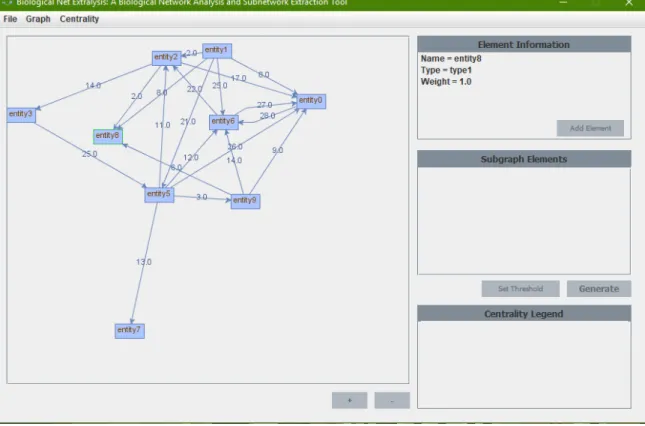
Once the file is selected, the graph is loaded into the program and the user is presented with a visual representation of the graph.
Setting the Threshold for the Edges
Setting the Limit for the Hops
Generating and Showing the Subgraph
Adding Specific Elements
Computing Centrality Measures
Exporting Graph as Image
Discussions 30
The user loads the chart into the program and is presented with a visual representation of the chart. A Java library, jGrapht, is used to contain the graph object in the program and provide different algorithms that will be used for various calculations. The library jGraph is used to create the visual representation presented to the user.
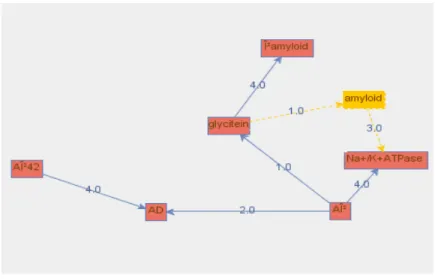
The loaded graph can have two things done to it: have a subgraph extracted from selected nodes or show the graph with its nodes colored based on the calculated centrality values. The tool was used to perform a test on the incomplete modified KEGG relationships of the Alzheimer's disease containing various weights. The weights in the graph represent the number of times a certain edge is cited in literature.
When the different centralities of the network are plotted on the graph, the central node, AD (Alzheimer's disease), is consistently shown to be colored with the highest values. The tool created, Biological Net Extranalysis, allows the user to load a graph from a file and a visual representation of the graph is shown to the user. The user can create a subnetwork of selected edges that exceed a certain threshold, and explore any indirect relationships between these nodes.
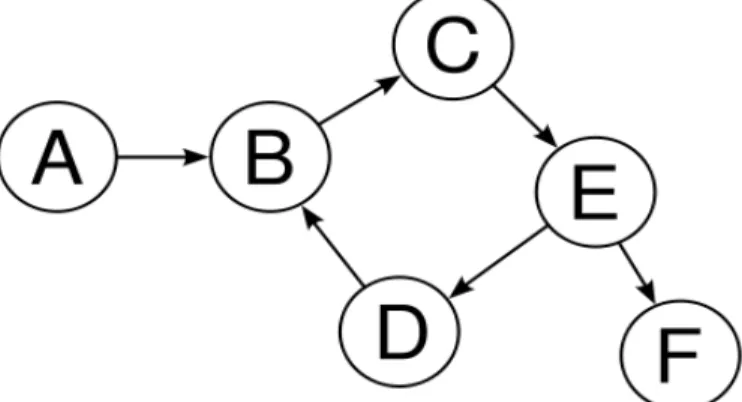
The program uses the concept of transitivity to find the various indirect relationships that nodes may have. The tool also calculates various measures of graph centrality, including (i) degree, (ii) degree-out, (iii) betweenness, (iv) closeness, and (v) eigenvector. The ability to find these centers can help the user to find the nodes that are important for a network depending on the mechanism present.
The tool can be improved by increasing the limit on the number of jumps the user can set. The tool can also benefit from generating a subgraph based on the centroid metrics that have been calculated. Extracting some nodes based on their central values can show interesting paths and relationships worth looking at.
Another thing that could be improved is finding a way to present the graph in a much more visually appealing way. As of the current version, the nodes and edges are placed randomly, making it look a bit messy. Nesvizhskii, “Examining the relationship between essential genes in the ppi network and hub proteins in the inverse nearest neighborhood topology,” BMC bioinformatics, vol.
You are still one of the teachers I look up to even though I was only in one of your classes, hehe.