and Its Implications for the Philippines
KELVIN S. RODDLF"D
Abstract
Peak Oil
refers to the time when half of all the petroleum stored in the Earth has been used up. That time is the present, when the world's rapidly shrinking petroleum reserves are causing rapidly rising fuel prices wars and diplomatic tension over oil. Such tensions have arisen over the Spratly Islands in the South China Sea because oil may be discovered there-a possibility, not a certainty. Among all nations, the Philippines is one of the most modest oil consumers, but it is already suffering from the global warming caused by humankind's excessive use of fossil fuel since the l9'h century. Sea-level rise threatens two thirds of the Philippine population living on coastal plains. The oceans are being acidified by increased solution of carbon dioxide, harming coral reefs. Shifting climatic prevalence from La Niiia to El Niiio may cause decreased rainfall, droughts, and fewer but more powerful typhoons crossing the Philippines. The average Filipino uses less than 1.5 barrels of oil annually, but that oil fuels virtually all transportation, 11 percent of electricity, a huge array of plastics and other petrochemical products, road asphalt, cement manufacture, and more than two million tons of chemical fertilizers used annually. In the long run, the Philippine economy, work force and populace will benefit greatly by weaning agriculture away from petroleum. The nation urgently needs to develop alternate sources of energy, not only to free itself fromsteeply rising oil prices, but also to decrease its own contribution to atmospheric carbon dioxide and global warming. It can learn from Cuba, which underwent Peak Oil in the 1990's when the Soviet Union, its only source of oil, collapsed, but has achieved a healthy, sustainable, organic agriculture without fossil fuels and inorganic fertilizers and pesticides. The Philippines is already initiating projects that reduce greenhouse gas emissions with financial and technologic help from developed countries, which in return would earn credits toward meeting its own emission reduction targets. Spain is helping to electrify remote Mindanao barangays with solar power, and Denmark is subsidizing the Bangui wind farm in Ilocos Norte. To generate electricity, petroleum is being substituted with natural gas and coal, but coal pollutes the air with toxic substances in addition to carbon dioxide. Nuclear power is another energy source that should be avoided, because it is particularly hazardous in a volcanic and earthquake-prone area. Some of the alternate energy sources already used in the Philippines can be relied on more strongly and efficiently.
These include geothermal power, draft animals, biofuels; mini-hydro, wind, and solar energy. Ocean waves are the one marine source of power that can be tapped by relatively inexpensive, small-scale projects.
Introduction
The world is beginning to awaken to the fundamental reason behind the inexorably increasing prices of oil-based fuels. As is often the case, the Philippines and its government are slow to join this realization. In November 2006, Prof Floro Quibuyen and I lectured on Peak Oil at the University of the Philippines- ..\1anila. An attending student reported that one of his professors says Peak Oil is a problem only in developed countries like the U.S. that depend much more heavily on fossil fuels.
The good professor must be in a very small minority. Perhaps he lives within walking distance of his work, shopping, and entertainment, and thus does not share the ever-increasing financial pinch experienced by anyone who drives, or rides ajeepney, bus or taxi. The average Filipino
ASIAN STUDIES
indeed uses far less oil than the average American does, but is also deeply dependent on oil in ways that we may not realize. All transport of people and goods, all petrochemical products, and virtually all agriculture rely heavily on petroleum. In this impoverished country, increasing petroleum prices will inevitably continue to worsen the economy, quality of life, and social unrest.
This article explores the meaning of Peak Oil for the Philippines. It cannot be properly grasped without a look at the geologic time involved in the forl):lation of petroleum. No discussion of Peak Oil is complete without a brief discussion of the convergent problems of human-induced global warming and its consequences. The petroleum crisis involves far more than fuel scarcity; petrochemicals are so pervasive in our daily lives, so taken for granted, that we virtually ignore them. We will examine agriculture, the most important use of petroleum aside from transportation.
Finally, we will examine present energy use in the Philippines and evaluate a large menu of proposed and potential alternative energy sources.
· What •peak Oil .. means
The modern oil age began in the later half of the 19th Century, accelerated through the 20'\ and has arrived at its climax early in the 21".
Usage of any finite resource like oil inevitably must reach a maximum, or peak, and then decline. Peak Oil refers to the time when that happens, which is now. Every oil well, oil field, oil-producing country-and the entire world itself-must experience such a peak. Petroleum geologist M.
King Hubbert initially applied the idea to the contiguous 48 United States.
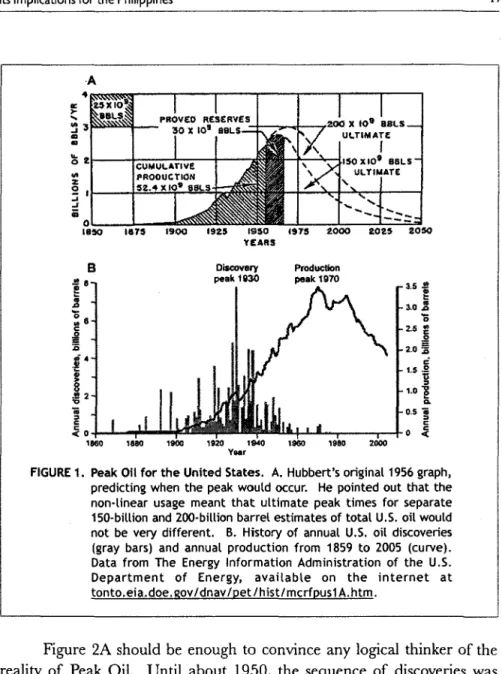
In 1956 he realized that oil discoveries there had climaxed in 1930, and predicted that U.S. peak oil production would occur in the early 1970s (Fig. I). He was derided by many until 1973, when industry statistics demonstrated that the peak had occurred three years before.
The reasoning behind Hubbert's successful prediction of peak oil for the United States, and for more recent estimates of the global peak, is simple. First, the supply of petroleum is finite. At first, there is so much
oil, and it is so easy to find and extract, that its use accelerates rapidly.
Naturally, the half of the oil that is most easily found and extracted is used first. Its use, however, unavoidably has to decrease the amount in the Earth's crust. When this half of all the oil is gone, accelerating use has reached its inevitable limit. After this time of Peak Oil, the remaining oil gets harder and harder to find and extract. Even if new fields are found, the time of global Peak Oil is not delayed very much. The oil that is hardest to extract cannot be used because to extract it would expend more energy than it can yield.
It is important to note that in the United States the peak time for discovery preceded the production peak by 40 years (Fig. l ). That much time after an oil field is discovered is required to develop it to its full capacity. If four decades is the typical lag period, the global discovery peak in 1965 should be followed by global peak production in 2005, give or take a few years.
C.J. Campbell and]. Laherrere (1998), among others, have refined Hubbert's approach and applied it to the entire globe. Laherrere (2000) has also written a thoughtful, but somewhat technical analysis of the concept.
By far the most lucid and authoritative introduction to the concept is Kenneth S. Deffeyes' 200 l book, Hubbert's Peak. Deffeyes also explored the ramifications of peak oil and the search for alternative energy sources in his 2005 book, Beyond Oil. Early in 2004, Deffeyes facetiously pronounced on his webpage that global Peak Oil would occur in 2005, on the American Thanksgiving holiday, November 24. Two years later, after the statistics for world oil production for 2005 had been released, he revised that date to December 16, 2005. Strong believers in Peak Oil include Matthew Simmons, the Houston banker who advises George W.
Bush. As one of the world's largest financiers of petroleum R&D, he is exceptionally self-taught in all aspects of oil, including its geology and extraction. His book Twilight in the Desert (2005) argues convincingly with a wealth of documentation that Peak Oil will arrive sooner rather than later, because the reserves in Saudi Arabia have been badly exploited and misrepresented.
ASIAN STUDIES
·A
...
0...
z2 I
... ...
iii
18!10
B Discovery Production
.!!a peak 1Q30 peak 1970
.! ~ '0
~ I!
1:>
·~ 4
!2
~ 'iii:>
~ c:
1860
Year
3.5
i
M.!
'0 2.5 ~ 2.0:;; ~
c
1.5 ~ :>
1.0
l
0.
0.5 1i
:>
c:
0 c:
<
FIGURE 1. Peak Oil for the United States. A. Hubbert's original 1956 graph, predicting when the peak would occur. He pointed out that the non·linear usage meant that ultimate peak times for separate 150-billion and 200-billion barrel estimates of total U.S. oil would not be very different. B. History of annual U.S. oil discoveries (gray bars) and annual production from 1859 to 2005 (curve).
Data from The Energy Information Administration of the U.S.
Department of Energy, available on the internet at tonto.eia.doe. gov I dnav /pet /histl mcrfpus1 A. htm.
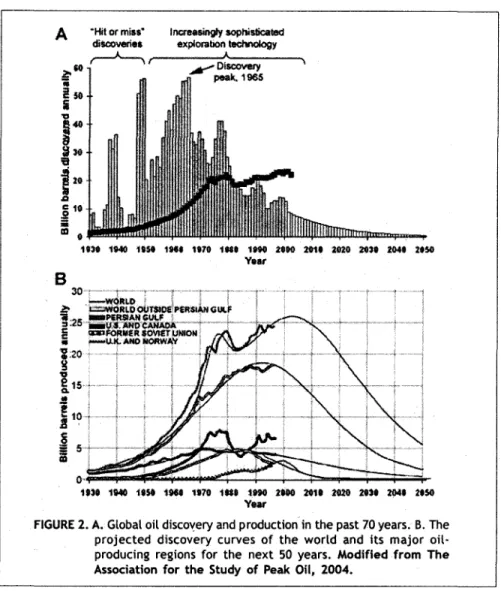
Figure 2A should be enough to convince any logical thinker of the reality of Peak Oil. Until about 1950, the sequence of discoveries was very sporadic, because the science of petroleum geology was still very crude. Large fields were still being discovered by chance and accident.
Notably, the largest oil field in the contiguous United States was discovered in 1930 when, purely on a whim, an oilman with no geologic training
drilled several wildcat holes in east Texas (Deffeyes, 200 I). After World War II, military technology adapted to exploration greatly improved its efficiency. Seismic reflection surveys penetrate kilometers into the crust beneath land and sea, providing detailed images of possible oil traps.
"Bright spots" in the seismic records may even indicate the presence of natural gas associated with oil. Satellites generate useful images and detailed maps and charts of gravity and magnetism. Given all this continually evolving high technology, why have discoveries fallen off?
The global discovery peak occurred in mid I963, over four decades ago.
It is important to realize that the modern exploration technology not only identifies areas with potential; it also eliminates vast areas without such potential. Clearly, the world has discovered most of the oil; certainly, all the largest oil-producing regions have been found.
Figure 2B shows that Peak Oil has already arrived in all oil-producing regions of the world with the possible exception of the Middle East. Even that assessment may be too optimistic, given that the oil reserves in Saudi Arabia, officially the world's biggest, may be much smaller than reported (Simmons, 2005).
Another important measure of the arrival or imminent arrival of peak oil is the behavior of the petroleum industry. Despite the escalating price of oi!, the largest ten companies spent only 14, 16 and II percent of their resources in 2000, 200 I and 2002 or exploration. They limited most of their expenditures to developing u1sting oil fields and acquiring properties from one another (Fig. 3A). No wonder; in 2003, oil companies spent $8 billion on exploration, but discovered only $4 billion of commercially useful oil (Homer-Dixon and Friedmann, 2005). Oil exploration is no longer a profitable enterprise.
Figure 3B illustrates the problem very well. After 1965, the surplus of oil discovered annually after subtracting what was consumed decreased steadily. In 1972, for the first time in the Age of Petroleum, the world discovered less oil than it used. In the following years, the global oil industry responded to this crisis by drilling more exploratory wells, but
ASIAN STUDIES
11140 1tst 1 * 1170 1t$0 ~otO totO 2018 2020 203t 2041 2tst Year
FIGURE 2. A. Global oil disco.,ery and production in the past 70 years. B. The projected discovery curves of the world and its major oil- producing regions for the next 50 years. Modified from The Association for the Study of Peak Oil, 2004.
the deficit continued to grow. After 1982, when more than 11,000 exploratory wells were drilled with disappointing discoveries, exploratory drilling dropped off precipitously. It was never again to approach the level of 1982. Only smaller fields in places difficult to access remain undiscovered
A
2000 2001 20028
Year
FIGURE 3. A. Expenditures of the top ten petroleum exploration and production companies from 2000 to 2002. From Simmons, 2003. B. History of the balance between worldwide annual discoveries and consumption of oil (bars), and of exploratory drilling (closed circles.) Through the early 1970's, more oil was discovered than was consumed. The first
"deficit" year was 1973. With the exception of a small surplus in 1984, more oil was consumed than was discovered since 1980. Initially responding to this situation, the global oil industry increased its drilling of exploratory wells from 1973 to 1982. The results were disappointing, and drilling activity has diminished ever since, despite the increasing prices of oil. Modified from Heinberg, 2004, 2005.
Contrary to common belief, global "peak oil" does not mean that the world is running out of oil. It means that fully half of the two trillion barrels of petroleum stored in the Earth's crust before humankind started using it has been consumed. Realizing this may tempt one to swing from alarm to undeserved complacency. True, a trillion barrels remain, but the
ASIAN STUDIES
half that is now gone was the easiest to find and the easiest to pull out of the ground. What is left is harder and more expensive to locate and to extract.
The problem is compounded by the accelerating global usage of oil. Not only does the United States, by far the biggest consumer, continue to use ever-larger quantities; the emerging economic powerhouses of China and India have only begun to indulge in their thirsts for oil. The increasingly fierce competition for oil is reflected not only in the increasing prices aL the wellhead and the gasoline pump, but in international po11t1cs and warfare as well.
The Spratly Islands
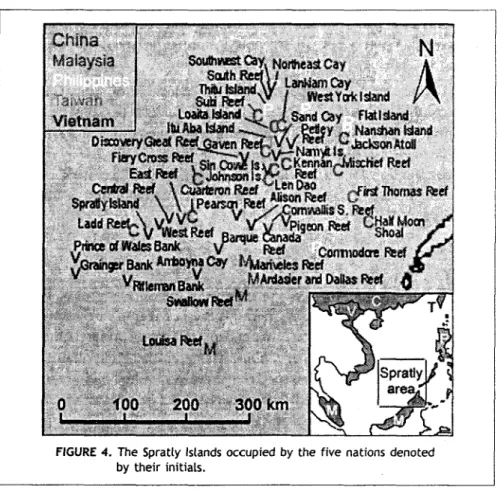
The Philippines has a major interest in the Spratly group of islands in the South China Sea (Fig. 4), perhaps the last region in the world that holds any possibility of large untapped petroleum deposits. Ownership of the Spratlys is contested by China, Malaysia, the Philippines, Taiwan and Vietnam, which by 1996 respectively have established military presence on ten, four, eight, one, and twenty-two of the islands. From 1974 to 1999, the contesting countries have been involved in 23 military incidents, most seriously between China and Vietnam at Johnson Island in March of 1988 (Energy Information Administration, 2003). The Vietnamese reported 74 sailors killed, the Chinese a large number wounded (Swanstrom, 1999). It is quite possible that those casualties were in vain, because the area may actually contain little or no oil. China is the most optimistic nation regarding the Spratly oil potential. Its most moderate estimate is that potential oil resources of the Spratly Islands and the Paracel Islands to th~ north could be as high as I 05 billion barrels of oil, implying that potential production levels for the Spratly Islands could be 1.4-1.9 million barrels per day. The U.S. Geological Survey, although often extremely optimistic (Deffeyes, 200 I), estimates only a tenth as much potential for the Spratlys, only 137,000-183,000 barrels per day (Energy Information Administration, 2006).
FIGURE 4. The Spratly Islands occupied by the five nations denoted by their initials.
Thus, all the nations concerned should evaluate the petroleum potential of the Spratlys collaboratively. A large step was taken in that direction in March, 2005, when China, the Philippines and Vietnam agreed to conduct a joint, three-year seismic exploration of the area (Central Intelligence Agency, 2006). If sizeable discoveries are made, all nations involved in extraction would have to be held collectively responsible for protecting the island environment and its plant and animal inhabitants from pollution associated with exploration, production and transport of oil. Entire flora and fauna of islets and reefs like the Spratlys could be wiped out by relatively small oil spills.
ASIAN STUDIES
Petroleum and Geologic Time
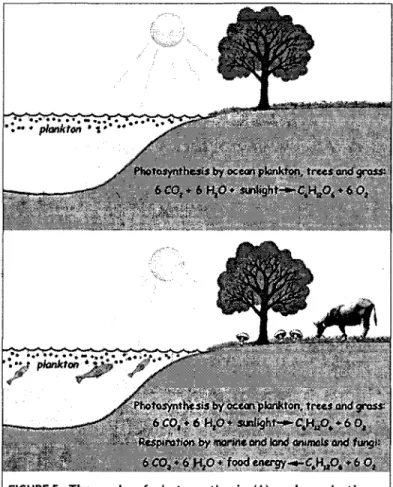
Peak oil cannot be properly understood without a grasp of the geologic time involved in petroleum generation - a grasp lacked by most people, including many economists who dismiss the concept. Petroleum has accumulated in the Earth's crust at exceedingly slow rates, by slowly escaping out of the biological cycle of photosynthesis and the opposite process called consumption or respiration (Fig. 5). We can summarize that cycle in an equation:
In non-chemists' language, plants and more primitive photosynthesizers such as oceanic algae use sunlight to combine 264 grams of carbon dioxide with 108 grams of water, producing 180 grams of carbohydrate, represented in the equation by the sugar glucose, containing stored chemical energy in the form of 670 kilocalories (equal to 683 nutritionist's calories), and release "waste" products of 192 grams of free oxygen (Fig. SA). Respiration, represented in the equation by the leftward arrow, is the exactly opposite process: Animals and fungi power their existence with the chemical energy stored in the sugar, releasing it by combusting it with 192 grams of oxygen (Fig. SB). Their "waste" product~
are 264 grams of carbon dioxide and 108 grams of water, so Nature's grand recycling scheme comes full circle.
The photosynthesis-respiration loop is almost, but not quite, perfect.
Small amounts of organic matter produced at the sunlit surface waters of the ocean rain down to the sea floor. There, most of this matter is consumed by bacteria, worms and other organisms, but minute quantities avoid this final consumption and are buried in the mud. As the sediment and its organic content accumulate, they are slowly buried ever more deeply. On average, temperatures within the Earth increase by 25 degrees Celsius with every kilometer of depth. From about 2.3 to 4.6 kilometers below the surface, the respective temperatures are 82 to 148°C, the range within which the buried organic matter can become liquid petroleum (Deffeyes,
FIGURE 5. The cycle of photosynthesis (A) and respiration (B) is an almost perfectly closed cycle, but small amounts of organic matter escape destruction by respiration, are buried in ocean sediment, and mature into oil.
2001). Above 2.3 kilometers the temperature is too low for this to happen.
Below 4.6 kilometers the temperatures are so high that petroleum molecules are torn apart, and only simple molecules of methane gas (CHJ can survive (Fig. 6A).
Geological processes operating over many millions of years can bury oil so deeply that it is entirely destroyed by heat. Alternatively, the petroleum-
ASIAN STUDIES
A B
Uphh (lll(j trOsiOne"f''" &
cutroy the Ctl
l.•Yif'l9 plonts
J
cndQI'limois
J
l>eod c:rgonJC rnctter buroed m
sed011e11tt
~
Deep~r bw-d/
"t:col<~·the 011. CO!IIpoeH the 7erlt$ mtorocl<.
Otl~too
dil:eply IS dem-oyed by
~
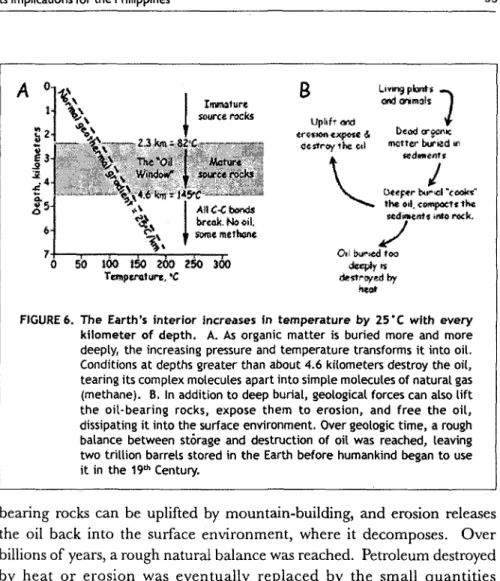
FIGURE 6. The Earth's interior increases in temperature by 25 • C with every kilometer of depth. A. As organic matter is buried more and more deeply, the increasing pressure and temperature transforms it into oil.
Conditions at depths greater than about 4.6 kilometers destroy the oil, tearing its complex molecules apart into simple molecules of natural gas (methane). B. In addition to deep burial, geological forces can also lift the oil-bearing rocks, expose them to erosion, and free the oil, dissipating it into the surface environment. Over geologic time, a rough balance between storage and destruction of oil was reached, leaving two trillion barrels stored in the Earth before humankind began to use it in the 19th Century.
bearing rocks can be uplifted by mountain-building, and erosion releases the oil back into the surface environment, where it decomposes. Over billions of years, a rough natural balance was reached. Petroleum destroyed by heat or erosion was eventually replaced by the small quantities continually stored in the crust (Fig. 6B). At any time during the eons before humanity began to use oil, about two trillion barrels were in storage.
We can estimate how fast the oil accumulated in several ways. Only about 0.2 percent was older than about 570 million years (Klemme and Ulmishek, 1991 ). The oldest petroleum of any real abundance, about 9 percent of the total, is of Silurian age, 408 to 438 million years old. If the two trillion barrels accumulated over the last 438 million years, the average yearly accumulation was 4,5 70 barrels. An alternative estimate:
about 72 percent of all the world's oil, including all in the Middle East, was deposited from late Jurassic time about 169 million years ago until 5.3 million years ago during the Cenozoic. This indicates an average accumulation rate of about 11 ,800 barrels per year. Even at this faster rate, oil accumulates so slowly that it must be regarded as a non-renewable resource.
Specifically, in 2003 the 84 million Filipinos consumed about 123 million barrels of oil (CIA, 2006). This equates to less than one and a half barrels per Filipino. Thus, even the faster rate of 11 ,800 barrels per year stores only enough oil for the needs of only about 8,000 Filipinos.
According to the CIA statistics, per capita annual use in America is much more: 27 barrels per year, so the yearly storage of 11,800 can serve the needs of only 43-7 Americans. Beyond demonstrating that oil is virtually non-renewable, these statistics indicate that the Philippines should be able to wean itself from petroleum much more easily than the United States can, given the foresight and political will.
Global Warming and Its Consequences
The use of fossil fuels since the Industrial Revolution of the 19'h Century is largely responsible for warming Earth's surface environments to levels and at rates unprecedented over the past two millennia. At present, all the people on Earth use 80 million barrels a day, or about 29 billion barrels annually. That means that humanity in one year consumes what earth stored in nine million years since the Silurian period. In one century-the blink of an eye in .geological terms-humanity has burned and returned to the atmosphere the carbon dioxide that Earth had buried in a trillion barrels of oil. The resulting greenhouse warming is one of the greatest traumas ever inflicted on the living environment of our planet.
Its accelerating consequences include rising sea level, acidification of the ocean and the destruction of corals, fewer but stronger typhoons, and redistribution of rainfall, all of which will be increasingly felt in the Philippines as well as the rest of the world.
ASL'\N STUDIES
During the 20'h century, sea level has been rising at rates estimated at 1-2 millimeters per year (Cazenave, 2004), partly from expansion of the warmed surface waters, partly from glacial meltwater returning to the sea. The rise is accelerating. From 1993 to 1998, it was 3.2
±
0.2 millimeters per year, measured precisely by the Topex/Poseidon satellite (Cabanes et al., 2001 ). Complete melting of the Greenland and Antarctic ice sheets could raise sea level as much as 70 meters (Alley et a!., 2005). Melting of the Greenland ice, measured by gravity-sensing satellites, was 2.5 times higher from 2004 to 2006 than in the previous two years (Murray, 2006).
Implications for the Philippines
Sea-level rise has serious consequences for any archipelagic nation such as the Philippines, where coastal plains are occupied by the fastest- growing 63 percent of the population. To make matters much worse, excessive use of well waters around Manila Bay is causing the plains to subside at rates ten or more times faster than the rise in sea level, greatly aggravating the flooding from storms and high tides (Rodolfo and Siringan, 2006).
One result of global warming appears to be a shift in Pacific Ocean climate from La Nina to El Nino prevalence (National Oceanic and Atmospheric Administration, 2006). During El Nino events, fewer typhoons form in the west Pacific, but these would tend to form closer to the Equator (Landsea et a!., 1993; Landsea, 2005) and thus may tend to follow paths leading across the Philippines. Furthermore, it is believed that global warning is resulting in fewer but stronger and more destructive storms (Emanuel, 2005; Webster et al., 2005). It is uncertain how annual rainfall will be affected, but in the Philippines from 1968 to 1992 the overall trend has been to decrease slightly Gose et al., 1996). Increasingly more carbon dioxide from the atmosphere is being absorbed by the surface waters of the ocean. The resulting acidity is posing a serious threat to · Philippine corals.
The Varied Uses of Petroleum
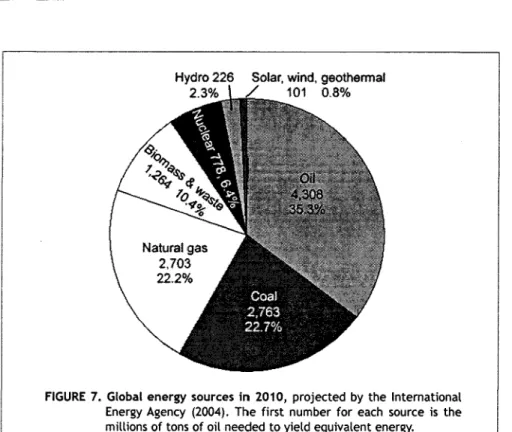
Petroleum is the world's most widely used energy source. The Organization for Economic Development (2004) estimated that 4.3 billion barrels of oil will provide about 35 percent of the world's energy by 20 10 (Fig. 7).
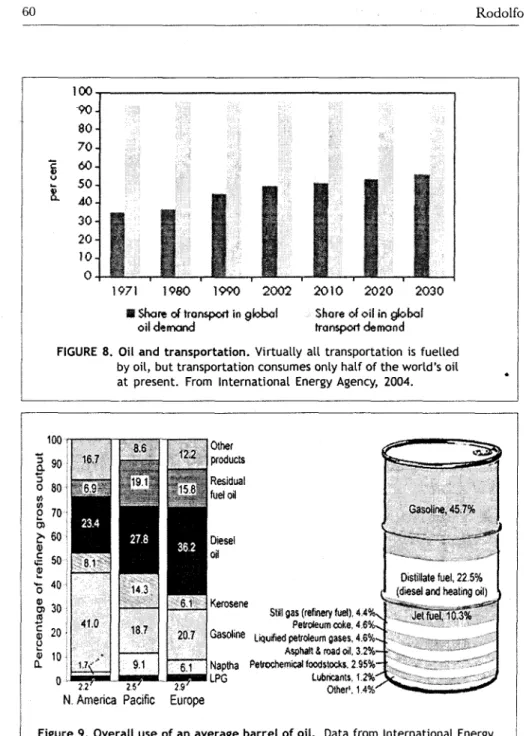
The prominent role of petroleum in transportation tends to mask its other critical roles in modern life. As Figure 8 shows, oil provides more than 95 percent of the energy for all transportation, but this accounts for only a little more than half of the petroleum used (International Energy Agency, 2004). Oil is also needed to generate electricity, empower industry and agriculture, and heat homes.
Figure 9 displays the considerable variation in products obtained from oil coming from different regions and processed to satisfy regional needs, and the yield from an average barrel. Almost half is gasoline, between a fourth and a fifth is diesel and heating oil, and 10 percent, jet fuel. Liquefied petroleum gas, so heavily used in Philippine kitchens, accounts for 4.6 percent.
Given that about 92 percent of the average barrel of oil is made into various products that are burned, it is easy to overlook the critical uses of the remaining 8 percent. The 3 percent consisting of asphalt is also critical for transportation. About 3 percent is feedstock for the chemical manufacture of plastics and other useful compounds.
This small percentage of oil-derived material is far outweighed by the crucial role it plays in modern life, as this bewildering array of products·
listed alphabetically shows: Ammonia; anesthetics; antihistamines; antiseptics;
awnings; balloons; ballpoint pens; bandages; boats; cameras; candles; candy wrappers; car battery cases; carpeting; car sound insulation; cassettes; caulking;
clotheslines; cold cream; combs; contact lenses; cortisone; crayons; credit cards; curtains; deodorant; detergents; dishwashing liquids; dice; disposable diapers; dresses ; drinking cups; dyes; electrician's tape; dolls; eyeglasses;
fan belts; false teeth; faucet washers; fertilizers; fishing boots; fishing lures;
fishing rods; floor wax; food preservatives; ink; garden hoses; glue; golf
ASIAN STUDIES
Solar, wind, geothermal 101 0.8%
FIGURE 7. Global energy sources in 2010, projected by the International Energy Agency (2004). The first number for each source is the millions of tons of oil needed to yield equivalent energy.
bags; golf balls; guitar strings; hair curlers; hair dyes; hand lotion; heart valves; house paint; ice buckets; ice chests; ice cube trays; identification cards;
insecticides; insect repellent; life jackets; linoleum; loudspeakers; luggage;
model cars; mops; motorcycle helmets; movie film; nail polish; nylon stockings; oil filters; paint brushes; paint rollers; pajamas; panty hose; perfume;
permanent press clothes; petroleum jelly; photograph film; pillows; plastic wood; plywood adhesive; purses; putty; refrigerator linings; roller-skate wheels; roofing; rubber cement; rubbing alcohol; safety glass; salad bowls;
shampoo; shoe polish; shoes; shopping bags; shower curtains; shower doors;
slacks; soap dishes; spandex tights; sports car bodies; sun glasses; sweaters;
synthetic rubber; telephones; tennis rackets; tents; tires; toilet seats; tool racks;
toothbrushes; toothpaste; toys; transparent tape; trash bags; TV cabinets;
umbrellas; unbreakable dishes; upholstery; VCR tapes; vitamin capsules;
water pipes; wire insulation; X-ray film; yam.
100 90
so
70
i
v 608..
50 4030 20 10 0
1971 1980 1990 2002 II Sho~ of transport in global
oildEtmond
2010 2020 2030 Shore of oil in global transport demood
FIGURE 8. Oil and transportation. Virtually all transportation is fuelled by oil, but transportation consumes only half of the world's oil at present. From International Energy Agency, 2004.
N. America Pacific Europe
Figure 9. Overall use of an average barrel of oil. Data from International Energy Agency, 2004 and Office of Energy Information Administration, 1997.
ASIAN STUDIES
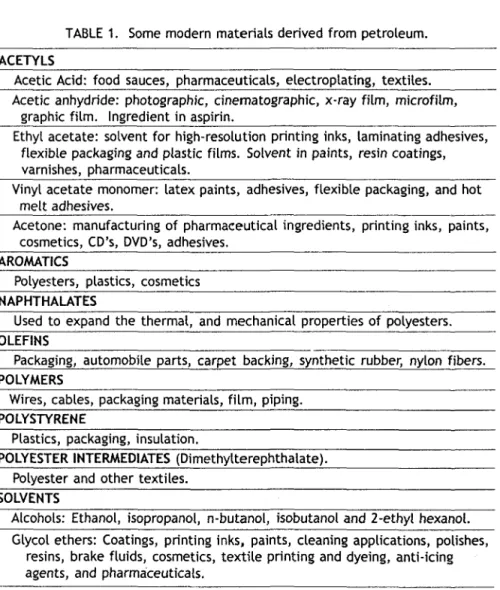
TABLE 1. Some modern materials derived from petroleum.
ACETYL$
Acetic Acid: food sauces, pharmaceuticals, electroplating, textiles.
Acetic anhydride: photographic, cinematographic, x-ray film, microfilm, graphic film. Ingredient in aspirin.
Ethyl acetate: solvent for high-resolution printing inks, laminating adhesives, flexible packaging and plastic films. Solvent in paints, resin coatings, varnishes, pharmaceuticals.
Vinyl acetate monomer: latex paints, adhesives, flexible packaging, and hot melt adhesives.
Acetone: manufacturing of pharmaceutical ingredients, printing inks, paints, cosmetics, CO's, DVD's, adhesives.
AROMATICS
Polye~ters, plastics, cosmetics NAPHTHALATES
Used to expand the thermal, and mechanical properties of polyesters.
OLEFINS
Packaging, automobile parts, carpet backing, synthetic rubber, nylon fibers.
POLYMERS
Wires, cables, packaging materials, film, piping.
POLYSTYRENE
Plastics, packaging, insulation.
POLYESTER INTERMEDIATES (Dimethylterephthalate).
Polyester and other textiles.
SOLVENTS
Alcohols: Ethanol, isopropanol, n-butanol, isobutanol and 2-ethyl hexanol.
Glycol ethers: Coatings, printing inks, paints, cleaning applications, polishes, resins, brake fluids, cosmetics, textile printing and dyeing, anti-icing agents, and pharmaceuticals.
Table 1 segregates many of these items according to their petrochemistry. Sadly, the most visible products of petroleum in the Philippines are the throwaway plastic bags and containers that litter the landscape.
Oil and Agriculture
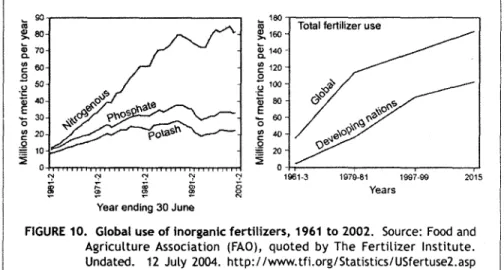
One of the most critical, but hardly acknowledged roles of petroleum in modern life is its use in agriculture, especially in agrarian nations like the Philippines. From 1950 to 1984, the "Green Revolution", best known for hybrid crops such as the rice developed by the International Rice Research Institute at Los Bafios, increased world grain production by 250 percent (Kindell and Pimentel, 1994). To a great extent, this increase was accomplished with fossil fuels to manufacture pesticides and fertilizers (Fig.
I 0), and to power irrigation. Oil-based agriculture typically uses about 50 times more energy than traditional farming, and in extreme cases 1 00 times or more (Pimentel and Pimentel, 1979; Giampetro and Pimentel, 1993).
The arable surface of the Philippines, like all of Earth's (Buringh, 1989), is now fully utilized by agriculture and aquaculture, leavi::1g only areas that are too steep, too dry, or with barren soils. As the population and its need for food inexorably grow, the only response can be to increase the productivity of the land, using oil-derived fertilizers and pesticides.
Since the early 1980's, the global increase in fertilizer use was largely in
- OOy---,
<II
~80
8..
70~80
:g
0 50·"0;40 ... 30 E
0
~ 20
~ 10
:iE o~~~~~~~~~~~~
Year ending 30 June
. 1 0 0 . - - - ,
!
100 Total fertilizer use8.140-
~ 120
.g
0 100a; 00
~
00"' 40
~
20:iE 0 ··1-i----,..---.---..,-1
1961-3 1979-81 1997-99 2015
Years
FIGURE 10. Global use of inorganic fertilizers, 1961 to 2002. Source: Food and Agriculture Association (FAO), quoted by The Fertilizer Institute.
Undated. 12 July 2004. http://www.tfi.org/Statistics/USfertuse2.asp
ASLI\N STUDIES
developing nations (Fig. 9). This does not improve the well-being of their farmers; it can only partially prevent starvation (Giampetro and Pimentel, 1993). The following quote from Smil ( 1991, p. 593) also applies to the Philippines:
The image is counterintuitive but true: survival of the peasants in the ricefields of Hunan or Guangdong- with their timeless clod-breaking hoes, docile buffaloes, and rice-cutting sickles - is now much more dependent on fossil fuels and modern chemical synthesis than the physical well-being of the American city dwellers sustained by Iowa and Nebraska farmers cultivating sprawling grainfields with giant tractors. These farmers inject ammonia into soil to maximize operating profits and to grow enough feed for extraordinarily meaty diets; but half of all peasants in Southern China are alive because of the urea cast or ladled onto tiny fields- and very few of their children could be born and survive without spreading more of it in the years and decades ahead.
In 1991, the Philippines used l ,944,892 tons of inorganic fertilizer, primarily nitrogenous (Philippine Fertilizer and Pesticide authority, 2002). Few people realize that the production of each kilo of nitrogen fertilizer uses as much energy from fossil fuels as that in 1.4 to
1.8 liters of diesel (McLaughlin et al., 2000; Pfeiffer, 2003). Thus, to manufacture the Philippine fertilizer used in 1991 expended the energy equivalent of more than 2. 7 billion liters of diesel. Furthermore, to provide the necessary hydrogen for the ammonia needed, substantial amounts of natural gas are also used, at times exceeding 90 percent of manufacturing costs.
Oil-based agriculture has resulted in enhanced soil erosion, and polluted .and overused ground- and surface water. These effects diminish crop yields, and the response of global agriculture has been to increase the use of fertilizers and pesticides derived from petroleum. Increasingly, more oil is also used to pump irrigation water and to process polluted water (Pfeiffer, 2003). These measures are doomed to failure, if the
experience in the US is a guide. There, from 1945 to 1994, agriculture energy use quadrupled, but crop yields only tripled. Since then, energy input has continued to increase without a corresponding increase in crop yield (Pimentel and Giampietro, 1994; Pfeiffer, 2003). This trend of diminishing returns can only spell trouble.
Enhancing and Augmenting Philippine Energy Sources Figure 11A shows that Philippine dependence on oil for generating electricity has decreased significantly since 1995 due to increasing dependence on coal and increasing use of domestic natural gas. By 2005, usage of oil for electricity has declined to only about ll percent (Fig. 11 B). Imported oil, however, still fuels virtually all Philippine transportation. As crude oil prices inexorably rise, the nation urgently needs to develop alternative sources of energy. To evaluate how this might be done, this report will first evaluate the main energy sources at present. The fossil fuels will find little favor in this analysis because of their role in adding carbon dioxide to the atmosphere, and thus in global warming. Following this, alternate sources of energy will be examined.
A
60000
!Qsoooo
:J ~40000
~30000
~20000
"
i3 10000 0
1986
8
YEAR
r
Non-conventional 19,0.03%FIGURE 11. The changing sources of Philippine electricity from 1986 to 2005.
Data from Department of Energy, 2006.
ASMN STUDIES
Animal Power
Few people think first of animals when enumerating sources of energy, but the Philippines has a long tradition of horse-drawn, two-wheeled calesas and caretelas, and of using carabaos and oxen for plowing, harrowing, and pulling carts. Animals, besides not requiring external sources of fuel, offer many advantages for use in transportation and farm work (Makhijani, 1990;
Damerow and Bradley, 1995; Damerow 2006). They are cheaper to buy and maintain, and do not malfunction as frequently as machinery. Over time, machines deteriorate and wear out, whereas young draft animals become more skillful. An appropriate number of animals reproduce themselves without requiring major capital outlays. They provide milk, manure to use as fertilizer, and, when too old or feeble to work, they also provide meat and leather. A single animal represents a versatile source of power for plowing, harrowing, threshing, irrigation and transport. Each draft animal is a small power unit, suitable for farming a small tract of land such as many Filipino farmers cultivate. Animals are less noisy and powerful and work more slowly than mechanical equipment, thus are less likely to involve their users in accidents. An animal may not be as powerful as a machine, but it can provide power for short periods at several times its average rate. Animals can work on steeper slopes and wetter soil than machinery and, being lighter, do not damage the soil as much by compressing it.
The Philippine Carabao Center of the Department of Agriculture, established in 1992, is devoted to the genetic improvement of the animals.
Present efforts are concentrating on improving their milk output (Hernandez, 2006). Efforts are also needed to breed them for strength, endurance, heat tolerance, and longevity. The ubiquitous motorized tricycles will become obsolete as fuel prices climb, and will have to be replaced by horse-drawn vehicles and human-powered pedicabs. Loss of tricycles will not be entirely unwelcome: they and their fuel are expensive imports; they pollute the air and the quiet; and, worst of all, they do not even provide their drivers with a decent living. In addition, people will be healthier if they walk a kilometer or two instead of riding.
Coal
The Philippines has 19 coal districts with estimated reserves of 2.3 billion tons of fairly young deposits, ranging in age from Eocene to Pleistocene (Flores et al., 2006; Fig. 12). Being geologically young, about 84 percent of this coal is the sub-bituminous and lignite grades that yield
FIGURE 12. Coal deposits in the Philippines. Modified from Flores et al., 2006.
ASIAN STUDIES
relatively little energy when burned. Only the mmor deposits of Catanduanes coal are the higher semi-anthracite grade. In 2004, the Philippines mined 2, 726,500 tons of coal, most of it Semirara sub- bituminous (Table 2).
Total consumption was almost three times that amount, with two thirds imported, mainly from Indonesia and China (Philippine Department of Energy, 2005). The Philippine demand for coal is expected to increase to 14.7 million tons by 2008.
Oil largely replaced the world's heavy use of coal during the l9'h Century largely because the mining and combustion of coal has serious environmental consequences, but coal still provides about 29 percent of all global energy, and 40 percent of electricity (International Energy Agency, 2006). Next to petroleum, it is the greatest generator of carbon dioxide and the resulting greenhouse warming. Bear in mind that every 12 kilograms of coal carbon we burn generates 44 kilograms of carbon dioxide. The oxides of nitrogen and sulfur from burning coal combine with atmospheric water vapor to form acid rain.
Coal mining also causes habitat destruction, extensive erosion and river siltation, and releases toxic chemicals such as mercury and arsenic into streams and groundwater.
In developed countries, much research is being devoted to finding ways to use coal without emitting carbon dioxide. One solution would be to sequester the carbon dioxide underground. Alternatively, the complex hydrocarbon molecules in coal can be "gasified"-broken under high temperatures and pressures into hydrogen and carbon monoxide. Those gases can then be burned to generate electricity, or reunited into hydrocarbon chains like those of gasoline and diesel using the Fischer- Tropsch synthesis. This process is expensive, however, and making these fuels and using them for transportation releases nearly twice as much carbon dioxide as does burning diesel made from crude oil (Ledford, 2006). It is unlikely that the Philippine government will expend its scarce resources in sequestering carbon dioxide, gasifying coal, or making liquid fuels from it.
TABLE 2. Philippine coal production, imports, and use in 2004.
AREA TONNES PRODUCED PERCENT
Semirara 2,544, 663 93.33
Cebu 20,551 0.75
Negros 11' 195 0.41
Zamboanga del Sur 134,929 5.39
Batan Island 12,660 0.68
Surigao 2,501 0.09
TOTAL 2,726,500
IMPORTED FROM
Indonesia 3,652,915 49.51
China 3,033,534 41.11
Vietnam 364,896 4.96
Australia 325,000 4.40
TOTAL 7,376,345
PRODUCED: 2,726,500 36.64
IMPORTED 7,441,345 63.36
CONSUMED 9,490,000
USE MILLLON TONNES PERCENT
Power generation 7.80 76.71
Cement manufacture 1.99 19.60
Industrial processes 0.38 3.69
TOTAL 10.17
Source: Department of Energy, 2005.
ASIAN STUDIES
Coal combustion releases fine particles, toxic metals, and oxides of sulfur and nitrogen into the atmosphere, causing asthma and other respiratory diseases. Cardiovascular problems are also aggravated in diabetics by these pollutants (NIH, 2006). The toxic metals include the carcinogens arsenic and chromium; lead, which can damage the kidneys and cardiovascular and nervous systems; and mercury, which causes brain damage in fetuses, and motor and emotional disturbances in adults.
Nitrous oxide also combines with ozone, forming smog. For these health reasons, Philippine NGOs and environmental groups are campaigning against coal-fired plants in Sua!, Pangasinan; Pagbilao, Quezon; Calaca, Batangas; Toledo, Cebu; Banate, Iloilo; and Misamis Oriental. Given all these adverse effects, coal use should be reduced as much as possible, and the Philippine government should reconsider its projected increase of coal use to 14.7 million tons by 2008 (Philippine Department of Energy, 2005).
Natural gas
Discovery and exploitation of the Malampaya natural gas field off Palawan has greatly benefited the Philippines by partially substituting for imported oil to generate electricity (Fig. 1 0). In 2005, the Malampaya field yielded 115,870 million cubic feet of gas and 5,576,350 barrels of condensate. An additional 93 million cubic feet of gas was produced at the San Antonio gas field in Isabela (Department of Energy, 2006). The search for additional gas fields is continuing.
Beneficial to the Philippine .economy as it is, we must realize that burning natural gas also pumps greenhouse carbon dioxide into the atmosphere. Furthermore, any molecule of methane that escapes during extraction and transport is twenty times as strong a greenhouse gas as a molecule of carbon dioxide. For the sake not only of the country but for humanity as a whole, we must continue to search for alternative, cleaner sources of energy.
Petroleum
An intense Philippine search for oil began in the 1950s, with little success except for the minor quantities found offshore from Palawan.
Barring large discoveries in the Spratlys, the Philippines cannot expect to develop major oil fields. The Philippines consumes much more petroleum than it produces. In 2003 it used an estimated 335,000 barrels of oil per day, of which 312,000 was imported (Central Intelligence Agency, 2006).
Offshore Palawan oil wells yielded only 208,000 barrels of crude oil in 2005, less than one day of Philippine consumption.
Geothermal Energy
Relatively cheap to generate, geothermal energy is also relatively clean because it uses the steam heated within the Earth and does not emit greenhouse gases. Accordingly, the world is accelerating its production of geothermal electricity. The Philippine nation is at the forefront of this increase. In 1969, the Tiwi plant in Albay province generated its first 2.5 kilowatts; by 2000, the 1,900 megawatts produced by the Philippines was surpassed only by the United States. In 2002, geothermal energy already was providing about 19 percent of the country's total electricity (Philippine Department or Energy, 2004).
Huttrer (2001) projected that by 2005 the nation would become the world's largest generator of geothermal power, its 2700 megawatts overtaking the 2376 produced by the US. Proven geothermal reserves amount to about 2,000 megawatts, and potential reserves are an estimated 4,800 megawatts. As Figure 13 shows, the tectonic and volcanic setting of the archipelago provides the Philippines with numerous paten tial geothermal sites. The Philippine Institute of Volcanology and Seismology (2002) listed 22 active and 27 potentially active volcanoes. The Philippines also has 359 inactive volcanic centers; many of them continue to emanate hot water and steam, and thus are very promising prospects for additional electricity.
ASIAN STUDIES
FIGURE 13. Major Philippine geothermal energy sites.
Modified from PHIVOLCS data.
http://www.phivolcs.dost.gov.ph/vmepd/vmepd/volclist.html.
Even without adding geothermal plants, the ex1stmg ones can effectively increase their output by being made more efficient. The standard practice is to stream the electricity from a plant into the entire national network. A fundamental principle of physics is that the farther electric current has to travel, the more energy is lost; thus, electricity should be consumed as close to its source as possible. Industry should be given incentives such as cheap rates to cluster around geothermal plants, and communities around them should enjoy cheap local rates that may help them increase their economic productivity. Deciding to open any new plant should involve analysis of its potential to serve not only existing communities and industries, but to the possibilities for establishing new industries to process untapped local resources.
Hydro and Mini Hydro Power
In 2005 the Philippines generated 8,400 gigawatt-hours of hydroelectricity, mainly at its Ambuklao, Binga and San Roque dams (Department of Energy, 2006). The government does not plan to build other large, new facilities, and proposes instead to add to the 51 existing mini hydro plants with a capacity of 82 megawatts.
Interestingly, while China and India are still building large hydroelectric projects, the developed countries are decommissioning their own dams because they have discovered that the environmental damage and the costs of displacing populations are too great. Furthermore, the popular belief that hydroelectric power is superior to fossil fuels because it does not release greenhouse gases is simply not true (Pearce, 2000;
Graham-Rowe, 2005). When a dam is built and a basin is first flooded, the great quantities of tree and plant tissue are drowned and rot, forming carbon dioxide. Vegetal material then continues to wash down the basin slopes to the reservoir floor, where it rots without oxygen, forming methane that dissolves into the water. This most noxious of greenhouse gases is releastld as the water passes through the hydroelectric turbines. It has been estimated that each unit of hydroelectric power may actually release
ASIAN STUDIES
three times more greenhouse gases than those released by an equivalent unit generated with fossil fuel.
Using the flow-through of small streams to generate electricity in mini hydro plants does not generate greenhouse gases. Mini hydro is not only environmentally friendly; it is one of the cheapest and most reliable ways to generate clean electricity, offering several advantages over solar, wave and wind power (British Hydro Association, 2007). Its 70 to 90 percent efficiency is unequaled. The capacity factor of any power- generating system is the amount of electricity that it produces over a period of time, divided by the amount it could have produced had it run on full load over that period. The typical capacity factor for mini hydro is 50 percent, compared to 30 and 10 percent respectively for wind generators and photovoltaic solar. Mini hydro power predictably varies with seasonal rainfall, and gradually from day to day, not from minute to minute like wind or solar power. Mini hydro systems can be built to last for 50 years or more.
Mountainous terrain and humid climate have endowed the Philippines with many streams. They could provide about l, l 00 megawatts of additional electric power from small-scale hydropower generators, according to the Department of Energy (2005). For the period 2000-2009, DOE has identified 12 mini-hydro sites with a combined capacity of 70,000 kilowatts that would generate 300 gigawatt-hours, equivalent to the energy in half a million barrels of oil. By the end of 2009, the total mini-hydropower could reach 160 megawatts, generating 560 gigawatt-hours. The small impoundments for mini hydro could serve the domestic water needs of small communities, and seepage from them into the ground would replenish local groundwater supplies. To be maximally effective, the electricity generated by mini-hydro systems should be de'Signed to serve their localities, eliminating the power loss incurred by long-distance transport. For all these reasons, the national government should continue to encourage and assist local communities in developing their own mini hydro system.
Wind
Prospects for electricity generation from wind are excellent in the Philippines. The 25-megawatt wind power plant on the coast of Bangui Bay, !locos Norte (Fig. 14) is the first large-scale wind power plant in Southeast Asia, producing 7 5 gigawatt hours per year. Modern wind generators such as the 15 Vestas NM82 turbines used in Bangui Bay are computerized to feed electricity smoothly into the grid and maximize power production.
The blades are hydraulically activated to rapidly reduce loads of high winds, and feather in response to the sustained high winds of typhoons.
Bangui Bay is only the beginning. The World Bank (2004) estimated the Philippine potential for wind-generated power at 70 gigawatts, and identified 4 7 provinces with at least 500 megawatts of potential, 25 of
FIGURE 14. The wind farm in Bangui Bay, llocos Norte.
Photograph by Tonie Santos.
ASIAN STUDIES
\\·hich could generate I ,000 megawatts or more. In late 2006, German funding was obtained to construct two other Ilocos wind farms with a joint capacity of 76 megawatts (Adriano, 2006).
The Department of Energy (2005) offered sixteen potential wind power sites to private investors, of which five were approved for development by various private companies.
Solar
Directly or indirectly, the Sun is the main source of energy in the world. Only geothermal, nuclear and tidal energy cannot be traced back to sunlight. The energy in coal, natural gas, oil, and plants was converted from sunlight into stored chemical energy by photosynthesizing organisms.
Unequal heating of the planet by the Sun is what drives the winds, ocean currents, and waves. Solar heating of the sea surface creates the large temperature difference between it and the deep ocean waters that may be harnessed to generate energy.
The increasing costs of fossil fuels, and concern over the greenhouse gases they generate, have caused rapid growth of electricity produced directly from sunlight all over the world (Fig. 15). Being near the Equator, the Philippines receives optimal solar irradiance and is favorably located to participate in that increase. The amount of energy received by any point on Earth's surface depends on its latitude. At the Equator, peak irradiance delivers 1,020 watts per square meter. Solar radiation changes in intensity with the hour of the day, time of the year and weather conditions such as cloud cover. The total amount of solar radiation energy in a region is expressed in Peak Sun Hours (PSH), the average amount of sun per square meter available per day throughout the year. One PSH provides 1 kilowatt-hour per square meter of solar energy. By this measure, Luzon and the northern Visayas enjoy 3.5 to 4 PSH, whereas the southern Visayas, Palawan and Mindanao have 4 to 4.5 (Advanced Energy Group, 2006).
In contrast, the southwestern desert of the United States has 5 to 5.5 PSH, but the central and northern states have only 1 to 2.
3,500
3,000
3,000
2,500
Y2
~ so; 2.000<5
IL ::.;:
1.500
1.000
500
0
1992 1993 1994 1995 1996 1997 1998 1999 2000 2001 2002 2003 2004 2005 YEAR
FIGURE 15. Growth in photovoltaic power production from 1992 to 2005, reported by 20 countries to the International Energy Agency (2006).
The black basal portions of the bars are "stand alone" systems; the gray upper portions represent the production fed into power grids.
Direct solar energy is captured in several ways. In temperate regions,
"passive solar" systems are used to heat houses and domestic hot water. In deserts and semi-arid areas, megawatts of electricity are generated in large plants by using parabolic mirrors shaped like dishes or troughs to focus sunlight on fluids that in turn heat water into steam that drives turbines.
Those technologies are unsuited for the often-cloudy Philippines, but photovoltaic solar, or PV, is not.
In photovoltaic systems, photons-particles of solar energy- dislodge electrons in films of semiconductor material such as silicon and convert them into electric current. The electricity can be stored in batteries
ASIA.l\J STUDIES
and converted to usable alternating current, or it can be fed directly into power grids. Most PV electricity generated for individual homes in developed countries does not require batteries. Instead, the current is fed into power grids with "net metering": The home owners pay only for any electricity they use beyond the amounts they generate, and if the home system generates more electricity than it uses, the utility company pays retail rates for it.
Net metering is still not used in the Philippines, but would be efficient in large urban areas with many houses generating their own PV power. In the meantime, remote rural areas without power grids must rely on battery storage. Funded by Spanish loans, the Solar Power Technology Support Project of the Philippine Department of Energy (2006) had already installed over 9,000 solar home systems in 98 Mindanao communities by the first quarter of 2006, in conjunction with other governmental efforts to improve their socio-economic development. The program is still being expanded.
One consequence of the rapid global growth in PV power generation has been shortages and strong increases in costs for the solar panels. Driven by the strong demand, technologic innovations will inevitably reduce the prices. The Philippine government should seriously consider developing its own fundamental solar industry, benefiting from the nation's low labor costs. It should also encourage Filipino inventors to develop other forms of solar energy. Other developing countries already use cheap, low- technology forms of solar energy to cook food and to dry fruit for storage.
Nuclear Power?
The future role of nuclear power in the Philippines continues to be discussed as a viable option. In 2002, nuclear energy provided about l 7 percent of the world's electricity (Nuclear Information Centre, 2006).
Many proponents for increasing nuclear use cite its freedom from the negative climatic effects of fossil-fuel burning. The high stakes are represented in a powerful nuclear lobby. What is not generally considered
is that uranium mining, processing, and shipping entail large expenditures of fossil fuels, and that the nuclear power industry is strongly subsidized by governments (Caldicott, 2006). Nuclear wastes also pose grave health and environmental threats. From 1952 to 2004, there have been seven serious accidents at nuclear reactors, most notably the Chernobyl tragedy in the Ukraine in 1986 and the Three Mile Island disaster in the United States in 1979 (Information Please, 2006). Nuclear waste disposal and storage also is a large and growing problem. In May, 2005, large volumes of waste containing about 20 tons of uranium and plutonium fuel were leaked through a fractured pipe at a facility in England that stores and reprocesses nuclear waste (Brown 2005).
The US Department of Energy (1999) lists 25 radioactive isotopes in reactor-generated nuclear waste, of which the most important are Tritium (3H); Cesium-137 (137Cs); Strontium-90 FSr); the three natural Uranium isotopes (234, 235, and 238) and Uranium-230 produced in nuclear reactors; four isotopes of plutonium (238Pu, 240Pu, 241Pu), and 242Pu) produced by irradiation of Uranium; Carbon-14 (14C), and Technetium- 99 FTc). Some of these radionuclides have short half-lives and decay in days to a few years, but others, about 3 percent of the wastes, last for millions or billions of years. Arbitrarily, bulk wastes are assumed to be dangerous for 10,000 years, and must be contained and stored for at least that time. To give a context for that length of time, remember that human civilization is only 6,000 years old.
Storage of nuclear waste is a serious problem that the United States has yet to solve. Plans to do so at the Yucca Mountain in Nevada are hampered by scientific concern that the area is geologically unstable, and by pol~~ical opposition by environmentalists and communities concerned about the transport of the wastes through their territories. The wastes also pose a threat from terrorists who might attack repositories, hijack transporting vehicles, or steal the wastes to make "dirty" bombs.
The only attempt to build a Philippine nuclear power plant, at Napot Point in Morong, Bataan, has been a serious economic tragedy (Wilson,
ASIAI\' STUDIES
2004). Started in 1976 and completed in 1984, it was designed to generate 3.8 billion kilowatt-hours, and would have replaced over 200 million U.S. dollars in imported oil annually, but it has never produced any electricity. Corruption of the dictator Ferdinand Marcos and his cronies bloated construction costs and loans from $600 million to $2.3 billion, and to service the debt interest costs the country $155,000 a day. From 1986 to 1998 alone, taxpayers have paid out 48.3 billion pesos.
The corruption was accompanied by serious defects in construction, beginning with the location of the reactor in a region of active faulting and volcanism (Torres, 1992). Mount Pinatubo is only 53 kilometers away, and the reactor site itself is on the flank of Mount Natib, which last erupted no earlier than 18 thousand years ago (Cabato et al., 2005). Mter Marcos was deposed in 1986, a study commissioned by President Aquino detected 4,000 reactor defects. President Ramos wanted to convert the facility into a coal-burning plant, but studies concluded that it was not feasible (Fabros, 1998).
The Bataan Nuclear Power Plant should not be activated, and no other reactors should be constructed. Nuclear waste disposal would be even more difficult in the geologically active Philippines than in the United States, and the reactor itself is susceptible to volcanic eruptions and faulting.
Philippine geologic disasters are frequent, and aggravated by an apparent inability of the government to mitigate them, as exemplified in 2006 alone by the Guinsaogon landslide disaster and the Mayan lahars that respectively killed an estimated l ,500 and 1,200 people.
Biofuels
Bi_ological substances-especially ethanol, biodiesel and biogas- are gain'ing popularity as substitutes for fossil fuels. They also are "carbon neutral"; when burned, they are only returning to the atmosphere the carbon dioxide they withdrew from it. It is important to know, however, that the carbon in the fossil fuels burned annually by humans is equivalent to more than 400 times the carbon fixed by all the world's terrestrial and