BIBLIOGRAPHY
SALCEDO, GLORY MEL Q. APRIL. 2011. Coordination Mechanisms and Attributes Between Actors in the Spot Market Chains for Potato. Benguet State University, La Trinidad, Benguet.
Adviser: Leopoldo N. Tagarino, MRSM (Agribusiness)
ABSTRACT
The study was conducted in various places in La Trinidad, Benguet, Metro Manila and Urdaneta City, Pangasinan to identify the different chains of potato and to determine the coordination mechanisms and attributes adopted in the different spot market chains.
One hundred ninety-three serves as respondents in the study. Majority have an age bracket of 21-30 years old. Majority of the actors were male. Majority of them attended formal education. Most of the different respondents were engaged 1-5 years in business. And almost all the respondents were not members of any organization.
On the resource sharing, majority of the respondents were undecided as to sharing of investments, strategies to achieve the business goals and sharing operation information. Thus, respondents often share to the buyers the investments/strategies and information to improve the business operation. This falls to no resource sharing at all of the respondents.
Along the risks and reward sharing, buyers derived more benefits from the business operation than the different chain actors particularly the farmers, wholesaler- retailers and retailers.
In the decision style, majority of the respondents have their own decision and never the buyer dictates in making the decision.
As to the chain actors always monitor the buyers on the production/procurement and marketing schedules, the farmers and retailers disagreed. On the comprehensive selection procedures, most of the chain actors select their buyers who were trustworthy and at the same time, the buyer usually chooses the sellers that offer lower price, with good quality and adequate volume of potatoes. On socialization, majority of the chain actors extremely agreed whether they transact with the buyer mainly for business.
INTRODUCTION
Rationale
The potato (Solanum tuberosum L.) plays an important role in our economy and country’s effort to attain self- sufficiency in food. Among the best of land- based agriculture priority commodity of the Department of Agriculture, potato ranks second (Personal Communication with Patricio Ananayo, 2010). It remains to be a high value crop because of its local and export potential and growing market demand. Rapid urbanization and the emerging importance of potato processing will generate additional demand. This could be stimulated by growth requirements of the fast food chain and the snacks industry (BNCRDC, 2007).
Supply chain actors such as suppliers, farmers and traders play an important role within the chain. This is because they serve as the agent in providing service to the ultimate consumers (Paloan, 2007). Fresh potatoes usually pass through agents, assemblers, wholesalers, financier- wholesalers, wholesalers-retailers, retailers and consumers. In general, potato traders employ a chain of middlemen who are based in the province. Agents considered buyers, are usually employed by Manila traders (assembler- wholesaler). The financier-farmers or commonly called supplier-farmers and the financier-wholesalers or commonly called the supplier-traders are the large farmers who give loans to farmers before planting season. Farmers then are committed to sell their produce to the financier-wholesalers at an agreed price. Wholesalers based either in Baguio or Manila to buy the produce in big volumes. Retailers are the end points in the marketing system prior to the consumer (BNCRDC, 2007). These actors work
independently but interdependent with each other. They interact and coordinate with each other through different mechanisms for transactions.
Coordination mechanism is employed along the chain. Xu and Beamon (2006) defined coordination mechanism as a set of methods used to manage interdependence between organizations. Thus, coordination within supply chain is strategic responses to the problems that arise from inter – organizational dependencies within the chain.
Statement of the Problem
Studying the coordination mechanisms along potato supply chain aimed to answer the following questions:
1. What are the different chains of potato in the spot market?
2. What are the coordination mechanisms and attributes adopted in the different spot market chains?
3. What are the differences and similarities in the coordination mechanisms and attributes between and among the actors in the spot market chains
Objectives of the Study The research aimed:
1. To identify the different chains of potato in the spot market.
2. To determine the coordination mechanisms and attributes adopted in the different spot market chains in terms of: resource sharing, risks and reward sharing, decision style, level of control, comprehensive selection procedure and socialization.
3. To determine the differences and similarities in the coordination mechanisms and attributes between and among the actors in the spot market chains.
Importance of the Study
Since most literatures in supply chain management were in the field of manufacturing and logistics, the research given fact of the expected contribution to the present literatures in supply chains for agriculture, hence an avenue for future research and development in the fresh vegetables sector supply chain is inevitable.
In the Philippines, agricultural commodity supply chains researches become a research priority agenda for industry development. Hence, this research would contribute in some ways information about potato in the spot market.
Owing the changing market environment in the fresh vegetable sector, analyzing the coordination mechanisms in the spot market chains is a prime consideration. Supply chain management research and development is a growing concern for industry development particularly in fresh vegetables. Interests on this endeavor gained grounds to deal as the market competition increases and to improve the marketing share.
Responding to this, the expected research results would in one way or another could be a source of information to explain the behavior of actors in the spot market. That is the knowledge about the association of coordination mechanisms and attributes in the spot market transactions for potatoes.
Scope and Delimitation
The scope of this study focused on the coordination mechanisms of actors of potato in the informal market. This was conducted on the major trading areas such as La Trinidad Trading Post, Urdaneta City and Metro Manila area.
REVIEW OF LITERATURE
Supply Chain
Folkerts and Koehorst (1998) define supply chain as “a set of interdependent companies that work closely together to manage the flow of goods and services along the value-added chain of agricultural and food products, in order to realize superior customer value at the lowest possible cost”. Supply chain is a network of physical and decision making activities connected by material and information flows that cross organizational boundaries (Van der Vorst, 2000). According to Lambert and Cooper, (2000), there are four main characteristics of a supply chain: First, it goes through several stages of increasing intra- and inter- organizational, vertical coordination. Second, it includes many independent firms, suggesting that managerial relationship is essential. Third, a supply chain includes a bi-directional flow of products and information and the managerial and operational activities. Fourth, chain members aim to fulfill the goals to provide high customer value with an optimal use of resources. Supply chain means the process of planning, implementing and controlling the efficient, cost effective flow and storage of raw materials, in-process inventory, finished goods and related information from the point-of-origin to point of final consumption for the purpose of conforming to customer requirements (Council of Logistics Management, 1986).
Supply chain is a dual flow of products and information. It is the drive to meet the central needs of the consumer and it stresses the importance of the relationships between participants in the marketing system. However, the tendency is often focus solely on the immediate economic aspects when firms are building supply chains (Champion and Fearne, 2001). Hongze Ma (2005) pointed out that supply chain is a network of
organizations from suppliers with the purpose to improve the flow of material and information. Drabenstott (1999) discusses the increasing move toward the development of supply chains and describes supply chain structures where all stages of production, processing and distribution are bound together tightly to ensure reliable, efficient delivery of high quality products.
Coordination Mechanisms and Attributes
In integrated systems or managed coordination, firms work with mutual interest in mind, build long-term relationships, work towards shared benefits, share information openly, and thrive for stability and show independence. The ability to respond quickly to the needs of the market is a key factor in ensuring the survival of the firm over time.
Related to the difficulty of spot markets conveying accurate information is the speed of information flows and the rate of adoption with different coordination mechanisms.
Negotiated coordination results in more rapid transmission of information between economic stages and consequently enhanced ability of the system to adjust to changing consumer demands, economic conditions, or technological improvements (Schrader and Boehlje, 1996).
Wathne and Heide (2000) gave a clear description about the different coordinating mechanisms that facilitate valuable cooperation, and emphasized the importance of understanding the causes and forms of opportunism before identifying the specific governance strategy to attenuate the negative effects of such behavior.
Depending on the underlying conditions under which the specific transaction occurs, different coordinating devices contribute unequally well to the optimization of the exchange relationship.
McCann and Galbrath (1981) analyzed coordination strategies on the bases of three dimensions: 1. formality (from informal personal meetings to more formal arrangement; 2. level of control; and 3. decision localization (centralized or decentralized). According to the authors, an increase in dependency will cause an increase in formality, level of control, and centrality. Malone (1987) pointed out that there are two attributes associated with different coordination structures: 1. information structure (how members share, perceive, and communicate information) and 2.decision function (how members decide what actions to take). Within the decision function, there are two classes: centralized and decentralized. The centralized decision, one firm has primary control and decentralized style, each firm makes its decisions autonomously.
Another important dimension to consider in supply chain coordination, where risks and benefits define the need for coordination, is how to allocate the benefits arising from coordination and which parties absorb the risks. Each organization seeks to implement coordination mechanisms that increase benefits and reduce risk. A framework utilizing four attributes will be used to differentiate the various coordination mechanisms: resource sharing structure; decision style; level of control and; risk/reward sharing (Xu and Beamon, 2006).
Xu and Beamon (2006) defined coordination mechanism as “a set of methods used to manage interdependence between organizations”. By definition, there are a number of people, entities and processes that interact in order to execute supply chain.
Coordination mechanisms then, provide tools for effectively managing these interactions.
Resource sharing structure. Malone (1987) limited consideration to information sharing. Since there are other resources to be shared and communicated within the
context of coordination, the information sharing is extended to include all other resources shared. This dimension is defined as resource sharing structure, and follows the classification given by Varamaki and Vesalainen (2003) as: (1) no resource sharing; (2) operational resource sharing, such as communications between operational levels, sharing operational information such as point-of-sale (POS) data, or pooling operational resources in group problem solving; (3) tactical resource sharing, such as communication between managers in the same function from different firms, to achieve consistency or jointly developing inventory and production plans; and (4) strategic resource sharing, such as forming strategic alliances, forming strategic level meeting, jointly creating strategic plans, sharing strategic information, or jointly investing resources to make strategic advances, especially in the area of research and development.
Risk and reward sharing. Risk and reward sharing describes the characteristics of the selected incentive system. There are two main types of sharing methods: fair and unfair. A fair condition occurs when one firm undertakes more risk than do other firms in the relationships, but receives more benefits from coordination. An unfair condition arises when one firm undertakes less risk but enjoys greater benefits, or when one firm undertakes greater risks with fewer benefits (Xu and Beamon, 2006).
Decision style. For the decision function, there are two main styles: centralized and decentralized. The centralized decision style, one firm has primary control and decentralized style, each firm makes its decisions autonomously (Xu and Beamon, 2006).
Level of control. Control is the process of monitoring activities to ensure they are being accomplished as planned and to correct any significant deviations (Robbins, 1988).
Control has two levels: high and low. A high level of control corresponds to strict activity
monitoring and control. In this case, the coordinating firms develop detailed and strict rules, routines, and monitoring systems to control other firm’s behavior, for the purpose of detecting opportunistic risk. A low level of control corresponds little to no monitoring and control (Xu and Beamon, 2006).
Communication is “the formal as well as informal sharing of meaningful and timely information between firms” (Anderson and Narus, 1990). Frequent and timely communication is important because it assists in resolving conflicts and aligning perceptions and expectations (Morgan and Hunt, 1994).
Schroder and Mavondo (1995) suggested that current communication mechanisms within the food system are inadequate to meet the changing needs of buyers of agricultural commodities. Consequently food processors and distributors are increasingly bypassing open market systems in favor of more direct linkages with agricultural producers.
Figure1. Coordination mechanisms and attributes Resource Sharing
Structure No resource
sharing Operational resource sharing Tactical resource
sharing Strategic resource
sharing
Risk and Reward Sharing
Fair Unfair Decision Style
Centralized Decentralized
Level of Control High level Low level Coordination Mechanisms and
Attributes
Definition of Terms
Farmer - they are the one who produces the commodity.
Wholesaler - refers to middleman who directly sells commodity to retailers in wholesale price.
- middleman who buys good to farmers in large quantities and sell them especially to retailers for resale.
Retailer - one who sell the commodities to the regular customer in small amounts rather than in bulk.
Trucker - the one who’s in charge of carrying the commodity to put it in the different market.
Spot Market - market in which commodities are being delivered and sold.
Chain Actors - persons involved in the process of the supply chain.
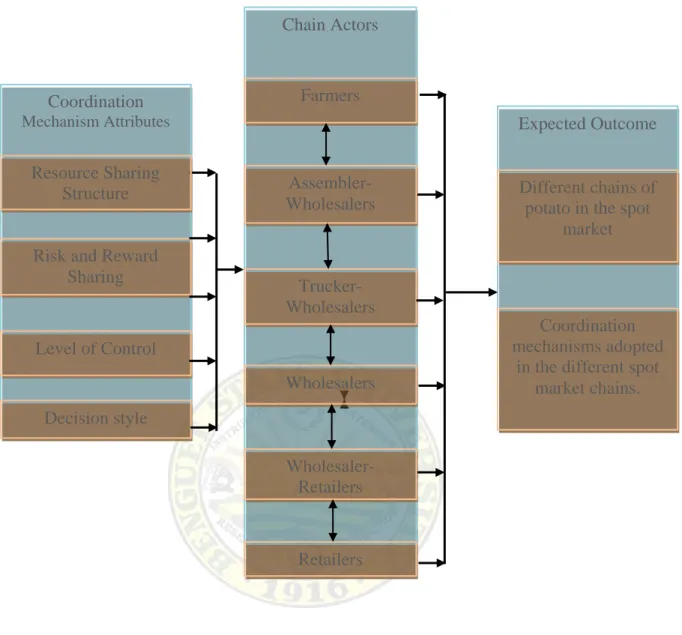
Conceptual Framework
The literatures implied several coordination mechanisms and attributes; however the research shall deal mainly on the resource sharing structure, risk and reward sharing, decision styles and level of control. Thus, the frame of the study is to analyze the coordination mechanisms and attributes among actors and its expected outcome employing this mechanisms.
Figure 2. Conceptual framework Coordination
Mechanism Attributes
Resource Sharing Structure
Risk and Reward Sharing
Level of Control
Decision style
Chain Actors
Expected Outcome Farmers
Wholesaler- Retailers
Retailers Wholesalers
Trucker- Wholesalers
Assembler- Wholesalers
Different chains of potato in the spot
market
Coordination mechanisms adopted
in the different spot market chains.
METHODOLOGY
Locale and Time of the Study
The research locations were following the geographic flow of fresh potatoes from the major source (production) to the major market assembly and collection, and the geographic distribution markets. The research coverage areas are limited to selected production and marketing areas.
The primary market (assembly/collection) was concentrated in La Trinidad, Benguet. Secondary markets (distribution) were the major vegetables trading centers (commonly called “bagsakan”) in Metro Manila such as Balintawak markets. While the tertiary markets are the retailing group within these trading centers and other retail market outlets such as Novaliches, Kamuning, Nepa-Q Mart, Mega-Q Mart, Blumentritt, Basilio and Urdaneta City. The research was conducted on November 2010.
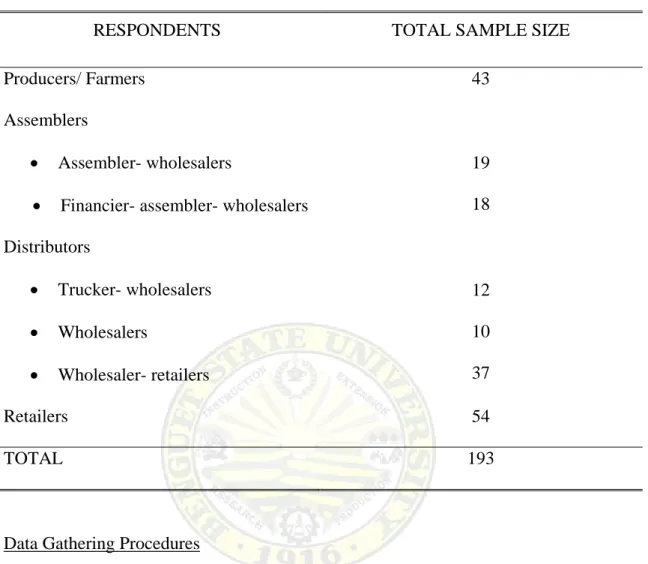
Respondents of the Study
The respondents represent the major actors in the fresh potatoes supply chain. The table below shows the distribution of samples by respondent groups. The total production group was 43. From the responses of farmers to whom the vegetables were sold, the assembly group was identified but a limited number were interviewed due to difficulty in locating them. Thus, the assembly group is 37. Similarly, the same approached used to identify respondents in the distribution group and a total of 59 were interviewed. The last group was interviewed comprises 54 retailers in the wet market. Overall, the research has a total sample of 193 respondents.
Table 1. Distribution of sample size according to respondent groups
RESPONDENTS TOTAL SAMPLE SIZE
Producers/ Farmers 43
Assemblers
• Assembler- wholesalers
• Financier- assembler- wholesalers
19 18 Distributors
• Trucker- wholesalers
• Wholesalers
• Wholesaler- retailers
12 10 37
Retailers 54
TOTAL 193
Data Gathering Procedures
A prepared structured interview schedule was used by the researcher for data gathering. Pre-testing was applied also to validate the questionnaire. The data collections were followed.
Data Gathered
The data gathered were the following: a) profile of the chain actors; b) coordination mechanisms of these actors along resource sharing in terms of operational, informational and strategy, decision style in the area of production and marketing, level of control in terms of monitoring the operations and risk/reward sharing.
Data Analysis
The data gathered were tabulated in the excel program and analyzed using the statistical package for the social sciences (SPSS) version 16. For descriptive analysis, frequency counts and percentage was used while for the statistical test, the Kruskal- Wallis was used.
RESULTS AND DISCUSSION
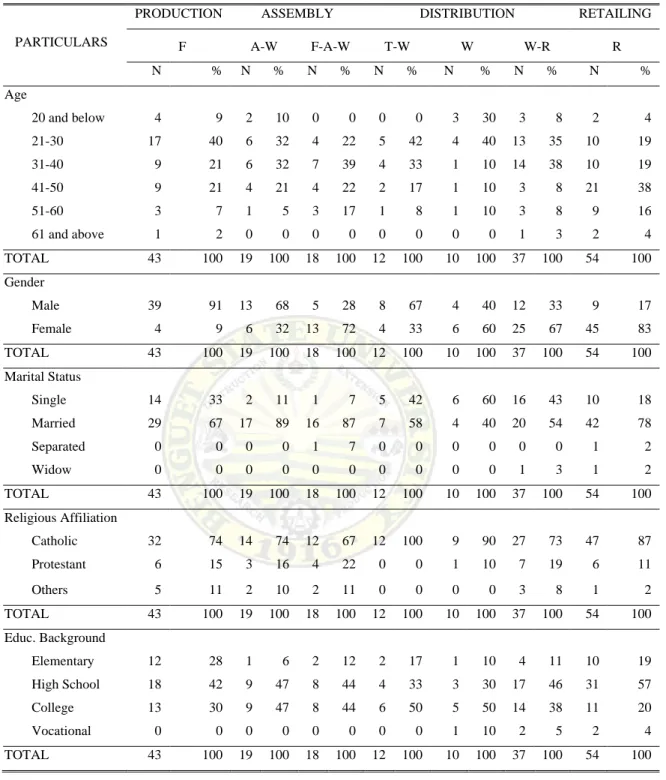
Demographic Profile of the Respondents
Table 2 presents the demographic profile of the different classification of the respondents as to their age, gender, marital status, religious affiliation and educational background.
Age. Majority of the respondents, farmers (40%), assembler-wholesalers (32%), trucker-wholesalers (42%) and wholesalers (40%) are in the age bracket of 21-30 years old, while the financier-assembler-wholesalers (39%) and wholesaler-retailers (38%) belong to age bracket of 31-40 years old. Majority of the retailers (39%) however belong to older age bracket of 41-50 years old. It could further observe that there were farmers and retailers with an age of over 60 years old. Result implies that age does not influence any person to engage in vegetable business.
Gender. There were an unequal number of males and females. Most of the farmer (91%), assembler-wholesaler (68%) and trucker-wholesaler (67%) are males, while most of the financier-assembler-wholesaler (72%), wholesaler (60%), wholesaler-retailer (68%) and retailer (83%) are females. Result shows that majority of hard, difficult work or activities really involved males over females. Similarly, the simpler and ease of activity involves more females than male individuals.
Marital status. Most of the respondents involved in this business are married, followed by single and least numbers are either separated or widowed. This implies that most of the actors involved despite of marital status, engaging in this business would not just a work but also a source of living for themselves or their family.
Table 2. Demographic profile of respondents
PARTICULARS
PRODUCTION ASSEMBLY DISTRIBUTION RETAILING
F A-W F-A-W T-W W W-R R
N % N % N % N % N % N % N %
Age
20 and below 4 9 2 10 0 0 0 0 3 30 3 8 2 4
21-30 17 40 6 32 4 22 5 42 4 40 13 35 10 19
31-40 9 21 6 32 7 39 4 33 1 10 14 38 10 19
41-50 9 21 4 21 4 22 2 17 1 10 3 8 21 38
51-60 3 7 1 5 3 17 1 8 1 10 3 8 9 16
61 and above 1 2 0 0 0 0 0 0 0 0 1 3 2 4
TOTAL 43 100 19 100 18 100 12 100 10 100 37 100 54 100
Gender
Male 39 91 13 68 5 28 8 67 4 40 12 33 9 17
Female 4 9 6 32 13 72 4 33 6 60 25 67 45 83
TOTAL 43 100 19 100 18 100 12 100 10 100 37 100 54 100
Marital Status
Single 14 33 2 11 1 7 5 42 6 60 16 43 10 18
Married 29 67 17 89 16 87 7 58 4 40 20 54 42 78
Separated 0 0 0 0 1 7 0 0 0 0 0 0 1 2
Widow 0 0 0 0 0 0 0 0 0 0 1 3 1 2
TOTAL 43 100 19 100 18 100 12 100 10 100 37 100 54 100
Religious Affiliation
Catholic 32 74 14 74 12 67 12 100 9 90 27 73 47 87
Protestant 6 15 3 16 4 22 0 0 1 10 7 19 6 11
Others 5 11 2 10 2 11 0 0 0 0 3 8 1 2
TOTAL 43 100 19 100 18 100 12 100 10 100 37 100 54 100
Educ. Background
Elementary 12 28 1 6 2 12 2 17 1 10 4 11 10 19
High School 18 42 9 47 8 44 4 33 3 30 17 46 31 57
College 13 30 9 47 8 44 6 50 5 50 14 38 11 20
Vocational 0 0 0 0 0 0 0 0 1 10 2 5 2 4
TOTAL 43 100 19 100 18 100 12 100 10 100 37 100 54 100
F- farmer
A-W- assembler-wholesaler
F-A-W- financier-wholesaler-assembler T-W- trucker-wholesaler
W-wholesaler
W-R- wholesaler-retailer R- retailer
Religious affiliation. The table shows that most of the respondents are Catholic, some are Protestants and only few are affiliated to other religious denomination.
Educational background. Majority of respondents have finished high school and college. Some of them attended elementary and least number attended vocational particularly the distribution and retailing group. This implies that most of the respondents had finished secondary and tertiary level of education.
Number of Years Engaged in Business
Table 3 indicates the number of years engaged in business by the different chain actors. Most of the respondents are engaged 1-5 years in business. Some claimed to be in business 6-10 years, few stated they are engaged 16-20 years. Specifically, majority of the respondents: farmers (37%), assembler-wholesalers (42%), wholesalers (50%) and retailers (28%) were in the business for one to five years old, while majority of the wholesaler-retailers (30%) and financier-assembler-wholesalers (39%) were engaged in vegetable trading for six to ten years and 11-15 years respectively. The results revealed the variations in the number of years the different actors engaged in vegetable business.
The lesser number of years engaged but greater number of respondents implies that more and more people are getting interested to this kind of endeavor.
Table 3. Number of years engaged in business
PRODUCTION ASSEMBLY DISTRIBUTION RETAILING
YEARS F A-w F-a-w T-w W W-r R
N % N % N % N % N % N % N %
Below 1 year 0 0 1 5 0 0 0 0 4 40 0 14 2 4
1-5 years 16 37 8 42 6 33 4 33 5 50 10 27 15 28
6-10 years 5 12 6 32 3 17 3 25 1 10 11 30 9 17
11-15 years 5 12 3 16 7 39 4 33 0 0 5 14 5 9
16-20 years 9 21 0 0 0 0 0 0 0 0 1 3 11 20
21-25 years 2 5 1 5 2 11 1 8 0 0 1 3 2 4
26-30 years 2 5 0 0 0 0 0 0 0 0 1 3 9 17
31 and above 4 9 0 0 0 0 0 0 0 0 3 8 1 2
TOTAL 43 100 19 100 18 100 12 100 10 100 37 100 54 100
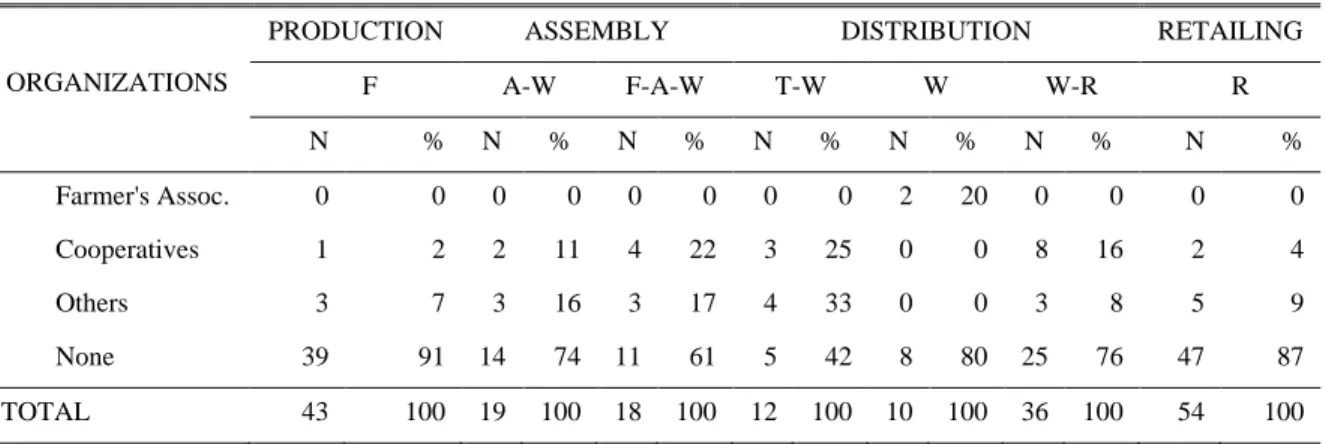
Organizational Affiliations
Majority of the actors especially farmers (91%), assembler-wholesalers (74%), financier-assembler-wholesalers (61%), trucker-wholesalers (42%), wholesalers (76%) and retailers (87%) are not associated to any organization (Table 4). However, few have claimed to be members of cooperative and other organization like vendors association.
Result implies that the respondents may never appreciate the relevance of organization in the business operation.
Table 4. Organizational affiliations
ORGANIZATIONS
PRODUCTION ASSEMBLY DISTRIBUTION RETAILING
F A-W F-A-W T-W W W-R R
N % N % N % N % N % N % N %
Farmer's Assoc. 0 0 0 0 0 0 0 0 2 20 0 0 0 0
Cooperatives 1 2 2 11 4 22 3 25 0 0 8 16 2 4
Others 3 7 3 16 3 17 4 33 0 0 3 8 5 9
None 39 91 14 74 11 61 5 42 8 80 25 76 47 87
TOTAL 43 100 19 100 18 100 12 100 10 100 36 100 54 100
Spot Market Chain and Location for Potato
Figure 3a illustrates the different chain actors involved in the production, procurement and selling of potato in the spot market. It shows the flow of potatoes from its point of production up to the end user/consumer. In general, it describes the different chains that the potato goes to, from the point of production from the different channels up to the end consumer.
Most of the production group from La Trinidad, Benguet sold their produce to the assembly group of the different spot markets such as in Urdaneta City, Pangasinan, La Trinidad, Benguet and Metro Manila. Majority of these assembly groups sold their potatoes to the trucker-wholesalers while there are some selling also to the distribution and retailing groups. The distribution groups specifically the trucker-wholesalers from La Trinidad delivers the potatoes to Urdaneta City, Pangasinan and Balintawak, Quezon City and distributes the products to the buyers such as the wholesalers, wholesaler-retailers and retailers within these trading center. The buyers of these trucker-wholesalers in Balintawak may come from the different spot markets of Metro Manila. The distribution groups ultimately sold their potato to the retailing group however, the trading of potato also happen among the different actors within the distribution groups. Lastly, the retailing group from the different spot markets sold their potatoes to the consumers of these different trading centers.
LEGEND:
F (Farmer)
A-W (Assembler-Wholesaler) LTVTP (La Trinidad Vegetable Trading Post) F-A-W (Financier- Assembler-Wholesaler) PTC (Private Trading Center)
F-A-W-R (Financier-Assembler-Wholesaler-Retailer) Urdaneta, Pangasinan T-W (Trucker-Wholesaler) Balintawak
W (Wholesaler Metro Manila W-R (Wholesaler-Retailer) R (Retailer)
Figure 2. Spot market chain and location for potato 19
W-R METRO MANILA CONSUMERS
URDANETA, PANG. CONSUMERS
LTVTP CONSUMERS
METRO MANILA A-W
LTVTP
T-W LTVTP F-A-W-R
LTVTP
W BALINTAWAK
R LTVTP
A-W BALINTAWAK
W BALINTAWAK
W-R METRO MANILA W-R
LTVTP
R METRO MANILA F-A-W
LTVTP
T-W BALINTAWAK
F-A-W BALINTAWAK A-W
PTC F PTC
F LTVTP
R URDANETA, PANG.
A-W URDANETA, PANG.
W-R URDANETA, PANG.
W METRO MANILA F-A-W
URDANETA, PANG.
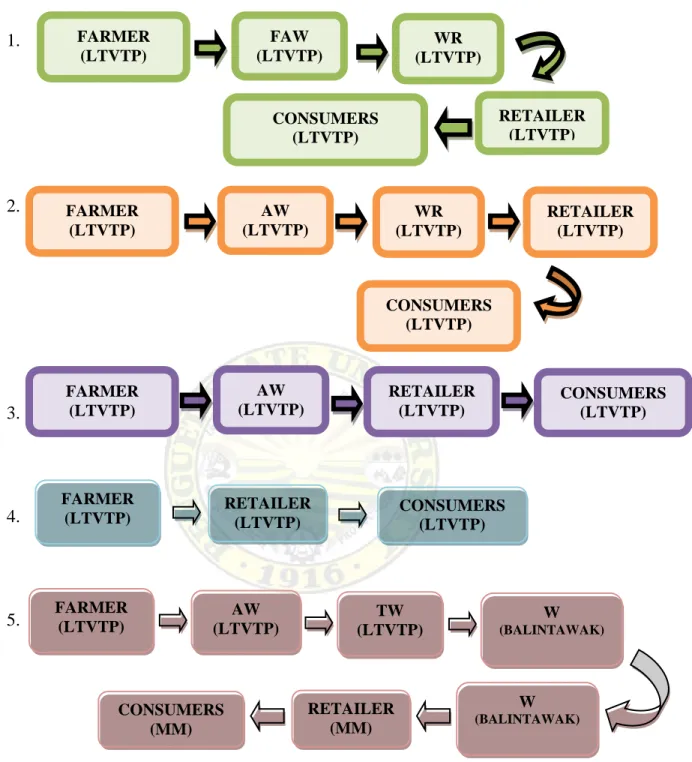
On the other hand, Figure 3b illustrates a more detailed product flow (different chain in specific) of potato spot market.
In La Trinidad trading post, from the farmer (Chain 1) the product is passed to the financier-assembler-wholesaler who supplies the seller farm inputs or some capital/loan for the business operation. The farmer then delivers their produce to the financier- assembler-wholesaler (F-A-W) as payment. From the F-A-W, the vegetables are sold to the wholesaler-retailer in the same area and then sell it to the retailer. From the retailer it goes to the ultimate consumer which either the households or restaurants.
In La Trinidad Vegetable Trading Post (LTVTP), Chain 2 shows similar to the previous chain. The difference is that from the farmer, they directly sell it to the assembler-wholesaler which sometimes their “suki” (regular buyer). And sell it to the wholesaler-retailer. With negotiated price, the retailer buys product to the assembler- wholesaler and sell it to the end consumer.
In LTVTP to Balintawak market, Chain 6 is similar to the first chain, the difference is that from financier-assembler-wholesaler directly sell the product to the trucker-wholesaler from Balintawak and deliver then to the designated market. The same procedure is followed in the Chain 1. From the trucker-wholesaler, the potatoes are delivered to the wholesaler-retailers then to retailers and to the ultimate consumer.
In LTVTP to Urdaneta, Pangasinan, Chain 8 is similar to the second chain, the difference is that from assembler-wholesaler sell the potatoes to trucker-wholesaler of La Trinidad then deliver to the “bagsakan” at Urdaneta. The same procedure is followed in Chain 2.
1.
2.
3.
4.
5.
LEGEND:
FAW- Financier-assembler-wholesaler LTVTP- La Trinidad Vegetable Trading Post
AW- Assembler-wholesaler MM- Metro Manila
TW- Trucker-wholesaler PTC- Private Trading Center
WR- wholesaler-retailer
Figure 3 b. Spot market chains for potato FARMER
(LTVTP)
FAW (LTVTP)
RETAILER (LTVTP) CONSUMERS
(LTVTP)
FARMER (LTVTP)
AW (LTVTP)
WR (LTVTP)
RETAILER (LTVTP) WR
(LTVTP)
CONSUMERS (LTVTP)
FARMER (LTVTP)
AW (LTVTP)
RETAILER (LTVTP)
CONSUMERS (LTVTP)
FARMER
(LTVTP) RETAILER (LTVTP)
CONSUMERS (LTVTP)
FARMER (LTVTP)
AW (LTVTP)
TW (LTVTP)
W
(BALINTAWAK)
RETAILER (MM) CONSUMERS
(MM)
W
(BALINTAWAK)
6.
7.
8.
9.
10.
FARMER (LTVTP)
FAW
(BALINTAWAK)
CONSUMERS (MM)
FARMER (LTVTP)
FAW
(BALINTAWAK)
WR (MM) CONSUMERS
(MM)
FARMER (LTVTP)
AW (LTVTP)
RETAILER (URDANETA) TR
(LTVTP)
WR (URDANETA
)
CONSUMERS (URDANETA)
FARMER (LTVTP)
AW (URDANETA)
RETAILER (MM) CONSUMERS
(URDANETA) AW (URDANETA)
FAW (URDANETA CONSUMERS
(URDANETA FARMER
(PTC)
AW (PTC)
TW (LTVTP)
CONSUMERS (URDANETA)
TW
(BALINTAWAK)
WR (MM)
RETAILER (MM)
TW
(BALINTAWAK)
W
(BALINTAWAK)
RETAILER (MM)
FAW (URDANETA)
WR (URDANETA)
RETAILER (URDANETA)
Resource Sharing
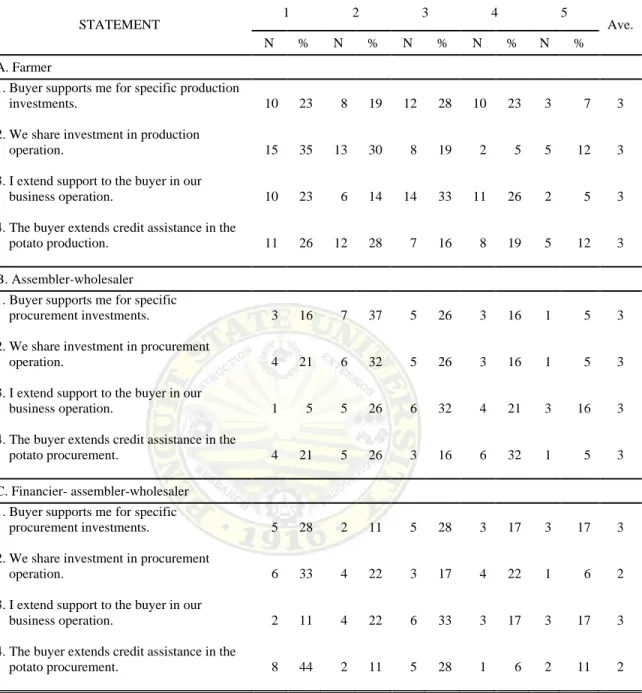
Table 5 presents the distribution according to resource sharing as to operational resource sharing, strategic resource sharing and information resource sharing of the different respondents in the supply chain.
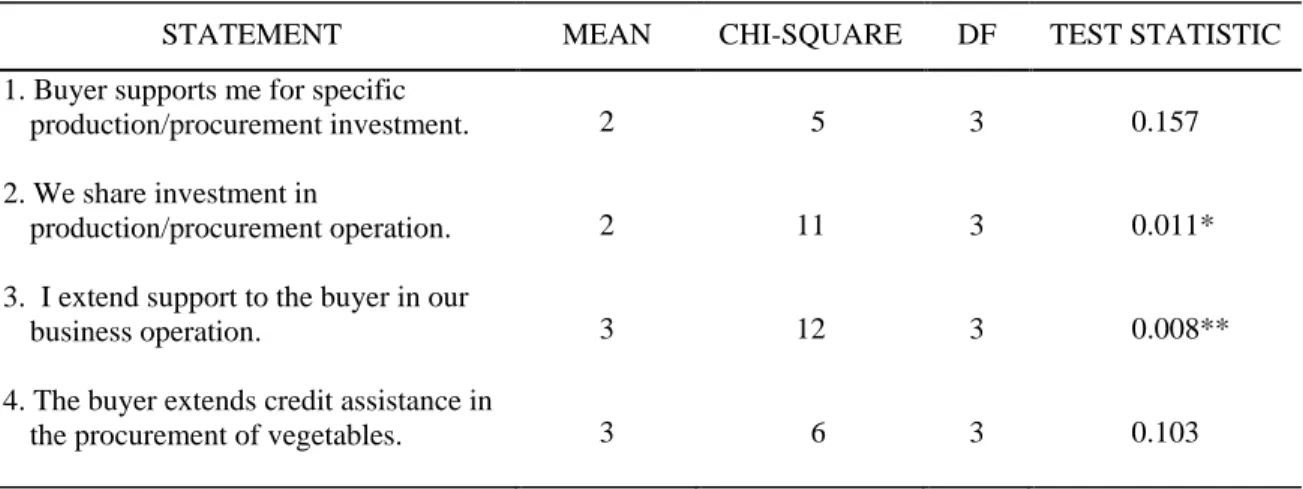
Operational resource sharing. Resources shared are capital, facilities, equipment in the business operation. Given the responses of the different respondents on buyer supports me for specific production/procurement investments, financier-assembler- wholesaler (28%), trucker-wholesaler (33%), wholesaler (60%), wholesaler-retailer (32%) and retailer (56%) have extreme response of strongly disagree however assembler- wholesaler (37%) and farmer (28%) disagree and undecided respectively. Looking into the average it was undecided to moderately disagree. Moreover, based on the descriptive statistics of 3, implied that buyers do not support them for investments. This finding further support the result of the test statistic of 0.157 not significant which implies that the different actors have the same understanding on this statement.
Majority of the responses of the different actors, farmer (34%), financier- assembler-wholesaler (33%), trucker-wholesaler (83%), wholesaler (50%), wholesaler- retailer (46%) and retailer (65%) strongly disagree as they share with the buyer investment in production/procurement operation. This further explained by the average of which moderately disagree to undecided. Moreover, based on the descriptive mean statistic of two, implies that respondents disagree to sharing investment with the actors.
The test statistics of 0.011 showed significant difference among the respondents, therefore there are disagreements in the sharing of operational resources particularly the capital for business operation.
Table 5 a. Operational resource sharing
STATEMENT 1 2 3 4 5
Ave.
N % N % N % N % N %
A. Farmer
1. Buyer supports me for specific production investments.
10 23 8 19 12 28 10 23 3 7 3
2. We share investment in production
operation. 15 35 13 30 8 19 2 5 5 12 3
3. I extend support to the buyer in our
business operation. 10 23 6 14 14 33 11 26 2 5 3
4. The buyer extends credit assistance in the
potato production. 11 26 12 28 7 16 8 19 5 12 3
B. Assembler-wholesaler
1. Buyer supports me for specific procurement investments.
3 16 7 37 5 26 3 16 1 5 3
2. We share investment in procurement
operation. 4 21 6 32 5 26 3 16 1 5 3
3. I extend support to the buyer in our
business operation. 1 5 5 26 6 32 4 21 3 16 3
4. The buyer extends credit assistance in the
potato procurement. 4 21 5 26 3 16 6 32 1 5 3
C. Financier- assembler-wholesaler
1. Buyer supports me for specific procurement investments.
5 28 2 11 5 28 3 17 3 17 3
2. We share investment in procurement
operation. 6 33 4 22 3 17 4 22 1 6 2
3. I extend support to the buyer in our
business operation. 2 11 4 22 6 33 3 17 3 17 3
4. The buyer extends credit assistance in the
potato procurement. 8 44 2 11 5 28 1 6 2 11 2
Legend:
1- strongly disagree 2- moderately disagree 3- undecided
4- moderately agree 5- strongly agree
Table 5 a. Continued . . .
STATEMENT 1 2 3 4 5
AVE.
N % N % N % N % N %
D. Trucker-wholesaler
1. Buyer supports me for specific procurement investments.
4 33 4 33 1 8 2 17 1 8 2
2. We share investment in
production/procurement operation. 10 83 0 0 2 17 0 0 0 0 1
3. I extend support to the buyer in our business
operation. 2 17 0 0 3 25 5 42 2 17 3
4. The buyer extends credit assistance in the
procurement of vegetables. 5 42 1 8 3 25 3 25 0 0 2
E. Wholesaler
1. Buyer supports me for specific procurement
investments. 6 60 3 30 1 10 0 0 0 0 2
2. We share investment in procurement
operation. 5 50 4 40 1 10 0 0 0 0 2
3. I extend support to the buyer in our business
operation. 1 10 0 0 5 50 3 30 1 10 3
4. The buyer extends credit assistance in the
procurement of vegetables. 3 30 2 20 3 30 1 10 1 10 3
F. Wholesaler-retailer
1. Buyer supports me for specific procurement investments.
12 32 4 11 10 27 6 16 5 14 3
2. We share investment in procurement
operation. 17 46 8 22 5 14 5 14 2 5 2
3. I extend support to the buyer in our business
operation. 4 11 3 8 10 27 11 30 9 24 3
4. The buyer extends credit assistance in the
procurement of vegetables. 10 27 7 19 5 14 8 22 7 19 3
G. Retailer
1. Buyer supports me for specific procurement investments.
30 56 2 4 8 15 10 19 4 7 2
2. We share investment in procurement
operation. 35 65 4 7 8 15 5 9 2 4 2
3. I extend support to the buyer in our business
operation. 12 22 11 20 16 30 10 19 4 7 3
4. The buyer extends credit assistance in the
procurement of vegetables. 27 50 6 11 8 15 7 13 4 7 2
Table 5 b. Descriptive and test statistics
STATEMENT MEAN CHI-SQUARE DF TEST STATISTIC
1. Buyer supports me for specific
production/procurement investment. 2 5 3 0.157
2. We share investment in
production/procurement operation. 2 11 3 0.011*
3. I extend support to the buyer in our
business operation. 3 12 3 0.008**
4. The buyer extends credit assistance in
the procurement of vegetables. 3 6 3 0.103
*significant difference ** very significant
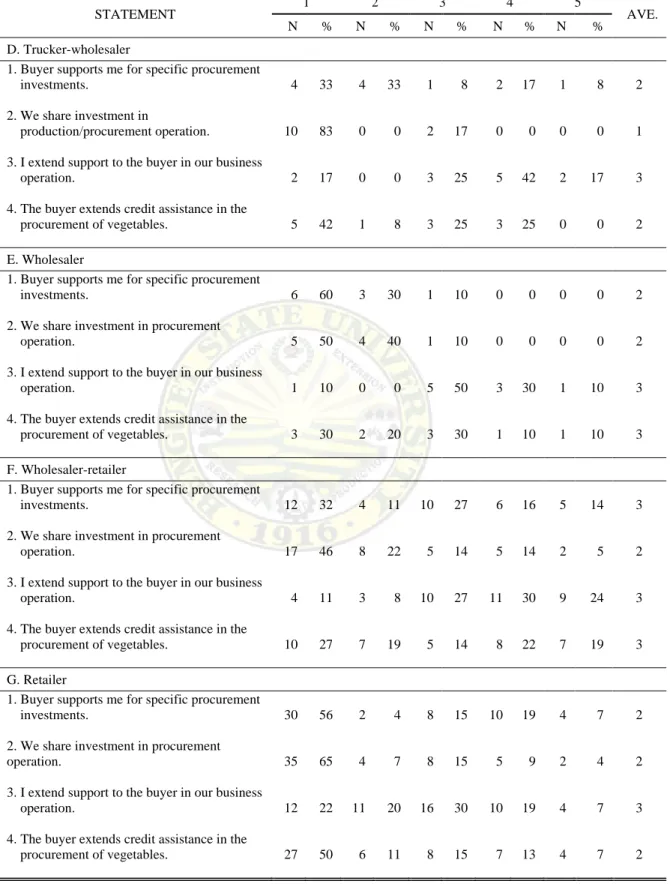
Most of the farmers (33%), assembler-wholesaler (32%), financier-assembler- wholesaler (33%), wholesaler (50%) and retailer (30%) were uncertain to extend support to the buyers in their business operation but the trucker-wholesaler (42%) and wholesaler-retailer (30%) moderately agree to this condition. This mean, the respondents indicated vested interest in their owned business. These trucker-wholesalers however support their buyers particularly the wholesalers and wholesaler-retailers whom assumed to be their regular buyers that would enable them to create good business in the long run.
This further justified by the mean average of three which means they moderately disagree to undecided. The result of test statistic of 0.008 revealed there appeared very significant difference among the actor’s response that is they vary according to the condition.
However, the trucker-wholesaler can extend support to their buyers like delivering the sold product on credit terms.
Table 5a, further indicated that majority of the financier-assembler-wholesaler (44%), trucker-wholesaler (42%), wholesaler (30%), wholesaler-retailer (27%) and retailer (50%) strongly disagree whether the buyer extends credit assistance in the
production/procurement of vegetables. This result implied the indifferences thus exhibit individualistic interest in business operation. The descriptive mean of three and test statistic of 0.103 would further justify this attitude by the different actors in the spot market chain.
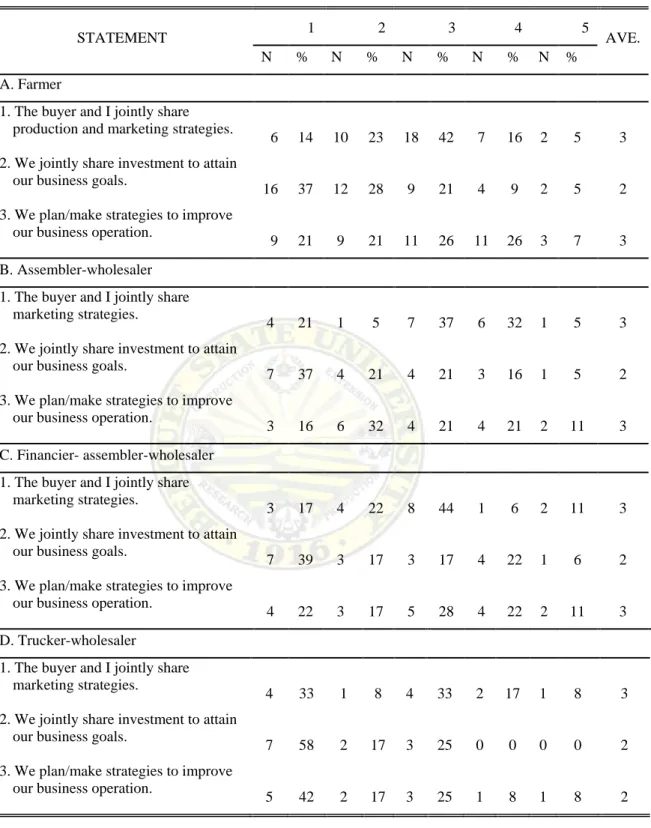
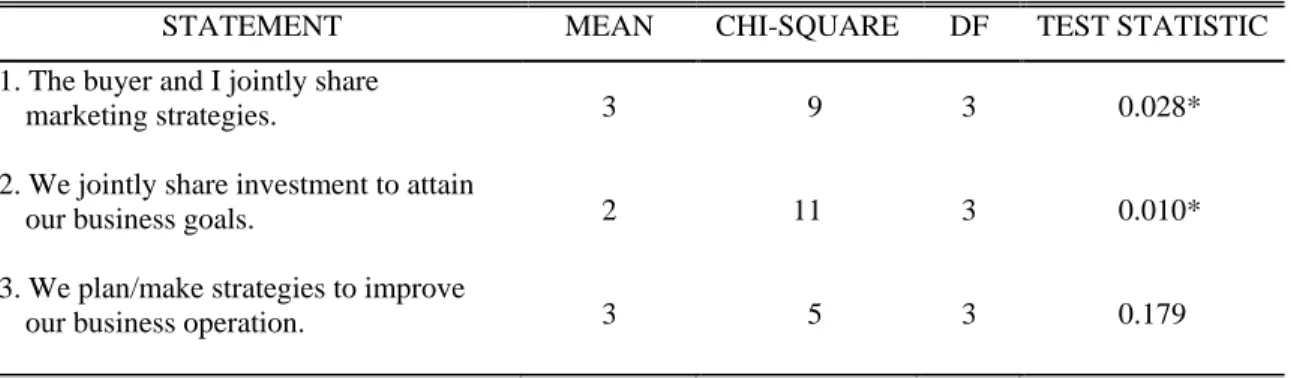
Strategic resource sharing. The buyer and the seller make or plan for actions to achieve or improve their goals. Majority of the actors: farmers (42%), assembler- wholesalers (37%), financier-assembler-wholesalers (44%), trucker-wholesalers (33%) and wholesalers (30%) were undecided with regards the buyer and seller jointly share production/procurement and marketing strategies. The retailer and wholesaler-retailer however strongly disagree and disagree to this condition. This could further justified by frequency average at three and mean statistics of three where the respondents were uncertain on this system of business operation. However test statistic at 0.028 showed that there is significant difference among the different group of respondents. Therefore, it may be assumed that some respondents would be willing to share their marketing strategies to other group. That is, for them to improve their marketing operation.
Almost all of the respondents strongly disagree to jointly share investment in the attainment of business goals. The frequency average of two and mean average of two indicate their disagreement to sharing of investment in business. Test statistic at 0.010 that showed significant differences among the respondents thus proving of individualistic interest on their own business.
Table 6 a. Strategic resource sharing
STATEMENT 1 2 3 4 5
AVE.
N % N % N % N % N %
A. Farmer
1. The buyer and I jointly share production and marketing strategies.
6 14 10 23 18 42 7 16 2 5 3 2. We jointly share investment to attain
our business goals.
16 37 12 28 9 21 4 9 2 5 2
3. We plan/make strategies to improve our business operation.
9 21 9 21 11 26 11 26 3 7 3
B. Assembler-wholesaler
1. The buyer and I jointly share marketing strategies.
4 21 1 5 7 37 6 32 1 5 3
2. We jointly share investment to attain our business goals.
7 37 4 21 4 21 3 16 1 5 2
3. We plan/make strategies to improve our business operation.
3 16 6 32 4 21 4 21 2 11 3
C. Financier- assembler-wholesaler
1. The buyer and I jointly share marketing strategies.
3 17 4 22 8 44 1 6 2 11 3
2. We jointly share investment to attain our business goals.
7 39 3 17 3 17 4 22 1 6 2
3. We plan/make strategies to improve our business operation.
4 22 3 17 5 28 4 22 2 11 3
D. Trucker-wholesaler
1. The buyer and I jointly share marketing strategies.
4 33 1 8 4 33 2 17 1 8 3
2. We jointly share investment to attain our business goals.
7 58 2 17 3 25 0 0 0 0 2
3. We plan/make strategies to improve our business operation.
5 42 2 17 3 25 1 8 1 8 2
Table 6 a. Continued . . .
STATEMENT
1 2 3 4 5
AVE.
N % N % N % N % N %
E. Wholesaler
1. The buyer and I jointly share marketing strategies.
3 30 0 0 3 30 3 30 1 10 3
2. We jointly share investment to attain our business goals.
6 60 2 20 2 20 0 0 0 0 2
3. We plan/make strategies to improve our business operation.
4 40 1 10 1 10 3 30 1 10 3
F. Wholesaler-retailer
1. The buyer and I jointly share marketing strategies.
8 22 10 27 9 24 8 22 2 5 3
2. We jointly share investment to attain our business goals.
20 54 4 11 7 19 5 14 1 3 2
3. We plan/make strategies to improve our business operation.
9 24 10 27 8 22 6 16 4 11 3
G. Retailer
1. The buyer and I jointly share marketing strategies.
23 43 12 22 9 17 4 7 6 11 2
2. We jointly share investment to attain our business goals.
38 70 7 13 4 7 5 9 0 0 2
3. We plan/make strategies to improve our business operation.
30 56 5 9 5 9 5 9 9 17 2
Table 6 b. Descriptive and test statistics
STATEMENT MEAN CHI-SQUARE DF TEST STATISTIC
1. The buyer and I jointly share
marketing strategies. 3 9 3 0.028*
2. We jointly share investment to attain
our business goals. 2 11 3 0.010*
3. We plan/make strategies to improve
our business operation. 3 5 3 0.179
*significant