BUGTONG, HEMBER C. APRIL 2007. Mass Media Habits of Benguet State University Students, First Semester 2006-2007. Benguet State University, La Trinidad, Benguet.
Adviser: Maria Luz D. Fang-asan, PhD
ABSTRACT
This study was conducted to determine the characteristics of the respondents, to identify the mass media used by the BSU students, to determine their reasons for using a particular type of mass media, to determine the information they acquired from mass media, to determine the frequency and duration of exposure to mass media and to determine the information needs of BSU students. An interview schedule was used to gather data from 214 respondents chosen using quota sampling. Most of the respondents were single and belonged to the age range of 19 years old and below.
The most commonly used medium was the radio but the respondents used various other mass media to be informed, to be entertained and to complete school requirements. From the different mass media, the students acquired information on politics, showbiz, economy, religion, job opportunities, and agriculture. Majority of the respondents listened to the radio daily for around two to three hours. Less than half watched TV everyday and/or read newspapers.
It is concluded that most of the students of BSU are within the age group of regular college students; that students are multi-media users; that they have different
only for academic requirements but also for general information. Mass media are a part of the students’ daily lives.
It is recommended that teachers should design alternative learning activities to encourage students to read more or to use mass media. Mass media producers should continue airing, publishing, and posting more educational topics especially on agriculture. BSU may use radio as a medium in disseminating information from the school to BSU students or BSU employees. It is further recommended that a study on the mass media habits of Benguet State University teachers should also be conducted.
Page
Bibliography . . . i
Abstract . . . i
Table of Contents . . . iii
INTRODUCTION Rationale . . . 1
Statement of the Problem . . . 3
Objectives of the Study . . . 3
Importance of the Study . . . 4
Scope and Limitation . . . 4
REVIEW OF LITERATURE Mass Media Habits . . . 5
Information Needs . . . 5
Information Derived from Mass Media . . . 6
Information Sources . . . 6
Reasons for Using Mass Media . . . 7
Definition of terms . . . 7
METHODOLOGY Locale and Time of the Study . . . 8
Respondents of the Study . . . 8
Data Collection . . . 10
Data Analysis . . . 10
Socio- Demographic Profile of the Respondents . . . 11
Living Arrangement . . . 12
Types of Mass Media Used . . . 13
Types of Mass Media Used According to Degree Program . . . 13
Types of Mass Media Used According to Curriculum Year . . . 20
Types of Mass Media Used According to Sex . . . 20
Types of Mass Media Used According to Age . . . 23
Types of Mass Media Used According to Living Arrangement . . . 23
Reasons for Using Broadcast and Print Media . . . 24
Reasons for Using Educational Media . . . . 27
Kinds of Information Acquired from Broadcast Media . . . . 27
Kinds of Information Acquired from Print Media . . . 28
Kinds of Information Acquired from Educational Media . . . . 30
Frequency of Using Broadcast Media . . . . 31
Frequency of Using Print Media . . . 31
Frequency of Using Educational Media . . . 32
Duration of Exposure to Broadcast Media . . . 32
Duration of E0xposure to Print Media . . . 34
Duration of Exposure to Educational Media . . . 34
Information Needs . . . .35
Summary . . . 37
Conclusions . . . 38
Recommendations . . . 39
LITERATURE CITED . . . 40
APPENDIX: Interview Schedule . . . 42
INTRODUCTION
Rationale
Have students become more mass media-oriented in the wake of technological advances which have tremendously increased access to information? One of the most striking developments in today's generation is the advancement of mass communication technologies like the internet, the World Wide Web, and instant global audio and visual communication.
Wikipedia (2006) defines mass media as “ a term used to denote, as a class, that section of the media specifically conceived and designed to reach a very large audience”.
It was coined in the 1920s with the advent of nationwide radio networks and of mass circulation newspapers and magazines.
Hovland (1972) averred that mass media are so powerful in encouraging public participation, strengthening cultural and linguistic diversity, enhancing skills and giving voice to the poor and other marginalized groups.
Mass media contributed to the Protestant Reformation, the decline of Catholic Power in Europe, and the changing mode of interaction among American family members (Veronis, 2001). In the Philippines, Cardinal Sin's plea for help aired over the radio eventually led to the toppling down of President Marcos during the EDSA Revolution in 1986. The mass circulation of text messages also gathered a multitude of disappointed Filipinos a few minutes after the Senate's decision not to open the controversial envelope during the impeachment proceedings against President Joseph E.
Estrada in 2000. This was the start of protest actions which culminated in the installation
of Gloria Macapagal Arroyo as President of the Philippines.
The effects of mass media on behavior have also been the subject of several studies in the past. Bandura (1960) let nursery school children watch films in which an adult encountered Bobo, a three-foot tall pop-up clown. One group of preschoolers saw a version in which the adult beat up Bobo and was then rewarded for being a “strong champion”. Others saw a version in which the adult assailant was scolded for being a bully and was spanked with a rolled up magazine. After watching the film, the children themselves then had a chance to “play” with Bobo. The children who saw the adult model's aggression being rewarded treated the Bobo doll more violently than those who saw the model punished.
Mass media offer many benefits. For students, they are used as course references and as entertainment. Others even use them for enterprising activities like blogging. With possible influences of mass media, their availability and accessibility play a crucial role in people's lives.
In La Trinidad Valley, people can have access to at least 12 radio stations, 40 channels on cable television, five daily broadsheets, eight daily tabloids and four local weekly newspapers. Among those who have access to the aforementioned mass media are students of Benguet State University (BSU), an institution of higher education in the Cordillera Administrative Region.
For School Year 2006-2007, BSU had an enrollment of 6,311 distributed among eight colleges, with the College of Teacher Education (1,961) and College of Agriculture (1,635) having the most number of enrollees. The university uses both print and broadcast media to disseminate information to its students and other clients. A study on
the mass media habits of students in BSU can give insights on how to maximize the use of varied communication channels for the attainment of university objectives.
Statement of the Problem
The mass media habits of Benguet State University (BSU) students still have to be determined, thus, this study sought to answer the following questions:
1. What are the socio-demographic characteristics of the respondents?
2. What mass media do BSU students use?
3. What are the reasons for using the mass media?
4. What information do they acquire from mass media?
5. How frequent and how long is their exposure to mass media?
6. What are the information needs of BSU students?
Objectives of the Study
In general, the study aimed to determine the mass media habits of Benguet State University students. The specific objectives were:
1. To determine the socio-demographic characteristics of the respondents;
2. To identify the mass media used by BSU students;
3. To determine their reasons for using a particular type of mass media;
4. To determine the information they acquire from mass media;
5. To determine the frequency and duration of exposure to mass media; and 6. To determine the information needs of BSU students.
Importance of the Study
Results of the study may be used by Benguet State University for strategic communication planning for its student, determining and designing alternative learning activities; and defining problems to be studied by other communication researchers.
Scope and Limitation
The study looked into mass media habits of BSU students from the College of Agriculture and College of Teacher Education during the first semester of SY 2006-2007.
Mass media that were considered were print, broadcast and internet.
The study did not look into very specific radio or television programs patronized or specific sites accessed on the internet.
REVIEW OF LITERATURE
Mass Media Habits
On a typical Sunday night, 37 million people in the United States will tune in to a prime-time television show. Television sets are in 98% of all homes and VCR's in over 80%. The television sets on for more than 7 and half hours a day in a typical US household. Two thirds of all US adults will read newspapers each day; two-thirds will listen to eh radio for some part of everyday. Americans spent $6.1 billion on video games in 1999, and the typical US household today spends more on media than either clothes or health care. In the first six months of 1999, nearly 3 billion MP3 audio files were downloaded from the Internet or 17 million everyday. The average person spends 3,523 hours a year-60% of his or her waking hours---consuming mass media content (Baran, 2003).
Information Needs
According to Maslog (1986), as cited by Abag (2005), rural men, women and children vary in information needs in accordance with their occupation, residence, sex, roles, interest, and problems. The possible permutations of needed information for any one family are endless. This statement was supported by Abag's (2005) findings that agriculture-related information was the most needed among he farmer-respondents while information on politics and showbiz were the least needed.
The concern for information needs is reiterated by Braid (1983) who stated that communication and information programs should not be merely concerned with the
diffusion and transfer of information and technology. It must likewise promote the protection and conservation of natural resources and the promotion of research and development in order to reduce dependency on imported technology. Furthermore, Dawiguey (2004) found out that five barangays in Bontoc Mt. Province need information on health and nutrition such as family planning
Information Derived from Mass Media
According to Siado (1982), radio programs have provided not only the students but also the community, a vital medium for information and self-development ranging from profitable framing techniques and wise utilization of agricultural and financial resources to nutrition and health guidance topics. An hourly public service programs are also aired daily for the benefit of the community where important topics like family planning, community involvement, peace and order, the direction of the government's developmental thrusts, the problems facing the nation as well as the on-going achievements of the government are being discussed with the help of he barangay leaders.
Information Sources
Radio is the top source of information in Barangay Tawangan and Lusod in Kabayan Benguet (Abag, 2005).
Reasons for Using Mass Media
According to Pongdad (2006), her respondents access the net when there are assignments or research work to complete school requirements. Anno (2003) found out in her study that broadcast, print and educational media were used by her respondents in Mankayan to be informed and to be entertained.
Greenberg ( Vol. V 1978), lists seven reasons for watching televisions that would also pertain to other forms of mass communication such as radio: for past time, for enjoyment, for companionship , for arousal, for learning, for relaxation, and as a source of refuge.
Definition of Terms
Mass media habit refers to the conscious and regular use of broadcast, print and educational media
Broadcast media refers to audio and visual communication media which include radio and television.
Print media refers to reading materials in acquiring information which include newspapers and magazines.
Educational media refers to the material that the respondents used for their school requirements or related to the academic subjects such as books and internet.
METHODOLOGY
Locale and Time of the Study
The study was conducted at Benguet State University, La Trinidad Benguet from September to October 2006.
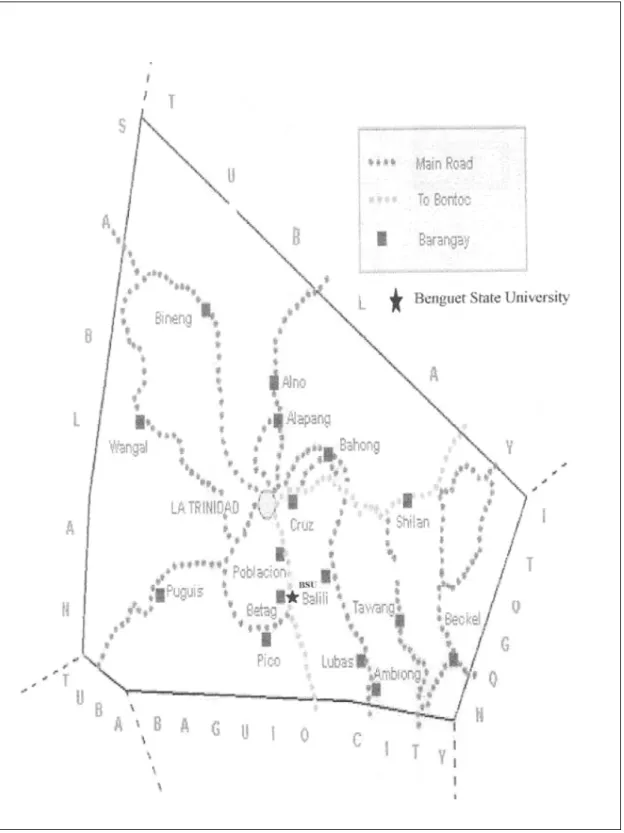
Benguet State University is located at the heart of La Trinidad, the capital of Benguet Province (Fig.1). It is five to six kilometers away from Baguio City, the Summer Capital of the Philippines.
BSU has eight colleges offering 16 degree, five post baccalaureate and four pre baccalaureate non-degree programs. There were 4,985 registered students during the study period.
Respondents of the Study
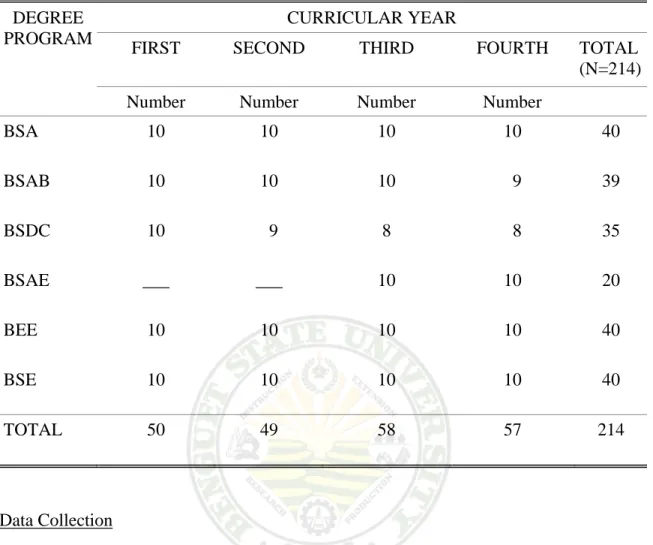
The respondents of the study were 220 BSU students that were chosen using quota sampling. Five males and five females were taken from every year level of each course at the College of Agriculture (CA) and College of Teacher Education (CTE) which are the highest in terms of student population and faculty.
Table 1 presents the distribution of respondents according to degree program and curricular year. It shows there were only twenty (20) Agricultural Education respondents because the program is being phased out so there are no more 1st and 2nd year students.
Figure 1. Map of La Trinidad showing the locale of the study
Table 1. Distribution of respondents according to degree program and year DEGREE
PROGRAM
CURRICULAR YEAR
FIRST SECOND THIRD FOURTH TOTAL
(N=214) Number Number Number Number
BSA 10 10 10 10 40
BSAB 10 10 10 9 39
BSDC 10 9 8 8 35
BSAE ___ ___ 10 10 20
BEE 10 10 10 10 40
BSE 10 10 10 10 40
TOTAL 50 49 58 57 214
Data Collection
An interview schedule was used as the primary tool for obtaining data. The researcher interviewed all the respondents with the help of a research assistant.
The researcher crosschecked the validity of mass media information by determining which were actually accessible in the locality.
Data Analysis
The data gathered from the respondents were tabulated, consolidated, categorized, and interpreted according to the objectives of the study. Frequencies and percentages were used. Cross tabulations were subjected to the chi- square test.
RESULTS AND DISCUSSION
Socio-Demographic Profile of the Respondents
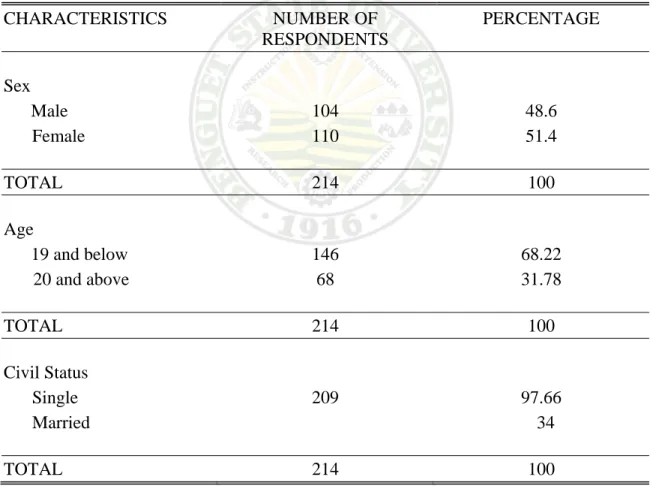
Table 2 shows the respondents' socio-demographic profile in terms of sex, age and civil status. Slightly more than half of the respondents were female and almost all (97.66%) were single. Majority (68.22%) belonged to the age range of 19 years old and below. The youngest was 15 years old and the oldest was 23.
Table 2. Socio-demographic profile of the respondents
CHARACTERISTICS NUMBER OF
RESPONDENTS
PERCENTAGE
Sex
Male 104 48.6
Female 110 51.4
TOTAL 214 100
Age
19 and below 146 68.22
20 and above 68 31.78
TOTAL 214 100
Civil Status
Single 209 97.66
Married 34
TOTAL 214 100
Living Arrangement
Table 3 presents the living arrangement of the respondents which refers to the type of housing they were residing in. This also indicated with whom the respondents shared their residence.
Out of 214 respondents, 85 or 39.72% stayed with their family in their own house in Baguio City, La Trinidad, or in Tublay. BSU is in the heart of La Trinidad which is traversed by several jeepneys, taxis and buses daily, hence it is fairly accessible from any point in the locality. On the other hand, both Baguio City and Tublay are approximately six kilometers from BSU and are easily accessible through public transportation. Many of the respondents (75 or 35.05%) live in boarding houses with members of the family like siblings or even cousins. Only eight lived alone in boarding houses.
Table 3. Living arrangement of the respondents LIVING ARRANGEMENT NUMBER OF
RESPONDENTS
PERCENTAGE
With family in own house 85 39.72
With family in an apartment 30 14.02
With family in a boarding house
14 6.54
With family members in a boarding house
75 35.05
Alone in a boarding house 8 3.74
Dormitory 2 .93
TOTAL 214 100
Types of Mass Media Used
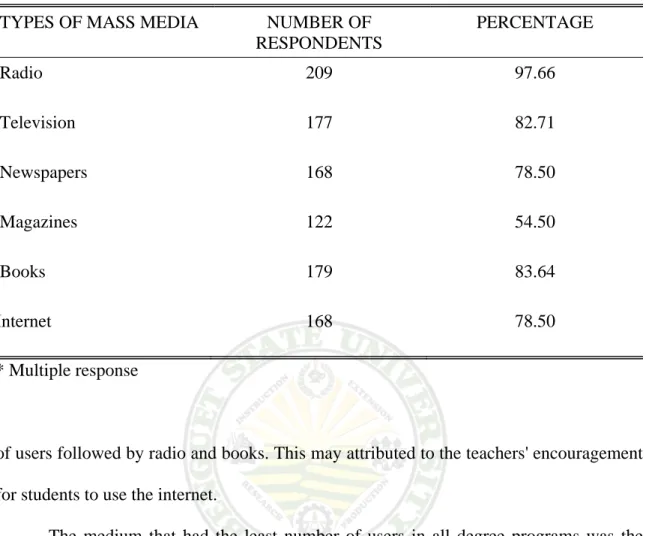
Table 4 presents the types of mass media used by the respondents which include radio, television, newspapers, magazines, books and the internet. These are grouped in subsequent discussion in this study as broadcast media (radio and television), printed media (newspapers and magazines), and educational media (books and internet). Samples of these media being used by students are shown in Figures 2 to 11.
The high frequency of multiple responses for each mass medium indicate that majority of the respondents used four or more mass media. The leading mass media mostly used by the respondents were the radio (97.66%), books (83.64), and television (82.71%). Many of the respondents also used their cellular phones as radio. The internet and newspaper had equal number of users at 168 or 78.50%. Internet was used at the virtual library, computer laboratory room located at the College of Agriculture, computer shops and boarding houses. The least used was the magazine but still it was used by more than half of respondents. Magazines were read at the library or borrowed from friends.
This finding implies that indeed the students of today are mass-media oriented or that they are taking advantage of the technological advances in communication.
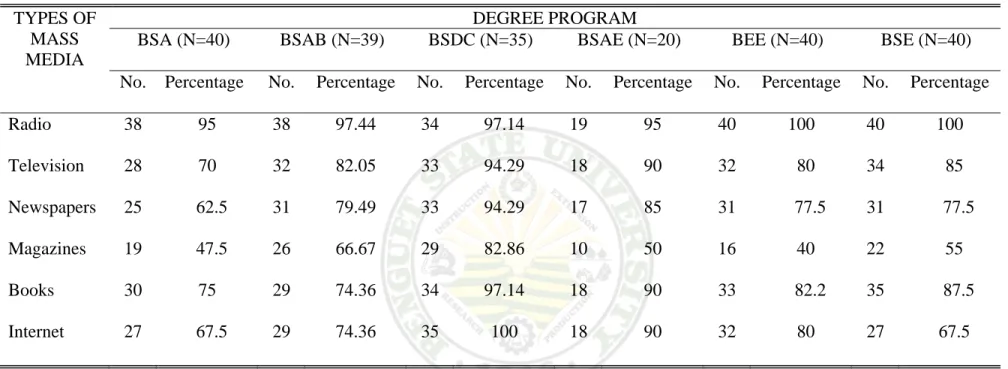
Types of Mass Media Used According to Degree Program
The types of mass media used by students classified according to degree program are presented in Table 5. All respondents from the different degree programs used varied mass media.
As shown in the table, the leading mass medium used by students in all degree programs except for BSDC was the radio. For BSDC, the internet had the highest number
Table 4. Types of mass media used
TYPES OF MASS MEDIA NUMBER OF RESPONDENTS
PERCENTAGE
Radio 209 97.66
Television 177 82.71
Newspapers 168 78.50
Magazines 122 54.50
Books 179 83.64
Internet 168 78.50
* Multiple response
of users followed by radio and books. This may attributed to the teachers' encouragement for students to use the internet.
The medium that had the least number of users in all degree programs was the magazine. Those who read magazines did so at the library or borrowed from friends. All other media had varying ranks in different degree programs.
Statistical analysis indicates that the observed differences are not statistically significant.
Broadcast Media Used by the Students
Figure 2. Student boarders watching television provided by the owner of boarding house
Figure 3 . Radio with speaker used in a boarding house
Figure 4. Students using cellular phone as radio
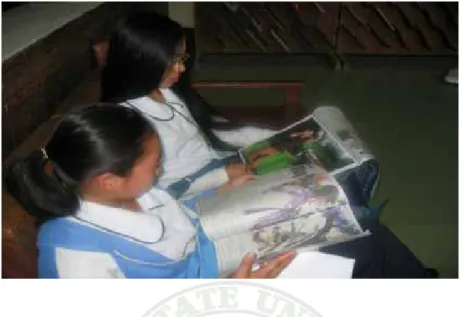
Print Media Used by the Students
Figuere 5. Students reading magazines in the library
Figure 6. Students reading newspapers in the library
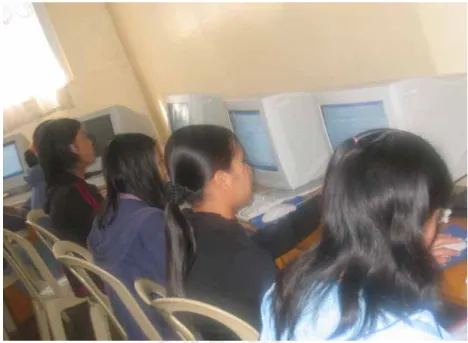
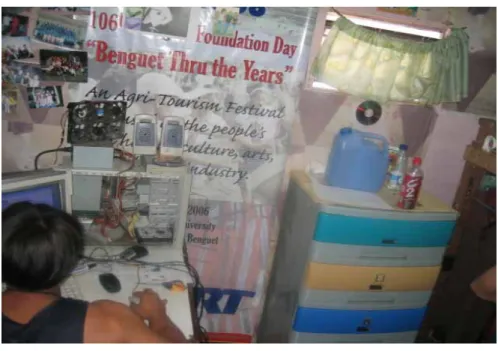
Educational Media Used by the Students
Figure 7. Student reading book in the library
Figure 9. Students surfing the net in the library
Figure 9. Students surfing the net in the computer laboratory (ICT) College of Agriculture
Figure 10. Student surfing the net in a computer shop
Figure 11. Student surfing the net in a boarding house
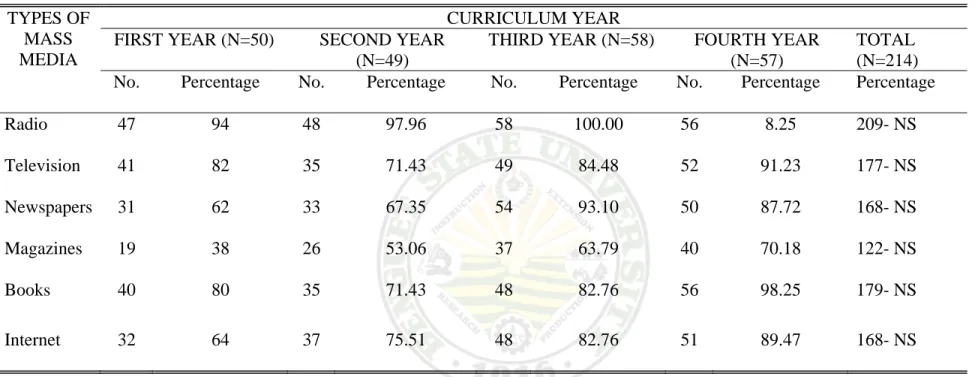
Types of Mass Media Used According to Curriculum Year
Table 6 presents the types of mass media used according to curriculum year. The radio still had the most number of users among all curriculum year levels. It is observed however that for fourth year students, both the radio and books ranked first (rank 1.5) in terms of number of users. Statistical analysis also indicates that the differences are not statistically significant.
Types of Mass Media Used According to Sex
The radio ranked first for both male and female respondents. For the female respondents, second was books followed by television then newspapers. For the males, second was internet followed by television then books. It is also noted that only the magazine had less than 50 percent users among males. All the other media were used by more than half of he respondents in both male and female groups (Table 7).
Table 5. Types of mass media used according to degree program TYPES OF
MASS MEDIA
DEGREE PROGRAM
BSA (N=40) BSAB (N=39) BSDC (N=35) BSAE (N=20) BEE (N=40) BSE (N=40) No. Percentage No. Percentage No. Percentage No. Percentage No. Percentage No. Percentage Radio 38 95 38 97.44 34 97.14 19 95 40 100 40 100 Television 28 70 32 82.05 33 94.29 18 90 32 80 34 85 Newspapers 25 62.5 31 79.49 33 94.29 17 85 31 77.5 31 77.5 Magazines 19 47.5 26 66.67 29 82.86 10 50 16 40 22 55 Books 30 75 29 74.36 34 97.14 18 90 33 82.2 35 87.5 Internet 27 67.5 29 74.36 35 100 18 90 32 80 27 67.5
* Multiple response
Pearson chi square (15) = 7.6850 Pr= 1.000
Table 6. Types of mass media used according to curriculum year TYPES OF
MASS MEDIA
CURRICULUM YEAR FIRST YEAR (N=50) SECOND YEAR
(N=49)
THIRD YEAR (N=58) FOURTH YEAR (N=57)
TOTAL (N=214)
No. Percentage No. Percentage No. Percentage No. Percentage Percentage Radio 47 94 48 97.96 58 100.00 56 8.25 209- NS
Television 41 82 35 71.43 49 84.48 52 91.23 177- NS Newspapers 31 62 33 67.35 54 93.10 50 87.72 168- NS Magazines 19 38 26 53.06 37 63.79 40 70.18 122- NS Books 40 80 35 71.43 48 82.76 56 98.25 179- NS
Internet 32 64 37 75.51 48 82.76 51 89.47 168- NS
* Multiple response
Pearson chi square (15) = 15.3657 Pr = 0.293 NS= No significance
Table 7. Types of mass media used according to sex TYPES OF
MASS MEDIA
SEX
MALE (N=104) FEMALE (N=110)
Number of respondents
Percentage Number of respondents
Percentage
Radio 103 99.03 106 96.36
Television 84 80.77 93 84.55
Newspapers 78 75.00 90 81.82
Magazine 48 46.15 74 67.27
Books 82 78.85 97 88.18 Internet 85 81.73 83 75.45
* Multiple response
Pearson chi square (5) = 4.3162 Pr = 0.505 No Significance
Types of Mass Media Used According to Age
The findings presented in Table 8 show that while there were slight differences, statistical analysis indicates that there was a homogenous distribution of respondents across the types of mass media used and across the two age brackets. This means that age did not affect the use of the different mass media among students. This is expected since the respondents were all college students who more or less belonged to one age bracket.
Types of Mass Media Used According to Living Arrangement
Table 9 presents the types of mass media used by students in different living arrangements. It shows that the number of users of each medium is higher among those who lives with their families in their own houses and those who lived with their families
Table 8. Types of mass media used according to age TYPES OF
MASS MEDIA
AGE
19 AND BELOW ( N=146) 20 AND ABOVE ( N=68) Number of
respondents
Percentage Number of respondents
Percentage
Radio 141 96.5 67 98.52
Television 119 82.50 57 83.82
Newspapers 109 74.65 59 86.76
Magazine 77 52.74 44 64.71
Books 113 11.40 66 97.06
Internet 107 73.29 60 88.24
* Multiple response Pearson chi square (5) = 1.9973 Pr = 0.850
in an apartment. The family is composed of the father, mother and siblings. Family members refer to sibling or a relative. The number of users of mass media among those living in boarding houses was lower. This implies that access to mass media was greater for those living with their families. It is observed though that the two dormitory residents used all the mass media. This is an indication that all mass media are accessible in the BSU dormitory.
Reasons for Using Broadcast Media and Print Media
Table 10 presents the reasons for using broadcast media (radio and television).
The leading reasons were: to be informed and to be entertained. These are also the Table
Table 9. Types of mass media according to living arrangement TYPES OF
MASS MEDIA
LIVING ARRANGEMENT WITH FAMILY
IN OWN HOUSE (N=85)
WITH FAMILY IN AN APARTMENT
(N=30)
WITH FAMILY MEMBERS IN A
BOARDING HOUSE
(N=75)
WITH FAMILY IN A BOARDING
HOUSE (N=14)
ALONE IN A BOARDING
HOUSE (N=8)
DORMITORY (N=2)
No. Percentage No .
Percentage No. Percentage No. Percentage No. Percentage No. Percentage Radio 85 100 30 100 71 94.67 14 100 7 85.50 2 100 Television 85 100 29 96.67 48 64.00 11 78.57 2 25.00 2 100 Newspapers 82 96.47 27 90 44 58.67 9 64.29 4 50.00 2 100 Magazines 63 74.12 18 60 27 36.00 9 64.29 3 35.50 2 100 Books 81 95.29 23 76.67 54 72.00 12 85.71 7 85.50 2 100 Internet 83 97.65 24 80 46 61.33 7 50 6 75.00 2 100
* Multiple response
Pearson chi square (25) = 13.77 Pr = 0.966
Table 10. Reasons for using broadcast media
REASONS BROADCAST MEDIA
RADIO ( N=209) TELEVISION ( N=177)
No. Percentage No. Percentage
To be entertained 128 61.24 120 67.80
To engage in a hobby
12 5.74 4 2.26
To be informed 136 65.07 144 81.36
To complete school requirements
2 .96 6 3.39
Available 2 .96
* Multiple response
Table 11. Reasons for using print media
REASONS PRINT MEDIA
NEWSPAPERS ( N=168) MAGAZINES ( N=122)
No. Percentage No. Percentage
To be entertained 44 26.19 36 29.51
To engage in a hobby 6 3.57 2 1.64
To be informed 98 58.33 66 54.10
To complete school requirements
4 2.38 4 3.28
* Multiple response
leading reasons for using printed media (newspapers and magazines) as shown in Table 11. These support the findings of Anno (2003) that the main reasons in using broadcast and print media were to be informed and to be entertained.
Reasons for Using Educational Media
Table 12 presents the reasons for using educational media. Books and internet were mostly used for the completion of school requirements and for information.
Table 12. Reasons for using educational media
REASONS EDUCATIONAL MEDIA
BOOKS ( N=179) INTERNET (N=168)
No. Percentage No. Percentage
To be entertained 16 8.94 14 8.33
To engage in a hobby 6 3.35 2 1.19
To be informed 76 42.46 82 48.81
To complete school requirements
84 46.93 86 51.19
* Multiple response
Kinds of Information Acquired from Broadcast Media
The information that the respondents acquired from mass media were divided into two (2) groups: general information and academic information (Table 13). General information includes politics, crimes, and others while academic information refers to those that are related to their courses in school. The leading topic was on politics. New songs or music got 18.69% on radio. Most of the respondents said that they wanted Pop, RNB but most of them preferred country music. On academic, agriculture was the most sought information.
This finding is similar to that of Siado (1982), where radio programs have
Table 13. Kinds of information acquired from broadcast media
BROADCAST MEDIA
INFORMATION RADIO (N=209) TELEVISION ( N=177)
No. Percentage No. Percentage
General Information
Crimes 26 12.44 46 25.99
Politics 44 21.05 50 28.25
Health 10 4.78 14 7.91
Showbiz 20 9.57 32 18.08
New songs/ music 40 19.14 5 2.82
Economic situation 26 12.44 13 7.34
Weather 16 7.66 37 20.90
Academic information
Agriculture 36 17.22 10 5.65
Teaching techniques 6 2.87 ___ ___
* Multiple Response
provided not only the students but also the community, a vital medium for information and self-development ranging from profitable farming techniques and wise utilization of agricultural and financial resources to nutrition and health guidance topics.
Kinds of Information Acquired from Print Media
Table 14 presents the kinds of information they acquired from print media. Most
Table 14. Kinds of information acquired from print media
PRINT MEDIA
INFORMATION NEWSPAPERS (N=168) MAGAZINES ( N=122)
No. Percentage No. Percentage
General Information
Crimes 23 13.69 ___ ___
Politics 24 14.29 ___ ___
Health 18 10.71 13 10.66
Economic situation 6 3.57 ___ ___
Showbiz 30 17.86 41 33.61
Sports 22 13.10 ___ ___
Jobs available 33 19.64 3 2.46
Academic information
Agriculture 4 2.38 ___ ___
* Multiple response
of the respondents were interested more in job ads. They said that because they were students, they looked for part time jobs while some graduating students looked for overseas work. Showbiz was ranked as the leading topic acquired from magazine. The respondents added that almost all that were featured in magazines were celebrities and business tycoons. For academic information, agriculture is still the leading information
acquired.
Kinds of Information Acquired from Educational Media
Table 15 shows the kinds of information acquired from educational media. For general information, the economic situation was the leading topic from reading books, while eighteen respondents surfing the net for God's word. For academic information, agriculture is still the most sought information.
Table 15. Kinds of information acquired from educational media
EDUCATIONAL MEDIA
INFORMATION BOOKS ( N=179) INTERNET ( N=168)
No. Percentage No. Percentage
General Information
Politics 4 2.23 6 3.57
Health ___ ___ 4 2.38
Showbiz ___ ___ 2 1.19
New songs/ music ___ ___ 8 4.76
Economic situation 14 7.82 6 3.57
God's Word 12 6.70 18 10.71
Academic information
Agriculture 38 21.22 6 3.57
Teaching techniques 8 4.47
* Multiple Response
Frequency of Using Broadcast Media
The frequency of using broadcast media is presented in Table 16. Most (71.49%) of the respondents listened to the radio and almost half watched television everyday. It shows that less than 50% of the respondents used broadcast media once a week or one a month.
Table 16. Frequency of using broadcast media
BROADCAST MEDIA
FREQUENCY RADIO (N=209) TELEVISION (N=177)
No. Percentage No. Percentage
Daily 153 73.21 93 52.54
Every other day 17 8.13 26 14.69
Once a week 39 18.66 49 27.68
Once a month 9 5.08
* Multiple response
Frequency of Using Print Media
Table 17 presents the frequency of using print media. More than one fourth of the respondents said that they used print media once a week. This was when they had assignments, got bored or just wanted to kill their time. Less than one fourth of the respondents said that they read daily. Those who do not read regularly said that reading makes them sleepy because they easily got bored.
Frequency of Using Educational Media
The frequency of using educational media are presented in Table 18. Of 214 respondents, 71 or 33.18% read books daily, while slightly more than half surf the net once a week. These were when they had an assignments or when they wanted to kill time.
This is similar to the study of Daplian (2005) where the respondents used the virtual library in the university once a week or once a month. Furthermore, Pongdad (2006) reported that students used internet occasionally or when the need arises.
Table 17. Frequency of using print media
PRINT MEDIA
FREQUENCY NEWSPAPERS (N=168) MAGAZINES ( N=122)
No. Percentage No. Percentage
Daily 27 16.07 3 2.46
Every other day 39 23.21 12 9.84
Once a week 60 35.71 45 36.88
Once a month 51 30.36 63 51.64
*Multiple response
Duration of Exposure to Broadcast Media
Table 19 presents the duration of exposure to broadcast media. A total of 63 or 29.44% of the respondents listened to the radio 1-2 hours while 33.64% watched television from 2-3 hours per viewing. They said that they spent more hours in listening or watching especially when they liked the songs, the story of the radio drama or movies.
Table 18. Frequency of using educational media
EDUCATIONAL MEDIA
FREQUENCY BOOKS ( N=179) INTERNET ( N=168)
No. Percentage No. Percentage
Daily 71 39.66 21 12.5
Every other day 34 18.99 12 7.14
Once a week 54 30.17 112 66.67
Once a month 15 8.38 9 5.36
*Multiple response
Table 19. Duration of exposure to broadcast media DURATION OF
EXPOSURE
BROADCAST MEDIA
RADIO (N=209) TELEVISION (n=177) No. Percentage No. Percentage
Less than 1 hour 39 18.66 19 10.73
1-2 hours 63 30.14 57 32.20
2:01-3 hours 59 20.23 72 40.68
3:01-4 hours 30 14.35 22 12.43
4:01-5 hours 3.95
*Multiple response
Duration of Exposure to Print Media
Table 20 presents the duration of exposure to print media. Majority of the respondents read newspapers and magazines for less than 1 hour in one sitting. They chose only the part of the print media which they were interested in because reading the whole newspapers and magazines was very tiring.
Table 20. Duration of exposure to print media DURATION OF
EXPOSURE
PRINT MEDIA
NEWSPAPERS ( N=168) MAGAZINES ( n=122)
No. Percentage No. Percentage
Less than 1 hour 118 70.24 78 63.93
1-2 hours 39 23.21 39 31.97
2:01-3 hours 10 5.95 3 2.46
3:01-4 hours 1 .60 2 1.64
*Multiple response
Duration of Exposure to Educational Media
The duration of exposure to educational media is presented in Table 21. For books, 73 or 40.78% read one to two hours because the respondents said that they are get sleepy when they read. Other's said that they read books just for the sake of quizzes and exams.
On internet, there were two respondents who spent five to six hours not only for the assignment but a combination of playing online games, and chatting with friends in one sitting.
Table 21. Duration of exposure from educational media DURATION OF
EXPOSURE
EDUCATIONAL MEDIA
BOOKS ( N=179) INTERNET ( N=168)
No. Percentage No. Percentage
Less than 1 hour 70 39.11 20 11.90
1-2 hours 73 40.78 94 55.95
2:01-3 hours 19 10.61 44 26.19
3:01-4 hours 10 5.59 8 4.76
4:01-5 hours 7 3.91 2 1.19
*Multiple response
This finding corroborates the findings of Pongdad (2006) that majority of the students spent one to two hours exploring the net.
Information Needs
The information needs by the respondents are presented in Table 22. It shows that 41 or 19.16% needed information on new inventions such as games in the computer, new agricultural.
Table 22. Information needs of the respondents
INFORMATION NUMBER OF
RESPONDENTS
PERCENTAGE General Information
Politics 18 8.41
Weather 17 7.94
Health 29 13.55
Crimes 21 9.81
Showbiz 13 6.07
Government programs 33 15.42
New inventions 41 19.16
Academic Information
Agriculture 43 20.09
Entrepreneurial venture 16 7.48
Historical events 5 2.34
Teaching techniques 11 5.14
SUMMARY, CONCLUSIONS AND RECOMMENDATIONS
Summary
The study on mass media habits of Benguet State University Students First Semester 2006-2007, was conducted to determine the characteristics of the respondents, to identify the mass media used by the BSU students, to determine their reasons for using a particular type of mass media, to determine the information they acquired from mass media, to determine the frequency and duration of exposure to mass media and to determine the information needs of BSU students.
Interview schedule was used to gather data. There were 214 respondents chosen using quota sampling, five males and five females from every year level of each course at the two biggest colleges in BSU: College of Agriculture (CA) and College of Teacher Education (CTE).
Most of the respondents belonged to the age range of 19 years old and below.
Slightly more than half were female and majority of them were single.
The respondents used mass media such as radio, television, newspapers, magazines, books and internet. Almost all of them listened to radio. To be informed and to be entertained were their reason in using broadcast and print media while they used educational media for school requirements.
Politics was the leading information that the respondents acquired from broadcast media; job ads and showbiz information for print media; and economic and religious information for educational media. For academic information, agriculture was the most sought after.
Three fourths of the respondents listened to the radio while almost half watched television everyday. More than one fourth of them read newspapers once a week. Books which includes English and Tagalog pocketbooks were read daily by 33.18% while the internet was used by more than half once a week.
Broadcast media were used for one to two hours and two to three hours for radio and television respectively. Because majority of the respondents said that print media made them sleepy, they read only for less than 1 hour. Others said that they read books one to two hours because of quizzes and exams.
New inventions led the respondents need for general information and more on agricultural development for academic information.
Conclusions
Based on the results, the following conclusions were derived:
1. Most of the students of BSU are single and within the age group of regular college students.
2. BSU students are multi-media users with the radio as he most commonly used medium.
3. BSU students use mass media for varied reasons: to be informed, to be entertained and to complete school requirements.
4. BSU students get varied information from mass media not only for academic requirements but also for general information.
5. Mass media are a part of the students’ daily lives.
Recommendations
Based on the conclusions, the following were recommended:
1. Teachers should design alternative learning activities to encourage more students to read more or to use mass media.
2. Mass media producers should continue airing, publishing, and posting more educational topics especially on agriculture and health information.
3. BU administration may use radio as a medium in disseminating information from the school concerning BSU students or BSU employees.
4. A study on the mass media habits of Benguet State University teachers should be conducted to determine the insights that may be used in maximizing the use of mass media in the teaching-learning process.
LITERATURE CITED
ABAG, M.T. 2005. Information Needs and Information Sources of the Residents of Barangay Tawangan and Lusod in Kabayan, Benguet. BS Thesis. BSU, La Trinidad, Benguet. Pp. 15-17.
ANNO, J.B. 2003. Listenership of Radyo Natin FM Buguias in Three Barangays in Mankayan Benguet. BS Thesis. BSU, La Trinidad Benguet. Pp. 8.
BANDURA, A.J.1960. Media Impact: Making Sense of Research and Effects. Stanford University. Pp. 382
BARAN H.G. 2003. Mass Communication, Culture and Mass Media. McGraw Hill Incorporation. Pp. 371.
BRAID, F.R. 1983. Development Issues: Constitutional Response. National Bookstore, Inc., Pp. 154-155.
DAPLIAN, E.I.2005. Virtual Library Usage Among Students of Benguet State University. BS Thesis. BSU, La Trinidad ,Benguet. Pp.13.
DAWIGUEY, A.G. 2004. Radio Program Preferences and Perceptions of listeners on Radyo ng Bayan-Bontoc, in five barangays in Bontoc, Mt. Province. BS Thesis.
BSU, La Trinidad Benguet. Pp. 21-24.
GRENBERG, B.S. Volume V 1993. An Introduction to the study of Communication.
Hompa and Row Publishers New York Francisco London. Copyright 1993. Pp.
493
HOVLAND, T.L. 1972. An Introduction to Mass Communication. Brooklyn State University. Pp. 184.
LOPEZ, S.M. 1996. Programs of Government-owned Radio Stations in the Cordillera Administrative Region. MS Thesis. BCF, Baguio City. Pp. 1-2,8.
PONGDAD, G.I. 2006. BSDC Students Perception towards online learning. BS Thesis.
BSU, La Trinidad Benguet. Pp. 18-22
SIADO, V.I. 1982. Radio as Information Sources of Vegetable Farmers in Isabela. BS Thesis. SLU, Baguio City. Pp. 12-14.
VERONIS. C.E. Media Impact. Making Sense of Research and Effects. Stanford University. Pp. 257-258.
WIKIPEDIA.2006.Wikipedia Foundation Incorporation.
http://en.wikipedia.org/wiki/Mass_media
INTERVIEW SCHEDULE Personal Information:
Respondents No._____________ Age:_____ Sex:_______ Civil Status:______________
Course:____________________ Year:____ Religion:______________________
Hobbies:________________________________________________________________
Father's Occupation:___________________ Mother's Occupation:__________________
Living Arrangement:__________ with family in own house __________ with family in a rental apartment __________ with family in a boarding house __________ alone in a boarding house
__________ dormitory
Where:__________________________________________________________________
What mass media are accessible to residence:___________________________________
Average budget for mass media per week:
___________ 50 and below ___________ 51-200 ___________ 201-400 ___________ 401-600
___________ Others pls. Specify Mass Media/ Types Check if
using
Kinds of Information Acquired
Reasons for using A. Radio
a. News
b. Commentaries c. Drama
d. Showbiz e. Talk show f. Music
e. others pls specify B. Television a. News
b. Documentaries c. Movies
d. Game Show e. Noon time show
Mass Media/ Types Check if using
Kinds of information Acquired
Reasons for Using television
f. Comedy show g. Soap opera C. Newspapers a. News
b. Classified ads c. Editorial d. Sports section e. Features f. Literary
g. Others pls specify D. Magazines
a. News
b. Cooking recipes c. Showbiz
d. Others pls specify E. Books
a. Agriculture b. Economics c. Communication process
d. Teaching techniques e. Others pls.
specify F. Internet
a. Educational research
b. Agriculture
c. Communication process
d. Teaching techniques
e. Others pls specify
2. How often have you used the mass media in the past three months?
Mass Media
Every other day
Once a week
Occasionally/
if needed
Once a month
Once a month
Others pls.
specify
Radio
Television
Newspaper
Magazine
Books
Internet
3. On the average, how long have you accessed the mass media in one sitting in the past three months?
Mass Media
Less than 1 hour
1-2 hours 2:01-3 hours
3:01-4 hours
4:01-5 hours
Others pls.
specify
Radio
Television
Newspaper
Magazine
Books
Internet
4. What information do you need?
________________________________________________________________________
________________________________________________________________________
________________________________________________________________________
________________________________________________________________________
________________________________________________________________________
________________________________________________________________________
________________________________________________________________________
________________________________________________________________________
________________________________________________________________________
________________________________________________________________________
________________________________________________________________________