BIBLIOGRAPHY
ATINYAO, GLADYS P. APRIL 2009. Cooperative Growth through the Credit Operation of Topdac Multi-Purpose Cooperative, Benguet State University, La Trinidad, Benguet.
Adviser: David Joseph L. Bognadon, MSc
ABSTRACT
The study was conducted to determine the growth that might have occurred the cooperative brought by the credit operation of the Topdac Multi-purpose Cooperative in 2003-2007 as to income, share capital and asset and to determine the level of patronage of members in the credit operation.
Financial documents were taken as the primary data used in the analysis of the study. The manager and some officers were also interviewed to validate some information from the financial data.
It was observed that in the credit operation, it has a minimal contribution to the total revenue compared to the consumer service, But in the later years there was a significant increase in the credit operation and this could be attributed to the interest on loans released and partly from the service fee and fines of past due loans and also from the increased share capital. In terms of asset, credit operation has a very significant contribution to the cooperative growth in 2007, due to increased loan releases and number of borrowers.
with the number of borrowers. This finding implies that there is an increasing demand for credit by the members.
TABLE OF CONTENTS
Page
Title Page…………...………... i
Abstract………… ………... i
Table of Contents ………... iii
INTRODUCTION………... 1
Rationale of the Study………... 1
Statement of the Problem……….. 2
Objectives of the Study………... 2
Importance of the Study……….…... 3
Scope and Limitation of the Study………... 3
REVIEW OF LITERATURE……… 4
Cooperative Define………... 4
Contribution of cooperative to Community Development………... 4
Cooperative Growth……….. 5
Credit Cooperative Define……… 7
Aims and Objectives of Credit Cooperatives……….... 7
Problems Encountered in Credit Affecting the Growth of Cooperatives……….. 8
Success Factors of Credit Cooperatives……….... 8
Locale and Time of Study………. 10
Respondents of the Study……….. 10
Data Collection………. 10
Data Analysis……… 10
Location Map……… 11
RESULTS AND DISCUSSION………... 12
History of Topdac Multi-Purpose Cooperative……….….. 12
Total Loans Released by the Cooperative………... 13
Contribution of the Credit Service to Total Revenue………... 15
Contribution of the Credit Service to Net Surplus……… 17
Contribution of Credit to Paid-up Share Capital……… 19
Contribution of the Credit Service to Total Asset……… 21
Total Liabilities of the cooperative………... 23
Total Receivables of the Cooperative... 25
SUMMARY, CONCLUSIONS AND RECOMMENDATIONS………. 27
Summary………..………... 27
Conclusions………... 28
Recommendations………... 29
LITERATURE CITED………... 30
APPENDICES……….. 32
A. Guide Questions………... 32
B. Comparative Financial Condition………... 33
C. Comparative Financial Operation………... 35
D. Cooperative Picture………. 37
INTRODUCTION
Rationale of the Study
Cooperatives are able to reach and benefit sectors of the population that would not normally be served by other private sector institutions or direct government programs.
The relatively permanent institutions created by cooperative development in the Third World provide an institutional framework through which other resources and programs can be channeled. The high premium placed on member participation in the operations and decision making of the cooperative promotes independence and self-reliance encouraging members to take an active role in their own development.
Cooperatives offer an attractive alternative to public sector programs. The paternalistic approach of governments and absence of competition provide little incentive to seek efficient methods of product or service delivery. A cooperative, because it is recipient owned, has an automatic incentive to maximize benefits to the members (Cooperative Development, 1985).
One successful cooperative in Atok, Benguet is the Topdac Multi-Purpose Cooperative and it was organized on 1980. A consumer service was opened with ninety (90) initial members. Later on new service was added like the credit service which opened on August 1999 with thirty-six (36) member depositors. It has 3 branches, one offering both consumer and credit while the other two offer consumer service.
As of December 2007, Topdac Multi purpose Cooperative accumulated a total asset of P 3,768,205.53 with 349 regular members and 140 associate members.
Through credit operation, the cooperative had been providing loans to its members, which also contributed to its progress and development. In this connection, this
2
study aims to look on how credit service patronage of members affects the growth of the cooperative.
Statement of the Problem
The main aim of this study was to look on how the credit service patronage of members affects the growth of the cooperative with the following questions;
1. What is the growth in credit operation from 2003-2007 as to a. Income
b. Share capital c. Asset
2. What is the level of patronage on credit services from 2003-2007 as to a. Number of borrowers
b. Amount of loan releases
3. What recommendations can be given for the improvement of the credit services?
Objectives of the Study
The specific objectives of this study were the following:
1. To determine the growth in credit operation from 2003-2007 as to a. Asset
b. Income c. Share capital
2. To determine the level of patronage on credit services from 2003-2007 as to a. Number of borrowers
b. Amount of loan releases
3. To suggest for the improvement of the credit services?
Importance of the Study
The result of the study will determine the growth of the cooperative as to the credit operation of the Topdac Multi-purpose Cooperative. The findings will serve as a guide for the officers and employees in decision making for the improvement of the cooperative especially in credit operation.
For students’, especially cooperative majors, this study would help them to gain knowledge about growth of cooperatives through credit operation and it would serve as reference for the further similar studies.
Scope and Limitation of the Study
This study focused on the growth of TMPC based on the credit operation. The analysis is limited in the 2003- 2007 financial report as basis in determining changes or growth of the cooperative.
4
REVIEW OF LITERATURE
Cooperatives are socially and environmentally sustainable enterprise based on the principle of caring for their members and communities where they operate. This makes them substantial contributions to achieving a coherent balance of growth, productivity, employment and concern for the environment (Henry, 2008).
Benguet Operators and Drivers Association Multi-purpose Cooperative (BODA- MPC) defined cooperative as:
C- Capitalized by members with common goal O- Owned by members
O- Operated by members P- Patronized by members
Marquez (2004) also defined cooperative as a voluntary association of at least 15 persons with common interest not capital. It begins with people who wish to provide themselves with good and services they need. Although capital or money is not the beginning of cooperative, it is the very life- blood of its successful operations. A cooperative must have adequate funds and these must be manage efficiently for the maximum benefits of its members and community. Much of the success of the cooperative depends on how its financial resources are used and allocated.
Contribution of Cooperative to Community Development
According to Zueli (2005), cooperatives have the potential to foster economic growth at the community and the regional level, building on the spirit of cooperation that is already prevalent in rural areas. With local ownership and control, and net profits
distributed to those who use its service, cooperatives are considered by some to be an ideal model for economic development. She also stated that cooperatives offer a way for a group of individual to pool unlimited resources to achieve critical mass and cooperative combine people, resources and capital into larger, more viable and economically competitive units.
Abella and Fajardo (1999) defined community development as a way for the people in a community to work together in order to build a better community and thereby improve the welfare of all. They organized themselves under the free will and work as a team to solve problems of their community. Both are concerned with the development of human resources and consider man as the most important factor of development.
A previous study at Topdac Multi purpose Cooperative by Marquez (2004) found that TMPC contributed an extensive service to the community in terms of health and economic.
Thus, the researcher recommends that there is a need to expand the contributions on economic aspect. Officers should find ways to increase their capital to cater more the needs of the members. There should be better cooperation among community people in helping their cooperative to succeed, encourage all members to patronize the cooperative and expand the space in order to sell agricultural products.
Cooperative Growth
“Growth does not always lead a business to success. All too often it converts a highly successful business into mediocre large business” (Richard Branson, 1950).
Growth is the process of expanding or developing, especially rapidly (Microsoft Encarta, 2006).
6
Ordinary least squares results that both diversification and advertising strategies are important determinants for Investor Owned Firms (IOF) growth, while the cooperative growth depends on the capital structure and intensity (Karantininis et al., 2002).
Lerman et al. (1993) also stated that cooperatives grow if they maintain their competitive posture and continue providing services to their members and for it to remain viable. In addition, it was stated that cooperatives need to grow to take advantage of a continuum of new technologies, new opportunities for the economies of size and increased efficiency.
Onagan et. al. (1973) also added that cooperation through cooperation of its principles and doctrine is actively dynamic. One of its inherent characteristics is growth.
It develops and expands to all directions until the whole world is merged to the system.
As a unit a cooperative increases in size to a point where all people in its trading area are absorbed. The cooperative system has its own remedies to accomplish this goal. Its services grow both in quantity and in quality commensurate the needs of members. By the operation of patronage refund and by their watchful guidance and encouragement given by their cooperative to improve their economic status, members find themselves actually and actively accumulating wealth as the years go by. This dynamic accumulation of wealth is the characteristics of the cooperative system; therefore, growth is characteristic of, and inherent to, cooperativism.
The Cooperative Management Manual by Cooperative Development Authority (CDA) stated that one big factor for cooperatives growth is the ability to campaign for
membership and develop them as new members to conform to the norms of cooperative organization.
Credit Cooperative Defined
Llanto (1994) stated that credit cooperatives are community based and grassroots financial institutions, which operate in both rural and urban areas, providing those communities with variety of financial services not otherwise available from the traditional lending institutions.
Abella et. al. (1999) mentioned that credit had been derived from the Latin word
“creditum” which means trust. If there is trust, there is credit. Trust can be exchange with money, goods or services. Thus, credit refers to the ability of an individual or institutions to acquire goods, money or services now in return for promise to pay at a definite time.
Aims and Objectives of Credit Cooperatives
According to Onagan et. al (1973), the aims and objectives of credit cooperative is to teach members to save regularly and continuously a portion of their income; to extend credit to members at low rate of interest and on terms ideally favorable and beneficial to members; to educate members in wise and productive use of money and to fully enlighten members on the true nature and aim of cooperation and make them realize that mutual action offers the most effective means of obtaining social and economic benefits.
8
Problems Encountered in Credit Affecting the Growth of Cooperatives
Patricio (2006) enumerated that the following factors affect the failure of Loo Consumers Cooperative Inc. such as: a) Negative influence of competitors b) High cost of maintaining assets c) Non- payment of loan/ credit d) lack of cooperative education e) Lack of cooperation in the cooperative
In addition, she found out that loan delinquency on payment of loan or credit mostly causes the cooperative failure.
Cawaon as cited by Todyog (2006) stated that the practice of requiring loan collateral for loaning is the protection of the investors for losses due to the failure of the business and bad faith of borrowers.
Credit cooperatives are faced with viability problem caused mainly by the delinquency on loan receivables. Loan capacity is impaired by such delinquency so that other possible beneficiaries lose opportunity to borrow and use loans as complements for sustaining capital.
Success Factor of Credit Cooperatives
The success of cooperatives rests on two important factors: strength and support of its members, and the efficiency and effectiveness of its management. (Saldo, 2005)
As cited by Abella et. al. (1999) based on the survey of successful credit operation in the Philippines, the following factors have been responsible for their success:
1. Continuous training and education of officers, members and employees.
2. Appropriate and adequate organizational structures to cope with the varying and increasing needs and problems of the cooperative members and the community.
3. Progressive and people- oriented policies on loans, savings, education, management and community development.
4. Presence of effective, honest and dedicated cooperative and community leaders.
5. Active involvement and participation of the officers and members in the affair of their cooperatives and the community.
6. Trust and confidence in cooperative officers.
7. Dependence on self- help process in achieving their programs and projects.
8. Wise selections of officers.
9. Spirit of cooperation and camaraderie prevails among the officers, members and employees of the cooperatives.
10. Efficient service for the promotion of social and economic advancement of the cooperative members.
11. Good public relations
12. Availability of competent and honest manager.
10
METHODOLOGY
Locale and Time of Study
The study was conducted in Topdac, Atok, Benguet where the Topdac Multi- purpose Cooperative is located. It was conducted from December to February 2009.
Respondents of the Study
The respondents of the study were the manager and credit committee of Topdac Multi-purpose Cooperative.
Data Collection
Financial documents were taken as a primary data used in the analysis of the study. The manager and some officers were also interviewed to validate some information from the financial data.
Data Analysis
The collected data was analyzed, tabulated and summarized according to the objectives of the study.
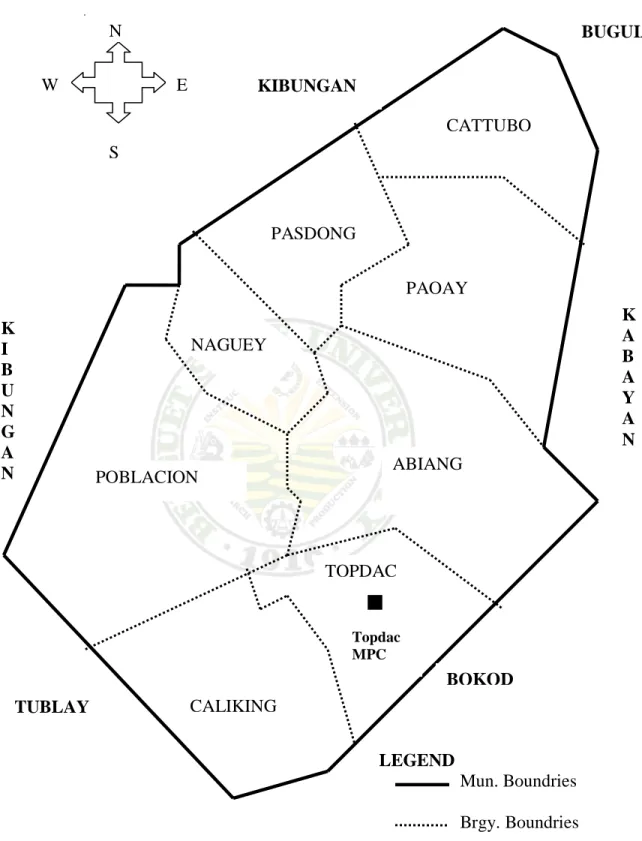
Figure 1. Map of Atok showing the location of Topdac Multi-Purpose cooperative PASDONG
CATTUBO
PAOAY
NAGUEY
ABIANG POBLACION
TOPDAC
Topdac MPC
CALIKING N
E W
S
LEGEND
Mun. Boundries Brgy. Boundries Area of Cooperative KIBUNGAN
BUGUIAS
K A B A Y A N
BOKOD TUBLAY
K I B U N G A N
12
RESULTS AND DISCUSSION
History of Topdac Multi-Purpose Cooperative
The organization of the Topdac-Multipurpose Cooperative was an offshoot of the agricultural skills training project of Dr. Carlos T. Buasen implemented in the place on September 1, 1978. The objective of this project was to train farmers to become entrepreneurs and self-reliant. The skill taught during the training was on mushroom production, poultry production and hog raising. In August 1979, ninety seven (97) farmer trainees were graduated from the training program.
While the farmers were undergoing the skills training, they were also oriented about cooperative by Mr. Robert A. Cayanos. In 1980, the cooperative was organized with the 90 farmers who graduated from the training became the pioneering members.
The cooperative started with only P7, 290.00 as initial capital. Of this amount, P5, 000.00 came from the proceed of the animal demonstration project while the P2, 290.00 was the initial share capital of the members. The cooperative started its initial operation on October 25, 1980.
To ensure the viability and proper management of the cooperative, Mr. Cayanos conducted continuous education on leadership and values formation, proper recording and others. The operation started with cash trading for one year. Since it cannot hire a store keeper, members volunteered and rotate as storekeepers for free. In the same manner, the board of directors and the committee members also rendered free services.
In February 23, 1983, the cooperative was registered as Topdac Consumers Cooperative, Inc.. It bought a parcel of land at Cadian and opened a new branch in the
same year. In that year also, Department of Trade and Industry (DTI) and Plan International donated P455, 735.00 for building construction at Pual and Cadian.
In August 9, 1993 the cooperative was registered at the Cooperative Development Authority and was renamed Topdac Multi-Purpose Cooperative which it carries until present. It was also in 1993 that the cooperative was affiliated with Northern Luzon Federation of Cooperative and Development Center (NORLU). Then in August 1999, the cooperative opened a credit service at Km.32, Topdac, Atok, Benguet.
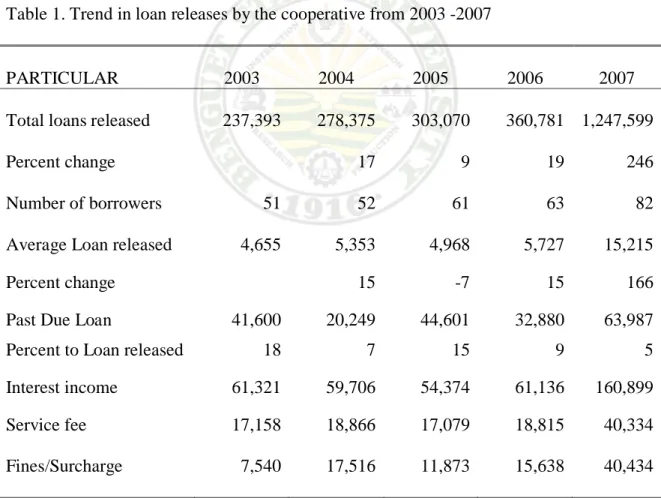
Total Loans Released by the Cooperative
The amount of loan released, number of borrowers, average loan released per borrower, amount of loan receivable, interest income, service fee, and fines/surcharge are presented in Table 1. It can be gleaned from the table that the amount of loan released had been increasing yearly from 2003 to 2007 and so with the number of borrowers. In fact, between 2006 and 2007 there was an increase in total loans released by 246%. The amount of loan released per borrower increased in 2004 from P4,655 to P5,353. In 2005 there was an increase in the amount of total loans released but the average amount released per borrower decreased by 7%. In 2006 average loan released increased by 15%
and in 2007 it increased by 166%. This finding implies that there is an increasing demand for credit by the members.
The trend in the past due loan was decreasing except in 2005 when past due increased to 15% of the total amount of loans released for that year. Fines or surcharge is imposed on past due loan and it can be figured out from the decreased collection of fines in 2005 that payment of past due loan was small thus it piled up in 2005.
14
Interest income and service fee are based on the amount loan released. It can be seen from the table that both are related to the amount of loan released. When the amount of loan released increased, the interest and service fee also increased. However, this was not true for 2005. There was an increase in the amount of loan released but there was a decrease in both the interest income and the service fee. One possible explanation for the interest income is that it is based on the actual interest paid by the borrowers. Notice that past due loan increased in 2005 thus it could explain the smaller interest income for the year. However, for the decrease in service fee collection, this could not be explained from the data obtained.
Table 1. Trend in loan releases by the cooperative from 2003 -2007
PARTICULAR 2003 2004 2005 2006 2007
Total loans released 237,393 278,375 303,070 360,781
1,247,599
Percent change 17 9 19 246
Number of borrowers 51 52 61 63
82
Average Loan released 4,655 5,353 4,968 5,727
15,215
Percent change 15 -7 15 166
Past Due Loan 41,600 20,249 44,601 32,880 63,987
Percent to Loan released 18 7 15 9 5
Interest income 61,321 59,706 54,374 61,136 160,899
Service fee 17,158 18,866 17,079 18,815 40,334
Fines/Surcharge 7,540 17,516 11,873 15,638 40,434
Source: Financial reports of the cooperative
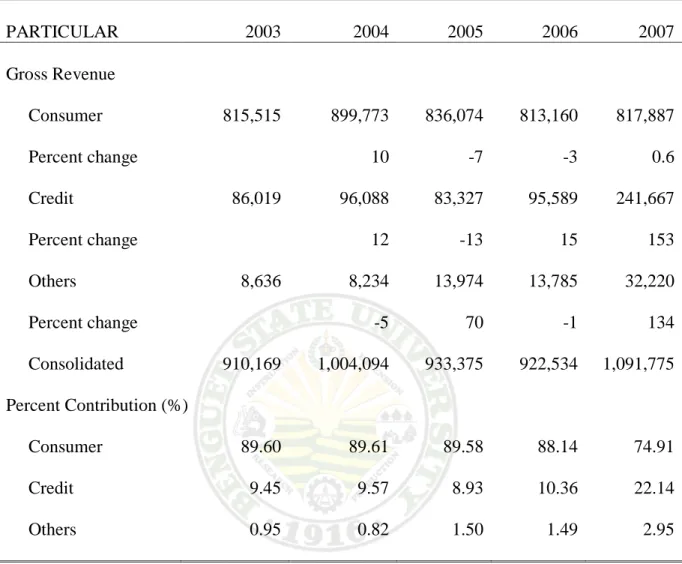
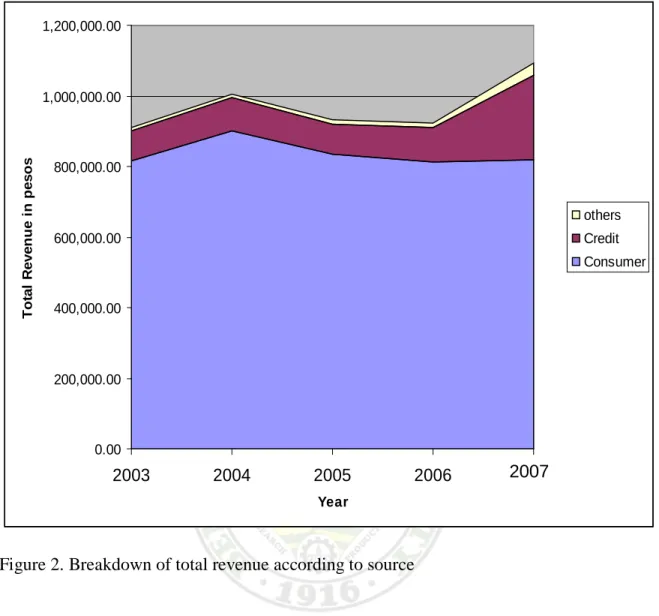
Contribution of the Credit Service to Total Revenue of the Cooperative
The revenue of the cooperative comes from two sources: the consumer service, the main source, and the credit service which is the secondary source.
As presented in Table 2 and Figure 2, it was observed that there was a continuous increase in total revenue from 2004 up to 2007 except in 2005 that total revenue decreased. This is due to the temporary closure of Pual Branch during the year. In 2007, the officers implemented a new management strategy like Capital Build-up, Savings mobilization, conduct of seminars for the members and expansion of credit service that lead to the cooperative’s increased revenue. The result of the analysis showed that the contribution of the credit operation had gradually increased from its initial operation in 2003 to 2006. In 2007, its contribution to the total revenue of the cooperative substantially increased. Its contribution increased from only 9.45% in 2003 to 22.14% in 2007 while the contribution of the consumer section is 89.60% in 2003 to 74.91% in 2007.
It was observed that the increase in credit operations income was the effect of the increased in the number of borrowers and increase in amount of loan per borrower as found earlier.
It was observed that in credit operation, it has a minimal contribution to the total revenue compared to the consumer service but in latest years there was a significant increase in credit operation and this could be attributed from the interest on loans released and partly from the service fee and fines of past due loans.
16
Table 2. Gross revenue of the cooperative from the credit and the consumer operations from 2003 – 2007
PARTICULAR 2003 2004 2005 2006 2007
Gross Revenue
Consumer 815,515 899,773 836,074 813,160 817,887
Percent change 10 -7 -3 0.6
Credit 86,019 96,088 83,327 95,589 241,667
Percent change 12 -13 15 153
Others 8,636 8,234 13,974 13,785 32,220
Percent change -5 70 -1 134
Consolidated 910,169 1,004,094 933,375 922,534
1,091,775 Percent Contribution (%)
Consumer
89.60
89.61
89.58 88.14
74.91 Credit
9.45
9.57
8.93 10.36
22.14 Others
0.95
0.82
1.50
1.49
2.95
0.00 200,000.00 400,000.00 600,000.00 800,000.00 1,000,000.00 1,200,000.00
2003 2004 2005 2006
Year
Total Revenue in pesos
others Credit Consumer
Figure 2. Breakdown of total revenue according to source
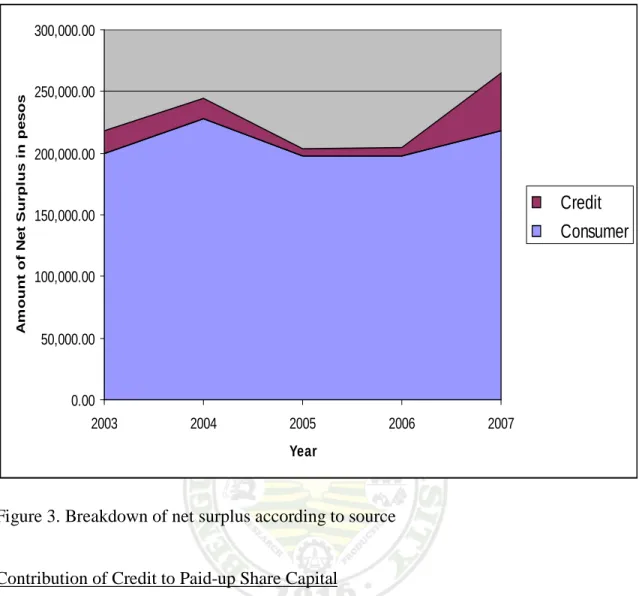
Contribution of the Credit Service to Net Surplus
Table 3 and Figure 3 show the net surplus of Topdac Multi-Purpose from 2003 to 2007 including the percent contribution of the credit and the consumer sections. It is observed that the total net surplus of the cooperative had been increasing every year except in 2005 because of the decline in total revenue as presented earlier. However, in 2006 this picked up a little then increased by about 29% in 2007. It can be seen from the table that the net surplus of the consumer section decreased a little in 2006 but was offset by an increase in the net surplus of the credit section. The higher increment in 2007 was due to an increase in the net surplus from both sections. Much of the increase however
2007
18
was contributed by the credit section. Net surplus of the credit section in 2007 was 531%
while that of the consumer was 11%. The analysis further shows that the contribution of the consumer section to net surplus of the cooperative decreased from 2003 to 2007 while that of the credit increased.
This finding implies that the contribution of the credit service to the overall performance of the cooperative is becoming more significant.
Table 3. Net surplus of the cooperative from 2003 – 2007
PARTICULAR 2003 2004 2005 2006 2007
Net Surplus
Consumer 199,333 227,739 197,891 197,357 218,392
Percent change (%) 14 -13.11 -0.27 11
Credit 19,176 16,882 5,673 7,355 46,425
Percent change (%) -12 -66 30 531
Consolidated 218,509 244,620 203,564 204,713 264,817
Percent change (%) 12 -17 0.56 29
Percent Contribution Consumer
91.22
93.10
97.21
96.41
82.47 Credit
8.78
6.90
2.79
3.59
17.53 Consolidated 100
100
100
100
100
0.00 50,000.00 100,000.00 150,000.00 200,000.00 250,000.00 300,000.00
2003 2004 2005 2006 2007
Year
Amount of Net Surplus in pesos
Credit Consumer
Figure 3. Breakdown of net surplus according to source
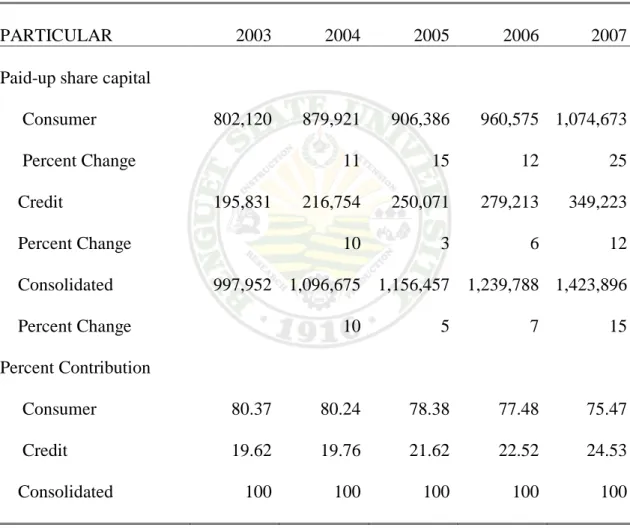
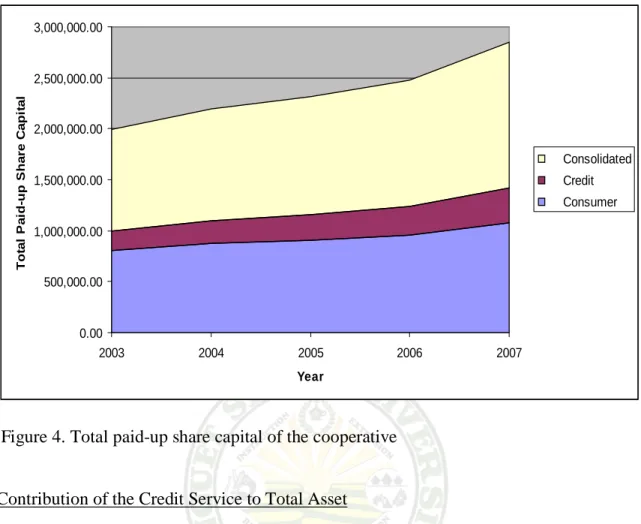
Contribution of Credit to Paid-up Share Capital
Table 4 and Figure 4 present the trend in the total paid up share capital of members from 2003 up to 2007 for the whole cooperative as well as the share capital in the consumer and the credit sections. The total share capital had been increasing continuously from 2003 to 2007. There was a decline in the growth rate in 2005 from about 10% in 2004 to only about 5% in 2005. Although there was an increase in the growth rate in the consumers section from about 11% to 15% this was negated by the decline in growth rate of the credit section from 10% to only 3%. The opposite happened in 2006. There was a slight decline in the growth rate in the consumers section but this was more than offset by an increase in the credit section thus, the overall growth rate
20
increased a little. It is the rule in the cooperative that every time a member avail the credit service, he/she must add to share capital in order for them to avail the said service.
As presented in Table 1, the loans released increased from 17% in 2003 to 246% in 2007 and so with the number of borrowers and this is the factor why the share capital increased.
Table 4. Paid-up share capital of members from 2003 – 2007
PARTICULAR 2003
2004
2005 2006 2007
Paid-up share capital
Consumer 802,120
879,921
906,386
960,575
1,074,673 Percent Change 11 15 12 25
Credit
195,831
216,754
250,071
279,213
349,223 Percent Change
10 3 6 12
Consolidated
997,952 1,096,675 1,156,457 1,239,788
1,423,896 Percent Change
10 5 7 15 Percent Contribution
Consumer
80.37
80.24
78.38
77.48
75.47
Credit 19.62
19.76
21.62
22.52
24.53
Consolidated
100
100
100
100
100
Source of data: Financial report of the cooperative
0.00 500,000.00 1,000,000.00 1,500,000.00 2,000,000.00 2,500,000.00 3,000,000.00
2003 2004 2005 2006 2007
Year
Total Paid-up Share Capital
Consolidated Credit Consumer
Figure 4. Total paid-up share capital of the cooperative
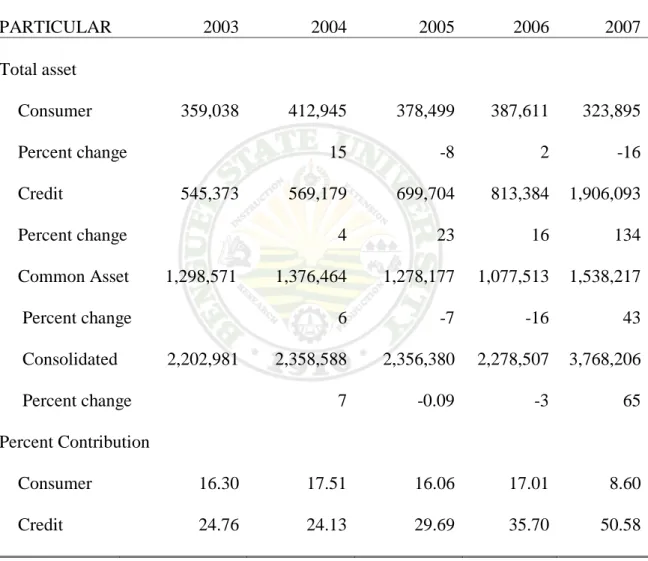
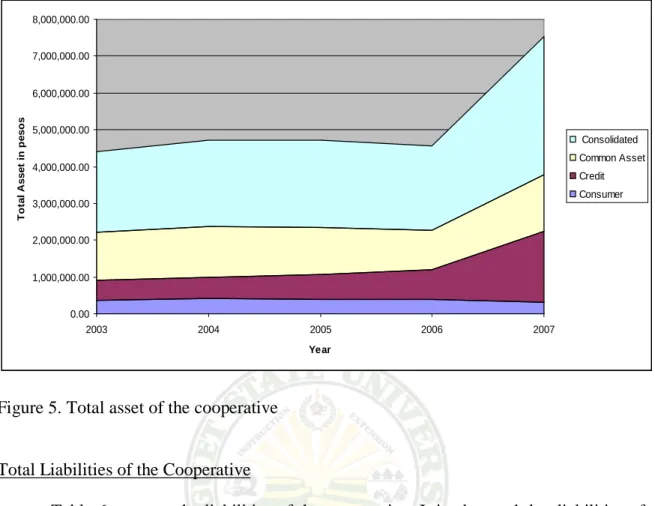
Contribution of the Credit Service to Total Asset
Table 5 and Figure 5 show the growth of the cooperative’s total asset from 2003- 2007. The data shows that asset increased by 7% from 2003 to 2004 but a very slight decrease was observed in 2005 due to the decreased in merchandise inventory of the consumer section. These were the merchandise spoiled during the strong typhoon. The total asset of the credit section, however, increased by 23% during that year. In 2006, there was again a decrease in the total asset of the cooperative due to the decrease in the value of the building. The store building in Pual that was destroyed during the typhoon in 2005 was declared condemned in 2006 but for the credit section its asset increased by 16%. In 2007, the asset of the credit section increased by 134% due to the loan acquired from Land Bank of the Philippines. This money was given out as loans to members. This also contributed to an increase in the total asset of the cooperative. As observed from the
22
table, total asset of the cooperative increased by 65% in 2007 due to the increase in asset of the credit section and the increase in the common asset. The common asset refers to the assets that are not classified as asset in credit or in consumer like the properties and equipments of the cooperative.
Table 5. Total asset of the cooperative from 2003 – 2007
PARTICULAR 2003 2004 2005 2006 2007
Total asset
Consumer 359,038 412,945 378,499 387,611
323,895
Percent change 15 -8 2 -16
Credit 545,373 569,179 699,704 813,384 1,906,093
Percent change 4 23 16 134
Common Asset 1,298,571 1,376,464 1,278,177 1,077,513 1,538,217
Percent change 6 -7 -16 43
Consolidated 2,202,981 2,358,588 2,356,380 2,278,507 3,768,206
Percent change 7 -0.09 -3 65
Percent Contribution
Consumer 16.30 17.51 16.06 17.01 8.60
Credit 24.76 24.13 29.69 35.70 50.58
0.00 1,000,000.00 2,000,000.00 3,000,000.00 4,000,000.00 5,000,000.00 6,000,000.00 7,000,000.00 8,000,000.00
2003 2004 2005 2006 2007
Year
Total Asset in pesos
Consolidated Common Asset Credit Consumer
Figure 5. Total asset of the cooperative
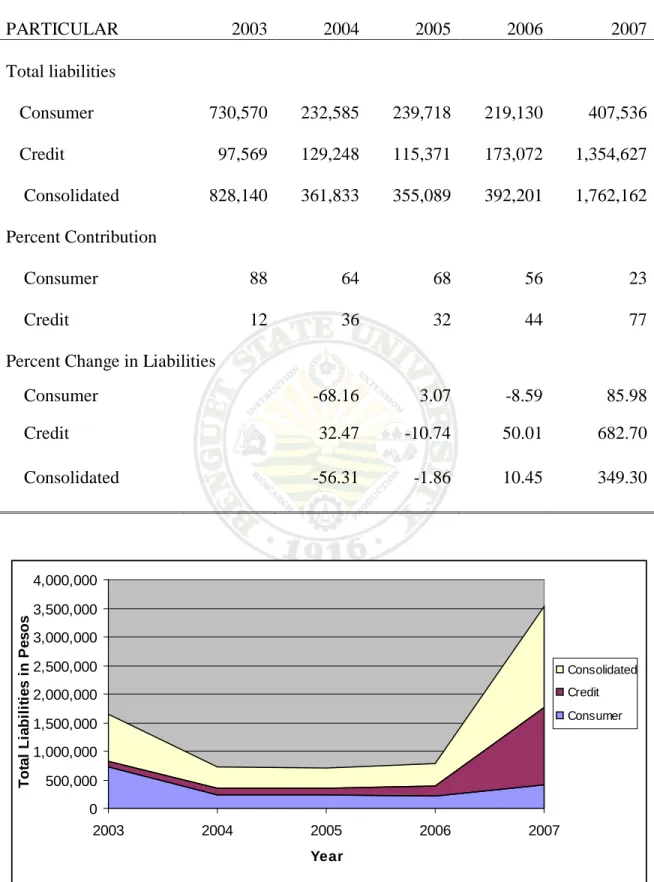
Total Liabilities of the Cooperative
Table 6 presents the liabilities of the cooperative. It is observed that liabilities of the credit section had been increasing yearly. The highest increment occurred in 2007 because of the loan from Land Bank as stated earlier. This was also due to an increment in the savings deposit of members. It was observed that credit has the highest liability in 2007. The increase in total liability of the credit also contributed to an increase in the total receivables thus, it helps in the operation of credit service that caused the growth in credit income and in total assets in 2007. While the total liability of the credit section had been increase, total liability of the consumer section experienced a decreasing trend.
Credit service has a very high contribution to total liabilities but it help in generating a high income and increase in asset in year 2007.
24
Table 6. Total liabilities of the cooperative from 2003 - 2007
PARTICULAR 2003 2004 2005 2006 2007
Total liabilities
Consumer
730,570
232,585
239,718
219,130 407,536
Credit
97,569
129,248
115,371
173,072 1,354,627
Consolidated
828,140
361,833
355,089
392,201 1,762,162 Percent Contribution
Consumer 88 64 68 56 23
Credit 12 36 32 44 77 Percent Change in Liabilities
Consumer -68.16 3.07 -8.59 85.98
Credit 32.47 -10.74 50.01 682.70
Consolidated -56.31 -1.86 10.45 349.30
0 500,000 1,000,000 1,500,000 2,000,000 2,500,000 3,000,000 3,500,000 4,000,000
2003 2004 2005 2006 2007
Year
Total Liabilities in Pesos
Consolidated Credit Consumer
Figure 6. Total liabilities of the cooperative
Total Receivables of the Cooperative
Table 7 and Figure 6 present the trend in total receivables of the cooperative and the proportion of the receivable that is past due. It is observed that total receivables continuously increased in both the consumer section and the credit section. Furthermore, it is presented that total loans receivable (credit) had increased tremendously between 2006 and 2007 (233%). This connotes that demand for loan by members had been increasing through the years. The trend for account receivable in the consumer section had been increasing through the years also. The implication is that sales on credit had been increasing from 2003 to 2007. Relating this to the past due, it can be gleaned that the total past due from the consumer section had been increasing yearly. This was the same for the credit section. Credit service has a significant contribution in total receivables, it was derived from the loans released and past dues.
Table 7. Total receivables and past due from 2003 to 2007
PARTICULAR 2003 2004 2005 2006 2007
Total receivables
Consumer 370,476 391,265 438,889 507,360 550,532
Percent change 6 12 16 9
Credit 278,993 298,624 347,671 393,661 1,311,586
Percent change 7 16 13 233
Consolidated 649,469 689,889 786,560 901,021 1,862,118
Percent change 6 14 15 107
26
Table 7. Continued…
PARTICULAR 2003 2004 2005 2006 2007
Past Due
Consumer 148,623 196,926 126,404 150,596 141,031
% to Receivable 40 50 29 30 26
Credit
41,600.00
20,249.10
44,600.96
32,879.96
63,986.86
% to Receivable 15 7 13 8 5
Consolidated
190,222.80
217,175.53
171,004.69
183,475.66
205,018.16
% to Receivable 41 46 28 26 13
SUMMARY, CONCLUSIONS AND RECOMMENDATIONS
Summary
This study was conducted at Topdac Multi-purpose Cooperative, Km.32, Topdac, Atok, Benguet in order to determine the growth in the cooperative brought by the credit operations to asset, income and revenue and to determine the level of patronage on credit services as to no of borrowers and amount of loan released occurred within year 2003- 2007.
Financial documents were taken as a primary data used in the analysis of the study. The manager and the officers were also interviewed to validate some information from the financial data. The collected data was analyzed, tabulated and summarized according to the objectives of the study.
It was found out that the growth in asset increased for 7% in 2003 to 2004 but it decreased in 2005 to 2006 because of calamity that affects the one branch of the cooperative and its operation was temporarily stopped. In 2007, the asset increased for 65%. For the growth in credit operation income, it was observed that there was a continuous increase from 2003 up to 2007. From 2006-2007, the contribution of credit was higher compared to the previous past 2 years. In 2007, 22.14% of the gross revenue came from credit service while 74.91% came from the consumer service. Said growth could be attributed to the new management strategies of the officers and employees like capital build-up implementation, savings mobilization, conduct of seminars for members and expansion of credit service. For the credit operation, the members’ paid up share capital increased from 19.62% in 2003 to 24.53% in 2007. Share capital affects the
28
growth of credit income because every time the member avail the credit service they must add first their share capital.
The amount of loan released had been increasing yearly from 2003 to 2007 and so with the number of borrowers. In fact, between 2006 and 2007 there was an increase in total loans released by 246%. The amount of loan released per borrower increased in 2004 from P4,655 to P5,353. In 2005 there was an increase in the amount of total loans released but the average amount released per borrower decreased by 7%. In 2006 average loan released increased by 15% and in 2007 it increased by 166%. This finding implies that there is an increasing demand for credit by the members.
Conclusions
Based from the findings of the study the following conclusions were made
1. The increase of asset could be attributed to the increase in revenue of credit and consumer service.
2. The increase in credit income was the effect of the increased in the number of borrowers and increase in amount of loan per borrower.
3. As the number of borrowers increase, the amount of loan released also increases, this implies there is an increasing demand for credit by the members.
4. As number of borrowers increase, the share capital contributions of members in the cooperative also increase.
5. New management strategies like capital build-up implementation, savings mobilization, conduct of seminars for members and expansion of credit service improves the performance of the cooperative and the members.
6. Member’s participation was observed especially in year 2007 and it affects the growth of the cooperative.
7. The past due loan was decreasing except in 2005 when past due increased to 15% of the total amount of loans released for that year. Fines or surcharge is imposed on past due loan and it can be figured out from the decreased collection of fines in 2005 that payment of past due loan was small thus it piled up in 2005.
Recommendations
The following are recommended:
1. Topdac Multi-purpose Cooperative should continue its operation and services;
expand more projects for the benefit of their members and the community which also contributes to its growth and success.
2. Officers should encourage more members of the cooperative to patronize the credit service.
3. The cooperative should continue the capital build- up scheme for the increase in share capital contribution.
4. The cooperative should regularly conduct training on cooperative management for more effective and efficient performance of management staffs.
5. The cooperative should buy a computer that helps in the efficiency and effectively in credit operation like making the financial statements and so with the consumer for inventory system.
30
LITERATURE CITED
ABELLA F., FAJARDO F., FELICIANO R. and FABIAN P.. 1999. Cooperatives.
Fourth edition. Rex Printing Company, Inc. Quezon City. Pp. 129-130, 237
BODA-MPC. 2008. Manual for Pre-membership Seminar for BODA-MPC Membership.
Pp.1
CDA-JICA Project Office. ND. Cooperative Management Manual. Pp. 24
COOPERATIVE DEVELOPMENT, 1985. USAID: Cooperative Development
.
www.usaid.gov/policy/ads/200/coopdev/index.html. Accessed on February 29, 2009HENRY, H. 2008. Cooperatives. http:// www.ilo.org/Global/about_the_ilo media_ and _public information/ featured stories/ lang__en/ wems_095980/ index.htm.
Accessed on September 20, 2008
KARANTININIS K.,OUSTAPASSIDIS K. and VLACHVEI K.2002. Growth of investor owned and Cooperative firms in Greek Diary Industry.
http://www3.interscience.wiley.com/journal/119137085/abstract. Accessed on September 20, 2008
LERMAN, Z. and PARLIAMENT, C. 1993.Financing Growth in Agricultural Cooperatives.http://www.cababstractsplus.org/abstracts/Abstract.aspx?AcNo=199 41803593. Accesed on September 20, 2008
LLANTO, G.1994. The Financial Structure and Performance of Philippine Credit Operation. www3.pids.gov.ph/ris/dps/pidsdps 9404 pdf. Accessed on September 4, 2008
MARQUEZ, C.2004. Contribution of Topdac Multi-Purpose Cooperative to Community Development.BS Thesis Easter College, Guisad, Baguio City.Pp.17
MICROSOFT ENCARTA. 2006. Definition of growth. Accessed on September 1,2008
ONAGAN, L.D., J.T.SIMANGAN and ESGUERRA M.S. 1973. Cooperative Principles and Practices. L.D. Onagan and Sons Publishers Co. Quezon
City.Pp.314
PATRICIO, ML.2006. Lessons in Failure: A Case Study of Loo Consumers Cooperative in Buguias, Benguet. BS Thesis. Benguet State University, La Trinidad, Benguet.
Pp.20-21
SALDO, A.C. 2005. Profile of Non- operating Cooperatives in Baguilin, La Union. BS Thesis. Benguet State University, La Trinidad, Benguet. Pp.1
TODYOG, K.2006. Credit Operation of La Trinidad Vegetable Multi-purpose Cooperative. BS Thesis. Benguet State University, La Trinidad, Benguet.Pp.6-7 ZUELI, K. 2002. The Role of Cooperatives to Community Development.
www.wisc.edu/uwcc. Accessed on September 13, 2008
32
APPENDIX A
GUIDE QUESTIONS-OFFICERS
1. What is the growth in credit operation from 2003-2007 as to
• Asset
• Income
• Share capital
2. What is the level of patronage on credit services from 2003-2007 as to
• Number of borrowers
• Amount of loan releases
APPENDIX B
Comparative Financial Condition December 31, 2003-2007
2003 2004 2005 2006 2007
Current asset
Cash on Hand 292,445.17 286,083.81 284,121.46 150,768.10 223,322.11 Cash on Bank 168,145.45 138,809.78 134,143.82 244,924.21 467,165.23
Petty cash Fund 1,000.00 1,000.00 1,000.00 1,000.00 2,500.00
Accounts/Loans Receivable
Current 459,246.49 472,713.45 615,554.96 717,545.07 1,657,100.35 Past Due 190,222.80 217,175.53 171,004.69 183,475.66 205,018.16 Allowance for
probable Losses on
Receivables (48,413.47) (54,928.73) (48,624.52) (48,624.52) (45,822.79) Cash advances to
officers & employees 25,590.90 25,590.90 Unused office/store
supplies 32,164.53 35,123.27 30,431.21 42,767.23 1,740.10
Prepaid expenses 2,134.40 1,363.78 1,852.10 1,740.10 41,661.76 Merchandise
Inventory 326,873.62 377,821.83 348,068.25 344,843.33 282,233.60 Total Current Asset 1,449,409.89 1,500,753.62 1,537,551.97 1,638,439.18 2,834,918.52
Investment 30,686.87 40,686.87 44,000.00 56,000.00 64,000.00
Properties &
Equipment
Land 110,725.25 110,725.25 110,725.25 110,725.25 157,395.75
Building 707,427.00 620,627.61 620,627.61 432,817.63 619,481.43 Accumulated
Depreciation (155,794.83) (38,481.09) (59,313.57) (49,405.65) (59,052.84) Building
Improvement 9,434.50 9,684.50 9,684.50 9,684.50 9,684.50
Office/Store
Equipment 4,460.88 57,970.53 60,562.53 64,405.53 64,524.79
Accumulated
Depreciation (3,902.09) (717.95) (21,347.63) (41,961.47) (62,575.31) Furniture and Fixture 26,770.00 24,272.24 24,272.24 24,272.24 38,534.91 Accumulated
Depreciation (8,566.56) (17,133.12) (25,699.68)
Total Properties &
Equipment 699,120.71 784,081.09 736,644.37 533,404.91 742,293.55 Other Assets
Deposits on Returnable
Containers 20650.43 26071.93 31,189.43 34,769.43 34,927.43
Kitchenware’s 3113.46 5644.46 5,644.46 5,793.46 8,297.46
Due from Branches 74,600.00
Miscellaneous 1,350.00 1,350.00 10,100.00 9,805.47
Other funds and
Depreciation 73,963.10
34
Total Other Assets 23,763.89 33,066.39 38,183.89 50,662.89 126,993.46 Total Assets
Liabilities
Loans Payable 712,990.00
Due to Apex 13,501.33 12,231.01 10,579.66 10,235.65 13,240.85
Due to Main 13,240.85
Savings Deposit 70,312.45 103,063.23 96,226.68 154,237.11 585,161.98 Unearned Income 10,890.20 13,524.00 14,889.60 13,318.00 21,656.00 Dividend &
Patronage Refund
Payable 152,956.44 171,234.13 142,494.53 143,299.04 185,371.88 Total Current
Liabilities 247,660.42 300,052.37 264,190.47 321,089.80 1,518,420.71 Loan Term
Retirement Fund
Payable 17,995.46 5,143.20 4,506.17 4,506.17
Total Long Term
Payable 17,995.46 5,143.20 4,506.17 4,506.17
Mutual Benefit Fund
Payable 34,479.43 43,785.50 85,755.50 66,605.50 239,235.38
Deposit for Share Capital Subscription
Total Other
Liabilities 34,479.43 43,785.50 85,755.50 66,605.50 239,235.38 Total Liabilities 282,139.85 361,833.33 355,089.17 392,201.47 1,762,162.26 Equity
Common Share- Authorized Share Capital 92085 @ 100 Par Value
Paid-Up Share
Capital 997,951.75 1,096,674.87 1,156,456.68 1,239,788.12 1,423,895.91 Total Members
Equity 997,951.75 1,096,674.87 1,156,456.68 1,239,788.12 1,423,895.91 Donation & Grants 570,942.65 569.237.12 507,830.26 290,416.85 242,180.75 Statutory Funds
General Reserved
Fund 178,815.77 157515.86 145,967.01 166,209.95 192,897.12
Education and Training Fund
(Local) 13,843.30 18,284.25 22,675.86 20,409.69 26,482.39
Optional Fund
(building) 159,288.04 155,042.55 168,361.25 169,480.91 120,587.11 Total Statutory
Funds 351,947.11 330,842.66 337,004.12 356,100.55 339,966.62
Total Liabilities &
Members Equity 2,202,981.36 2,358,587.97 2,356,380.23 2,278,506.98 3,768,205.53
APPENDIX C
Comparative Financial Operation December 31, 2003-2007
Revenue 2003 2004 2005 2006 2007
Gross Profit from
sales 815,514.83 899,772.88 836,073.89 813,160.21 817,887.01 Interest Income from
Loans 61,320.61 59,706.20 54,373.90 61,136.10 160,899.49 Service Fee 17,158.47 18,866.00 17,079.00 18,814.50 40,333.62 Fines/Surcharges 7,539.78 17,515.50 11,873.70 15,637.90 40,434.27 Membership Fee 1,300.00 1,600.00 1,400.00 1,400.00 3,500.00 Income/Interest from
Investment 874.37 912.11 7,201.64 4,553.64 7,186.49 Miscellaneous 6,461.30 5,721.50 5,372.50 7,831.75 21,533.76 Total revenue 910,169.36 1,004,094.19 933,374.63 922,534.10 1,091,774.64 Expenses
Financial Cost
Interest on Savings 5,080.14 7,937.71 4,137.80 5,038.88 12,079.50 Interest Expense on
Borrowings 32,932.72
Total Financial Cost 5,080.14 7,937.71 4,137.80 5,038.88 45,012.22 Administrative Cost
Salaries & wages 255,137.40 333,633.16 297,945.60 332,126.30 329,836.60 Employee Benefits 26,978.80 31,278.00 26,957.00 35,097.63 44,844.59 SSS,ECC, Phil.
Health 20,950.70 25,768.75 25,371.50 21,935.80 28,235.40 Honorarium 155,508.26 108,695.00
Retirement Benefit 15,765.00 17,995.46 3,880.24
Light,Power & Water 7,231.69 11,763.92 44,607.22 31,281.39 32,235.66 Travel and
Transportation 31,499.80 27,907.00 120,227.67 116,804.52 177,283.43
Bank Charges 1,483.00
Rental 2,300.00 2,400.00 1,800.00 Repair and
Maintenance 1,869.75 4,261.30 1,147.00 35.50 Office and store
supplies
45,765.30 64,664.62
51,220.13 44,414.39
55,614.50 Taxes and Licenses 6,185.75 7,067.52 6,552.00 8,535.00 8,592.00 Depreciation and
Amortization 21,487.76 14,442.01 Meeting and
Conference 10,789.49 16,583.67 51,782.43 35,173.85 37,541.90 Representation 2,271.95 408.08 2,509.66 736.40 442.95 Communication 6,545.25 10,401.30 14,410.80 11,514.50 18,228.60 Insurance 3,658.90 3,108.50 2,289.78 2,722.10 2,610.10 Spoilage and
Breakage 2,434.57 2,408.08 2,442.89 2,923.19 3,956.88
36
General Assembly
Expense 33,753.91 45,975.00 29,000.00 25,100.00 24,040.75
Members Benefit 32,000.00 27,389.00
Collection 3,183.25 322.00 398.00
Affiliation Fees 2,600.00 600.00 400.00 650.25 500.00 Education and
Training 9,236.83 2,494.92 600.00 4,031.74 1,200.00 Provision for
probable Losses 7,463.63 6,515.26 Miscellaneous
Expense 5,195.12 8,484.75 3,964.55 4,684.75 6,201.01 Social Service
Expense 11,946.16 4,680.00 3,381.50 7,304.00 7,825.00 Total
Administrative Cost 686,576.02 751,536.30 725,673.22 712,782.31 781,945.45 Total Expenses 691,660.16 759,474.01 729,811.02 717,821.19 826,957.67 Net Surplus 218,509.20 244,620.18 203,563.61 204,712.91 264,816.97
APPENDIX D Picture showing the Topdac Multi-Purpose Cooperative
Consumer Section Km.32 Branch