LAGADAN, RODERICK C. APRIL 2009. Wet Season Evaluation of Potato Entries at Loo, Buguias Benguet. Benguet State University, La Trinidad, Benguet.
Adviser: Janet P. Pablo, MSc.
ABSTRACT
The study was conducted to identify the best performing potato entries in terms of yield and resistance to pests and diseases; identify the potato entries which are best adapted at Loo, Buguias during the wet season; and to determine the profitability of potato entries under Loo, Buguias during wet season trial.
CIP 2.21.6.2 had the highest percentage survival. CIP 380241.17, PHIL 2.21.6.2, CIP 676070, PHIL 5.19.2.2 and CIP 573275 were observed as highly vigorous at 45 and 60 DAP. PHIL 2.21.6.2, CIP 380241.17 and PHIL 5.19.2.2 registered the widest canopy cover at 60 and 75 DAP. These entries were also highly resistant to late blight at 60 DAP.
CIP 380241.17 produced the highest yield and obtained a positive return on cash expense.
Page
Bibliography……… i
Abstract……….. i
Table of Contents………... iii
INTRODUCTION………. 1
REVIEW OF LITERATURE……… 3
Varietal Evaluation and Selection………. 3
Accession of Potato……….. 3
Potato Production………. 4
Harvesting………. 6
MATERIALS AND METHODS………. 7
RESULTS AND DISCUSSION………... 13
Temperature, Relative Humidity and Rainfall……….. 13
Percent Survival……… 14
Plant Vigor……… 14
Canopy Cover ……….. 14
Plant Height……… 16
Dry Matter Content……… 17
Reaction to Leaf Miner and Late Blight……… 18
Number of Marketable and Non-marketable Tubers………. 20
Total Yield (kg/5m2) and Computed Yield (t/ha-1)………... 25
Return on Cash Expenses……….. 26
SUMMARY, CONCLUTIONS AND RECOMMENDATIONS………. 27
LITERATURE CITED……….. 29
APPENDICES………... 31
Potato (Solanum tuberosum L.) is the fourth most important food crop in the world after rice, wheat and maize. The potato production represents roughly half of the world’s annual output of all roots and tubers. The crop is eaten by over one billion world
wide. Potatoes are part of the diet of a half a billion consumers is developing countries (Burton, 1990).
Today, potato growers face many economic challenges including foreign competition, changes in consumers preferences, new environmental regulations, loss of crop protection chemicals, increased input costs, new pest and disease pressures as well as unpredictable growing conditions. These challenges resulted to the introduction of new varieties that should be evaluated to determine if they still need improvement to meet the changing demands of the industry and the consumers. Evaluating new varieties of potatoes will determine if the impact of these will be profitable and sustainable production for the grower. Varieties are released by both public and private breeders, that is marketed in particular regions and which varieties are chosen for use by farmers (Bolaguer, 2007).
In order to identify varieties that are adapted under Benguet condition, these must be evaluated in the key production areas and compared with the traditional varieties. The test of the new varieties from a range of sources under varying conditions offers the greatest probability of identifying superior varieties with improved pest resistance, higher yield and reduces production inputs.
The study aimed to:
1. identify the best performing potato entry based on yield and resistance to pests and diseases during wet season trial;
2. identify the potato entry that is best adapted under wet season trial at Loo, Buguias condition; and
3. determine the profitability of growing the different potato entries under wet season at Loo, Buguias.
The study was conducted from June to September 2008 at Loo, Buguias, Benguet.
REVIEW OF LITERATURE
Varietal Evaluation and Selection
PCARRD (1985) suggested that before planting, the first decision is to know the best variety that is adapted to the locality to have a profitable production. Excellent cultural management practices and favorable environmental factors may not compensate for a poor choice of variety. Using the right variety ensures high yield and better quality of produce.
The qualities of good stock of seed potatoes must be true to type free from possible insect pest and diseases and seed pieces should be properly stored. Varietal mixture and other undesirable variation will always give rise to mixed crop (PCARRD, 1985).
Accessions of Potato
Wild potatoes are important sources of genes for resistance to disease and insect pests. A collection of wild Mexican and South America, solanum species from the US potato Gene bank was evaluated under laboratory and/or field conditions for their reaction to late blight ( Phytophthora infestants), Colorado Potato beetle ( CPB Leptinotarsa decemlineata), and black leg ( Erwinia carotovora) sub species atroseptica ( Van Hall Dye) in order to identify individual genotypes with multiple resistance genes.
Late blight inoculations using aggressive isolates (US-8/ AZ and VS-11/ A1 mating types) of P. infestant revealed a wide range of variation for resistance between and within the accession of the wild species tested. For late blight, susceptible as well as moderately to highly resistant genotypes were observed in all the species tested. However, at least one accession from the three Mexicans and South America wild diploid species tested
showed a relative uniform high level of resistance to potato infestants. These included S.
bulbacastanum, S. pinnatisectum, S. cardiophyllum and S. circaefolium. Two accessions from South America species S. commersonii were highly susceptible to late blight. For the Colorado potato beetle test, only one species, S. pinu atisectum appeared uniformly resistant to CPB under field conditions. Results of screening for blackleg resistance showed that there were major differences between genotypes in the wild species (Sahajdak and Uznan’s , 2003)
Potato Production
The Philippine imports about 15% of its total seed potato requirements in accordance with government regulation while 85% comes from domestic production.
This means that the seed requirement of most potato farmer must be met by setting aside part of their crop for the succeeding on or by procuring planting from local sources.
In Benguet, Mountain Province and other areas, it has been observed that a great part of the seed potatoes produced locally are of poor quality, low varietal purity and are contaminated with seed-borne diseases. These are the main causes for the prevailing low yields in the growing areas.
To improve the situation, the government is encouraging the production of seed potatoes in appropriate areas in Benguet following the procedure and standards set by the Philippine-German Seed Potato Program and the seed potato certifying mechanism of the Philippine Potato Program.
Seed potato production is currently being undertaken by selected contract farmers in Benguet who enjoy a premium price for their produced. To participate, certain requirements have to be met, foremost of which is that the farmer must posses sufficient
experience and knowledge to be able to recognized and manage such factors as seed size and quality, soil fertility, plant density and plant nutrition, moisture supply, weed population and other cultural factors for optimum yield of quality seed potato (free from virus diseases and other limiting factors) prescribed by the seed certification scheme (PCARRD, 1982).
According to Tad-awan, et al. (2008), the following agro-ecological zones in Benguet: low mountain zone (1001 – 1500 m asl), mid-mountain zone (1501 -2000 m asl) and high mountain zone (above 2000 m asl) were all suited for potato production. In addition, Gonzales, et al. (2006), reported that before a clone will be released for variety, it should be conducted in three or more locations representing the low, mid and high elevation for wet and dry in order to obtain stable growth, yield and processing qualities.
As cited by Gayao, (1989) higher yields were obtained during dry season due to great solar radiation and canopy cover and lower late blight infection. Likewise Simongo, 2007 cited that the potato grows best with temperatures ranging from 17 to 22
oC and with average relative humidity requirement of 86%.
Beukema and Vander Zaag (1979) reported that light intensity used assimilation depends on the light available and the light intercepted by the green leaves. Furthermore, findings of Sano, (1980) revealed that large foliage develop before tuber initiation, the ultimate potential yield will be higher. Conversely, if small foliage has developed before tuber production, this results to lower tuber yield.
Harvesting
PCARRD (1982), reported further that the maturity period of potato vary depending on the variety and the conditions under which crop is grown in Benguet and Mountain Province are ready for harvest about 90 days after planting.
Losses in terms of quantity and quality can occur from the time the crop is harvested until it is finally used because of physical, physiological or pathological causes or combinations of these. A greater amount of the produce can reach the consumer if harvesting and subsequent handling are done correctly.
Gayao (1989) cited that, in order to attain the best yield of potato crop should be fully matured because the transfer of food to the leafy areas and stems to the tubers continues until the plants are dead or have dried up and fall to the ground.
MATERIALS AND METHODS
An area of 135 m2 was thoroughly prepared and divided into three blocks. Each block was subdivided into 8 plots measuring 1m x 5 m. Double row planting was used.
The experimental designed was laid-out following the randomized complete block design
(RCBD).
The potato entries evaluated were:
Code Entry Place of Collection
E1 PHIL 2.21.6.2 Philippines
E2 PHIL 5.19.2.2 Philippines
E3 CIP 380241.17 CIP
E4 CIP 573275 CIP
E5 CIP 676070 CIP
E6 Ganza (check) CIP
E7 Granola (check) CIP
E8 Igorota (check) Philippines
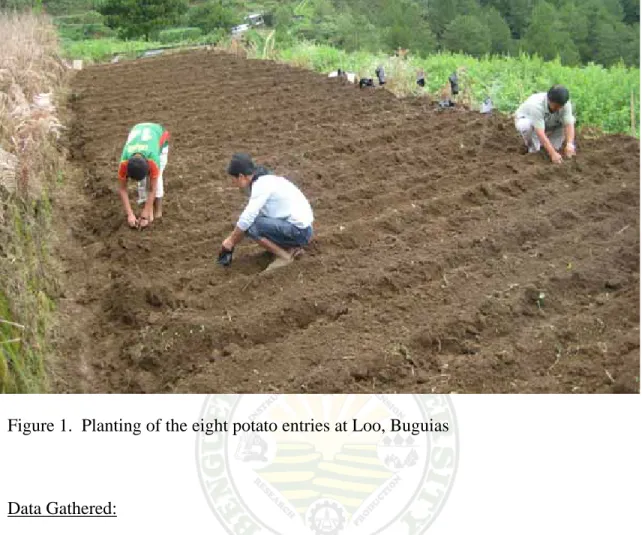
Pre-sprouted tubers acquired from the Northern Philippine Root Crops Research and Training Center, Benguet State University (NPRCRTC-BSU) were planted at 25 cm x 30 cm between hills and rows (Figure1).
Before planting, chicken dung was thoroughly mixed with the soil following the farmers practice at 1 can per plot during land preparation. Irrigation, fertilizer application, weeding and control of pest and diseases were strictly followed.
Applications of fungicides and insecticides were stopped two weeks before the harvest.
% Survival = x 100
Figure 1. Planting of the eight potato entries at Loo, Buguias
Data Gathered:
A. Meteorological data. Temperature and relative humidity were taken using a compact hygrometer. Rainfall was taken by placing cans in the field to collect water when precipitation occurs. The volume of water collected was measured using a beaker and was recorded by getting the volume of the water collected.
B. Vegetative characters
1. Percent survival. This was the number of plants that survived one month after planting and computed using the formula.
No. of plants survived
Total number of plants planted
2. Plant vigor. This was taken at 30, 45, and 60 days after planting using the rating
scale by CIP (2004) as follows:
Scale Description Remarks 1 Plants strong with robust stems and leaves and light
to dark green
Highly vigorous
2 Plants are moderately strong with robust stems and leaves are light green in color
Moderately vigorous
3 Better than Vigorous Vigorous
4 Plants are weak with few thin stems and leaves are pale
Less vigorous
5 Plants are weak with few stems and leaves are very pale
Poor vigor
3. Canopy cover. This was taken at 30, 45, 60 and 75 days after planting (DAP) by using a wooden frame of 120 cm x 60 cm wide and with 12 cm x 6 cm grids.
4. Initial and final plant height (cm). Plant height was measured from the base to the tip of ten sample plants one month after planting and a week before harvesting.
5. Dry matter content (DMC). Fifty grams tubers were weighed per sample, sliced into cubes, and oven dried at 80 oC for 48 hours. This was recorded and computed using the following formula:
% Dry matter content (DMC) = 100% - %MC Where:
% Moisture Content (MC) = Fresh weight – Oven dry weight x 100 Fresh Weight
B. Yield and Yield Components
6. Number and weight of marketable tubers per plot (kg). Tubers were classified and weighed based on the following grading system:
a. Large tuber-weight of 90-99 grams b. Big tubers-weight of 70-89 grams c. Medium tubers-weight of 50-69 grams d. Small tubers-weight of 20-49 grams
7. Number and weight of non-marketable tubers per plot (kg). This was obtained by counting and weighing all tubers that are malformed and damaged by insect and diseases.
8. Total yield per plot. The sum of the weight of marketable and non-marketable tubers was recorded.
9. Computed yield (t/ha). This was the computed yield by converting the yield per plot using the formula:
Yield t ha-1= (Total yield/plot x 10, 000)/1000 Plot size (m2)
C. Reaction to Leaf Miner and Late Blight
10. Reaction to Leaf miner. This was taken at 30, 45, 60 and 75 DAP and was rated using the scale of 1 – 5 (CIP, 2001).
Scale Description Remarks
1 Less than 20% of the plants per plot infested Highly Resistant 2 21-40% of the plants per plot infested Moderately resistant 3 41-60% of the plants per plot infested Susceptible
4 61-80% of the plants per plot infested Moderately susceptible 5 81 – 100% of the plants per plot infested Very susceptible
11. Reaction to Late blight. This was observed and recorded at 30, 45, 60 and 75 DAP using the CIP scale (Henfling, 1987).
CIP scale value
Blight (%)
Symptoms Mean limits
1 0 No late blight observable
2 2.5 Traces -< 5 Late blight present. Maximum 10 lesions per plant
3 10 5 -< 15 Plants look healthy, but lesions are easily seen at closer distance. Maximum foliage area affected by lesions or destroyed corresponds to more than 20 leaflets.
4 25 15 -< 35 Late blight easily seen on most plants. About 25% of foliages is covered with lesions or destroyed.
5 50 35 -< 65 Plot looks green; however, all plants are affected. Lower leaves are dead. About half the foliage area is destroyed.
6 75 65 -< 85 Plots look green with brown flecks. About 75%
of each plant is affected. Leaves of the lower half of plants are destroyed.
7 90 85 -< 95 Plot neither predominantly green nor brown.
Only top leaves are green. Many stems have large lesions.
8 97.5 95 -< 100 Plot is brown-colored. A few top leaves still have some green areas. Most stems have lesions or are dead.
9 100 All leaves and stems dead.
*The description of symptoms is based on plants with 4 stems and 10 to 12 leaves per stem.
12. Return on Cash Expense (ROCE). This was computed by dividing the net profit over the total cost of production multiplied by 100.
ROCE = Net profit x 100 Total cost of production
Analysis of Data
All quantitative data was analyzed through the analysis of variance (ANOVA) for Randomized Complete Block Design (RCBD) with three replications. Significance of difference among the treatment means was tested using the Duncan's Multiple Range Test (DMRT) at 5% level of significance.
RESULTS AND DISCUSSION
Meteorological Data
Table 1 shows the meteorological data from July to September 2008 at Loo, Buguias, Benguet.
Air temperature (Cº). Temperature recorded from July to September 2008 ranges from 16 oC to 19 oC. The variability of the temperature during the conduct of the study might be due to the variable rainfall occurrence.
Rainfall Amount (ml). Rainfall amount was noted from July to September and the highest was recorded during the last week of August while the lowest was during the second week of September with a rainfall amount of 1.960 L and 0.070 L, respectively.
Relative Humidity (%). Highest relative humidity was observed during 1st week of September (81.5%) while the lowest was recorded during the 3rd week of July (62.20%) (Table 1).
Table 1. Rainfall, temperature and relative humidity during the conduct of the study from July to September 2008
MONTH WEEK AIR TEMP.
(oC)
RELATIVE HUMIDITY (%)
RAINFALL AMOUNT (L) July 1 19 73.40 0.25 July 2 18 72.70 0.44 July 3 17 62.20 1.25 July 4 16 80.40 0.95 August 1 16 80.40 0.79 August 2 17 81.00 1.28 August 3 17 81.00 0.91 August 4 16 80.40 1.96 September 1 18 81.50 0.47 September 2 17 81.00 0.07 September 3 16 80.40 0.99 September 4 19 73.40 0.45
Percent Survival
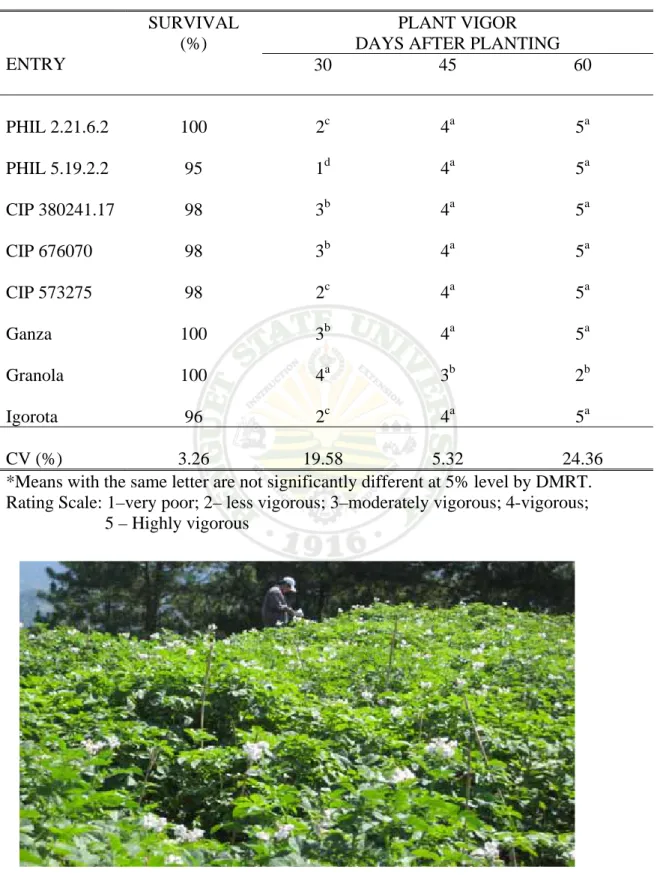
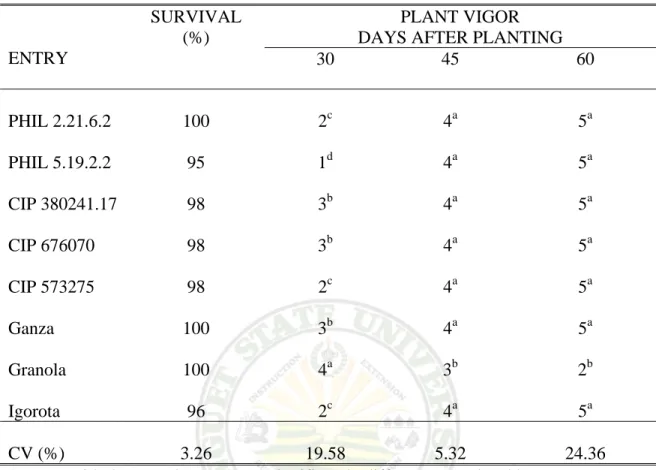
Percent plant survival of the different entries of potato was not significant.
Plant Vigor
Significant differences were observed on the plant vigor of the eight potato entries evaluated. All the entries exhibited increasing vigor from 30 to 60 DAP except for Granola (Table 2). CIP 676070 and CIP 380241.17 had a comparable growth stand with the Ganza (check) with a rating of 3 (moderately vigorous) at 30 DAP while PHIL 5.19.2.2 had a poor growth stand. The check variety Granola was observed to have a decreasing plant stand from 30 to 60 DAP which might be due to early late blight infection at 45 DAP.
Canopy Cover
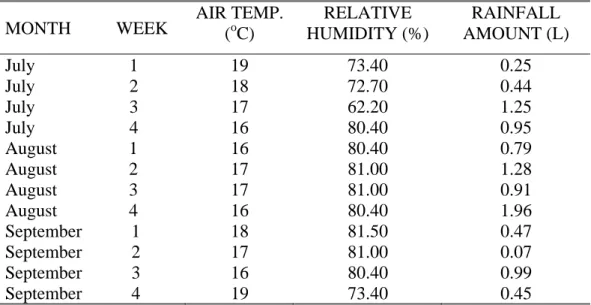
Significant differences were observed on the canopy cover of the different entries at 30, 45, 60, and 75 DAP. An increasing canopy cover was noted from 30 to 65 DAP in most of the entries except for the check variety Granola which had no canopy cover at 60 DAP.
At 75 DAP, PHIL 2.21.6.2, PHIL 5.19.2.2 and CIP 380241.17 had significantly the highest canopy cover but comparable with Igorota (Figure 2).
The decrease in the canopy cover in CIP 676070, CIP 573275, Ganza and Granola could be due to the high late blight infection caused by the high amount of rainfall during the conduct of the study.
Table 2. Percentage survival and plant vigor at 30, 45, and 60 DAP of the eight potato entries grown at Loo, Buguias
ENTRY
SURVIVAL (%)
PLANT VIGOR DAYS AFTER PLANTING
30 45 60
PHIL 2.21.6.2 100 2c 4a 5a
PHIL 5.19.2.2 95 1d 4a 5a
CIP 380241.17 98 3b 4a 5a
CIP 676070 98 3b 4a 5a
CIP 573275 98 2c 4a 5a
Ganza 100 3b 4a 5a
Granola 100 4a 3b 2b
Igorota 96 2c 4a 5a
CV (%) 3.26 19.58 5.32 24.36
*Means with the same letter are not significantly different at 5% level by DMRT.
Rating Scale: 1–very poor; 2– less vigorous; 3–moderately vigorous; 4-vigorous;
5 – Highly vigorous
Figure 2. Plant stand of the eight potato entries at 75 DAP
Figure2 .Plant stand of the eight potato entries at 75 DAP
Table 3. Canopy cover at 30, 45, 60 and 75 days after planting of the eight potato entries grown at Loo, Buguias
ENTRY
CANOPY COVER DAYS AFTER PLANTING
30 45 60 75
PHIL 2.21.6.2 49bc 99a 100a 100a
PHIL 5.19.2.2 24d 45d 100a 100a
CIP 380241.17 75a 100a 100a 100a
CIP 676070 46c 86ab 100a 58b
CIP 573275 60b 100a 100a 61b
Ganza 61b 100a 100a 81ab
Granola 39c 60cd - -
Igorota 41c 72bc 100a 100a
CV (%) 14.56 11.04 0.23 22.35
*Means with the same letter are not significantly different at 5% level by DMRT.
- = no canopy cover
Plant Height
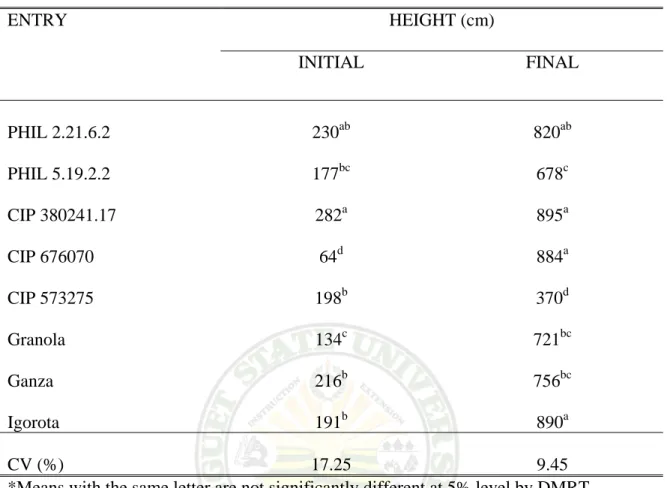
The potato entries had significant differences on the plant height at 30 and 90 DAP (Table 4). CIP 380241.17 significantly had the tallest plants of 282 cm but comparable with entry 2.21.6.2 (230 cm) followed by CIP 573275 (216 cm) which was also comparable with the check variety Granola and Ganza with respective initial plant height of 198 cm and 191 cm. The shortest plants were recorded from PHIL 5.19.2.2.
CIP 380241.17 significantly registered the tallest final plants (895 cm) outranking the check varieties Ganza and Granola but comparable with the check variety Igorota (890 cm). It was observed that most of the entries are tall at 90 DAP indicating that the
Table 4. Plant height at 30 and 90 DAP of the eight potato entries grown at Loo, Buguias
ENTRY HEIGHT (cm)
INITIAL FINAL
PHIL 2.21.6.2 230ab 820ab
PHIL 5.19.2.2 177bc 678c
CIP 380241.17 282a 895a
CIP 676070 64d 884a
CIP 573275 198b 370d
Granola 134c 721bc
Ganza 216b 756bc
Igorota 191b 890a
CV (%) 17.25 9.45
*Means with the same letter are not significantly different at 5% level by DMRT.
entries were affected by the long photoperiods. This growth pattern in most of the entries validated the observations of some farmers as reported by Simongo and Gayao (2006) that during wet season, variety Solibao had tall vegetative growth, longer maturity (120 days), susceptibility to late blight and lower yield.
Dry Matter Content
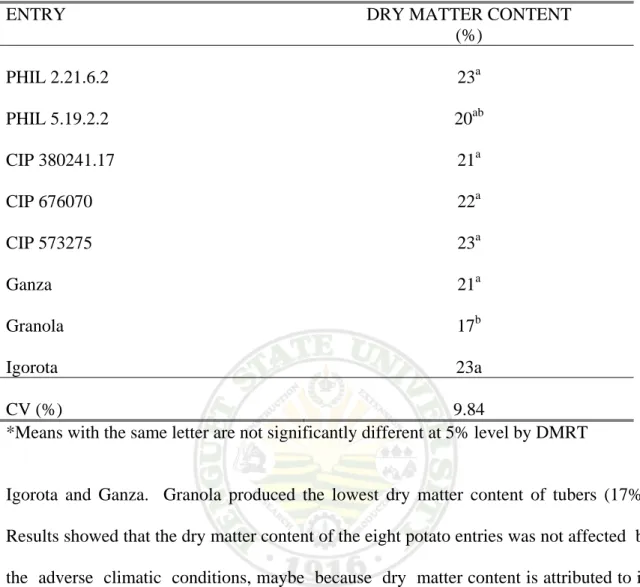
Results showed significant differences on the dry matter content of the entries grown at Loo, Buguias during the wet season trial. All the entries evaluated had high dry matter content ranging from 21 to 23 % which was comparable with the check varieties
Table 5. Dry matter content of the eight potato entries grown
ENTRY DRY MATTER CONTENT
(%)
PHIL 2.21.6.2 23a
PHIL 5.19.2.2 20ab
CIP 380241.17 21a
CIP 676070 22a
CIP 573275 23a
Ganza 21a
Granola 17b
Igorota 23a
CV (%) 9.84
*Means with the same letter are not significantly different at 5% level by DMRT
Igorota and Ganza. Granola produced the lowest dry matter content of tubers (17%).
Results showed that the dry matter content of the eight potato entries was not affected by the adverse climatic conditions, maybe because dry matter content is attributed to its genetic characteristics. Results validated the findings of Rastovski (1981) that dry matter content is very important factor in potatoes, since it is mainly determined genetically and thus, depends on the variety.
Reaction to Leaf Miner and Late Blight
Leaf miner infestation and bacterial wilt infection were not observed during the evaluation period. This might be due to the continuous rainfall during the conduct of the study.
Reaction to Late Blight
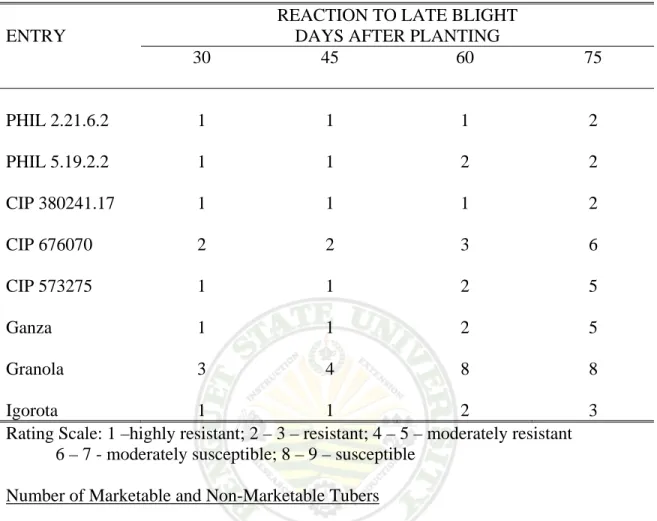
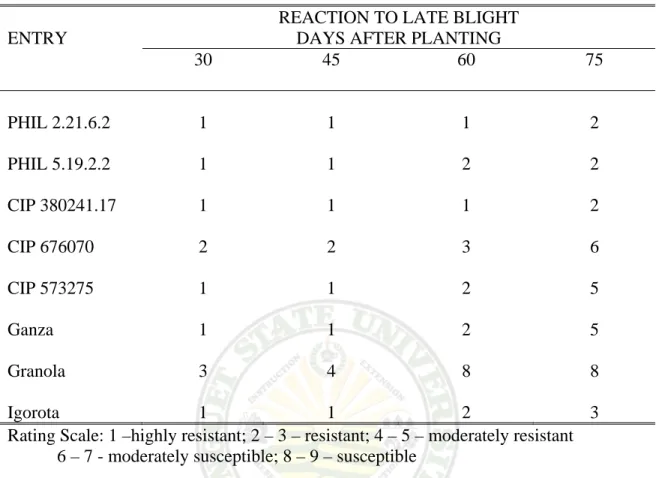
Entries PHIL 2.21.6.2, CIP 380241.17 and PHIL 5.19.2.2 at 30 to 60 DAP showed high resistance to late blight which was comparable with the check variety Igorota as reflected by their ratings ranging from 1 to 3. At 75 DAP, most of the entries except 676070 were noted to be resistant to late blight. The check variety Granola had shown susceptibility to late blight infection at 60 and 75 DAP with 95 to 100% damage.
Results indicate that some of the entries including the check variety Granola were susceptible to late blight while CIP 380241.17, PHIL 5.19.2.2 and PHIL 2.21.6.2 were resistant to the disease. Results corroborate with the findings of Gayao (1989) that development of late blight disease was apparently faster in susceptible cultivars than in resistant ones.
On the other hand the high infection of late blight on some of the entries might be attributed with the prevalent occurrence of rainfall during the conduct of the study.
Ganga et al. (1987 and 1989) reported that late blight pressure was great during heavy rains and the disease was prevalent during the wet and cool season.
Table 6. Reaction to late blight incidence at 30, 45, 60 and 75 DAP of the eight potato entries
ENTRY
REACTION TO LATE BLIGHT DAYS AFTER PLANTING
30 45 60 75
PHIL 2.21.6.2 1 1 1 2
PHIL 5.19.2.2 1 1 2 2
CIP 380241.17 1 1 1 2
CIP 676070 2 2 3 6
CIP 573275 1 1 2 5
Ganza 1 1 2 5
Granola 3 4 8 8
Igorota 1 1 2 3
Rating Scale: 1 –highly resistant; 2 – 3 – resistant; 4 – 5 – moderately resistant 6 – 7 - moderately susceptible; 8 – 9 – susceptible
Number of Marketable and Non-Marketable Tubers
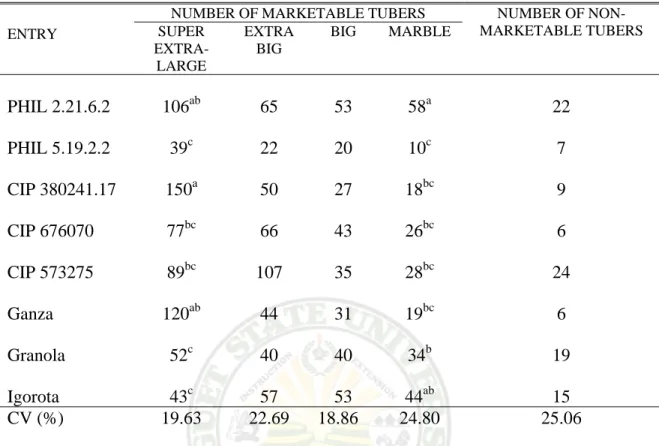
Table 7 shows that CIP 380241.17 produced the highest number of super extra large tubers (150) significantly out numbering the check varieties Granola and Igorota, however, comparable with PHIL 2.21.6.2 and the check variety Ganza with a means of 106 and 120, respectively.
No significant differences were noted on the extra big and big tubers of the different entries evaluated. On the number of marble tubers, PHIL 2.21.6.2 significantly produced the highest number of 58 tubers but comparable with cv Igorota (44), outnumbering the two check varieties Granola and Ganza.
There were no significant differences observed on the number of non-marketable tubers of the different entries evaluated. The variability on the number of tubers on the different entries could be associated with the genetic characteristics of the different entries.
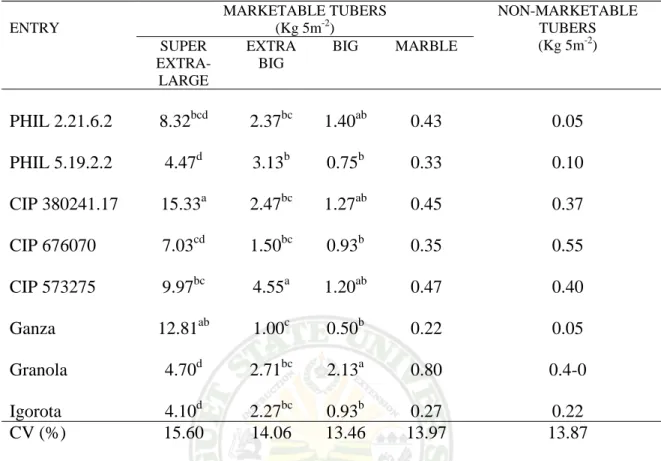
Weight of Marketable and Non-marketable Tubers
Weight of marketable tubers and non-marketable tubers classified according to size at harvest are presented in Table 8 and Figure 3 and 4. Significant differences were observed among the potato entries for the weight of super-extra large, extra large and big tubers. Heaviest weights were observed in CIP 380241.17 (15.33 kg) for super - extra large, PHIL 5.19.2.2 (3.13 kg) and CIP 573275 (4.55kg) for extra large and CIP 573275 (1.20 kg), CIP 380241.17 (1.27 kg) and PHIL 2.21.6.2 (1.40kg). These entries were either significantly comparable or out yielding the check varieties. Marble-sized tubers and non-marketable did not show significant differences among the potato entries.
The variation observed among the size classification of the different entries was greatly affected by the genetic characteristics associated with the environmental factors.
Earlier results showed that the initial, final height and late blight was greatly affected by the day length and rainfall, respectively while the performance of the vegetative growth also affects the yield of the different entries.
Table 7. Number of marketable and non – marketable tubers of eight potato entries at Loo, Buguias
ENTRY
NUMBER OF MARKETABLE TUBERS NUMBER OF NON- MARKETABLE TUBERS SUPER
EXTRA- LARGE
EXTRA BIG
BIG MARBLE
PHIL 2.21.6.2 106ab 65 53 58a 22
PHIL 5.19.2.2 39c 22 20 10c 7
CIP 380241.17 150a 50 27 18bc 9
CIP 676070 77bc 66 43 26bc 6
CIP 573275 89bc 107 35 28bc 24
Ganza 120ab 44 31 19bc 6
Granola 52c 40 40 34b 19
Igorota 43c 57 53 44ab 15
CV (%) 19.63 22.69 18.86 24.80 25.06
*Means with the same letter are not significantly different at 5% level by DMRT
Table 8. Weight of marketable and non-marketable tubers of eight potato entries
ENTRY
MARKETABLE TUBERS (Kg 5m-2)
NON-MARKETABLE TUBERS (Kg 5m-2) SUPER
EXTRA- LARGE
EXTRA BIG
BIG MARBLE
PHIL 2.21.6.2 8.32bcd 2.37bc 1.40ab 0.43 0.05 PHIL 5.19.2.2 4.47d 3.13b 0.75b 0.33 0.10 CIP 380241.17 15.33a 2.47bc 1.27ab 0.45 0.37 CIP 676070 7.03cd 1.50bc 0.93b 0.35 0.55 CIP 573275 9.97bc 4.55a 1.20ab 0.47 0.40 Ganza 12.81ab 1.00c 0.50b 0.22 0.05 Granola 4.70d 2.71bc 2.13a 0.80 0.4-0 Igorota 4.10d 2.27bc 0.93b 0.27 0.22 CV (%) 15.60 14.06 13.46 13.97 13.87
*Means with the same letter are not significantly different at 5% level by DMRT
Figure 3. Harvesting of the eight potato entries grown at Loo, Buguias
2.21.6.2 5.19.2.2
380241.17 676070
573275 Ganza
Granola Igorota Figure 4. Tubers of potato entries
Total Yield (kg/5m2) and Computed Yield (tons/ha)
Analysis revealed significant differences on the yield of the different entries of potato (Table 9). CIP 380241.17 produced the highest total yield with 19.65 kg as compared to the check varieties Granola (7.48) and Igorota (8.28). The rest of the entries had a total yield ranging from 6.18 to 16.18 kg which was either comparable or outranking the check varieties Granola (7.48 kg) and Igorota (8.28 kg).
On the computed marketable yield of the eight entries of potato, CIP 380241.17 had the highest marketable yield of 39.30 kg significantly out yielding the check varieties Granola and Igorota with 14.97 and 16.57 t ha-1, respectively. The lowest was noted from PHIL 5.19.2.2 with computed yield of 12.37 t ha-1 which was comparable with the yield of the three check varieties.
Table 9. Total and computed yield of eight potato entries grown at Loo, Buguias
ENTRY
TOTAL YIELD (5 m-2)
COMPUTED YIELD (t ha-1)
PHIL 2.21.6.2 13.97bc 27.93bc
PHIL 5.19.2.2 6.18e 12.37e
CIP 380241.17 19.65a 39.30a
CIP 676070 11.23cd 22.47cd
CIP 573275 16.18ab 32.37ab
Granola 7.48de 14.97de
Ganza 16.08ab 32.57ab
Igorota 8.28de 16.57de
CV (%) 20.78 21.02
*Means with the same letter are not significantly different at 5% level by DMRT.
Return on Cash Expense
Only entry CIP 380241.17 had a positive return on cash expense while the rest of the different entries evaluated gave a negative return. The negative return on cash expense maybe attributed to the low yield and high late blight incidence. On the other hand, the vegetative growth of most entries was very tall which contributes to the increase volume of fungicides used attributing to the increased cost of production.
Reports of Simongo and Gayao (2006) stated that the very tall vegetative growth harbored rodents, enhanced stem rot and breakage, and entailed higher labor and pesticide costs (Table 10).
Table 10. Return on cash expense of the eight potato entries grown at Loo, Buguias
ENTRY COST OF
PRODUC- TION (PhP)
MARKETABLE TUBERS
(kg/5m2)
GROSS SALE (PhP)
NET INCOME (PhP)
ROCE (%)
PHIL 2.21.6.2 510.00 12.52 375.60 -73.65 -14.44 PHIL 5.19.2.2 510.00 8.68 260.00 -249.60 -48.94 CIP 380241.17 510.00 19.52 585.60 75.60 14.82 CIP 676070 510.00 9.81 294.90 -215.70 -42.29 CIP 573275 510.00 10.34 310.20 -199.80 -39.14 Granola 510.00 14.53 435.90 -74.10 -14.53
Ganza 510.00 16.19 485.70 -24.30 -4.76
Igorota 510.00 7.27 227.10 -282.90 -55.47
* Total cost of production includes cost of planting materials, insecticides, fertilizers and labor.
* Selling price of potato tubers is based in PhP 30.00 per kilo
SUMMARY, CONCLUSIONS AND RECOMMENDATIONS
Summary
The study was conducted to identify the best performing potato entry based on yield and resistance to pests and diseases; identify which entries are best adapted under wet season at Loo, Buguias and to determine the profitability of growing different potato entries under the wet season trial. The study was conducted at Loo, Buguias from July to September 2008.
CIP 380241.17, PHIL 2.21.6.2, PHIL 5.19.2.2, CIP 676070 and CIP 573275 were observed to have highly vigorous plant stand at 45 and 65 DAP. CIP 380241.17 and PHIL 5.19.2.2 had the widest canopy cover at 75 DAP while PHIL 2.21.6.2, CIP 380241.17 was moderately resistant to late blight at 75 DAP.
CIP 380241.17 produced the highest number, heaviest weight of marketable tubers and positive return on cash expense while the rest of the entries had negative return on cash expense. All the entries had high dry matter content.
Conclusion
The best performing potato entries are CIP 380241.17, CIP 5732.75 and PHIL 2.21.6.2 based on yield and resistance to late blight.
CIP 380241.17, PHIL 21.6.2.2 and PHIL 573275 are best adapted at Loo, Buguias as evidenced by its high yield, dry matter content and resistant to late blight.
In terms of profitability, CIP 380241.17 has positive return on cash expense while the rest have negative return.
Recommendation
CIP 380241.17, PHIL 2.21.6.2.2 and CIP 573275 could be recommended for wet season planting under Loo, Buguias condition.
There should be a continuous evaluation and selection of potato entries until a variety with stable performance will be recommended for wet season planting.
LITERATURE CITED
BEUKEMA, H. P. and D. E. VAN DER ZAAAG. 1979. Potato improvement: Some factors and facts. International Agriculture Center, Wageningen, The Netherlands. P. 222.
BOLAGUER A. 2007. International Year of potato. Increase awareness of the importance of potato and base farming. Retrieved December 16 from www.
Potato 2007. org/en/ Index html.
CHAIDA, S.H. 1983. Modern technology of raising field crops. New York American Book Co., Pp. 269-270.
GANGA, Z. N., E. O.BADOL and S. GAYAO. 1989. Potato germplasm evaluation for late blight resistance at diverse highland locations during different seasons.
Research Results Presented in a series of Working Papers. Volume 11.NPRCRTC, Benguet State University, La Trinidad Benguet. Pp. 6-8.
GANGA, Z. N., I. C. GONZALES, E. O.BADOL, S. GAYAO and H. TORRES. 1987.
Results of potato germplasm evaluation for yield resistance to Phytopthora infestans in the Philippine highlands. 1987. CIP Working Paper #85-11. In: The Potato in the Southeast Asia and the Pacific Regio, Cip Region VII, c/o PCARRD, Los Banos, Laguna, Philippines. P. 157.
GAYAO, S. T. 1989. Potato (Solanum Spp.) Germplasm evaluation for late blight (phytopthora Infestans) resistance at diverse highland locations during different seasons. MS Thesis. Benguet State University, La Trinidad, Benguet. P. 37.
GONZALES, I. C., E.T. BOTANGEN, T. D. MASNAGKAY, D. K. SIMONGO, F.S.
BALOG-AS, AND C. G. KISWA. 2006. Multilocational yield trial of potential clones across location. BSU Research Journal , Benguet State University. P. 74.
PCARRD,1982. Benguet techno guide for potato. Published in Laguna, Philippines. P. 6, 24.
PCARRD, 1985. Highland potato techno guide, Published in Laguna. P 3.
RASTOVSKI, A. VAN ES ET AL. 1981. Storage of potatoes post-harvest behavior, store design, storage practices, handling. Center for Agricultural Publishing and Documentation Wageningen. P. 37.
SAHAJDAK, A.and K.B.UZNAN’s . 2003. Potato health requirements arising from EU regulation and the treaty of accession. Retrieved on February, 2009 from welsww. Plant physical. Org/ Cgi/content/ful/;1/119/4.1567.
SANO, E., 1980. Rate of tuber production of three white potato varieties grown under six fertility levels. MS thesis, Mountain State Agricultural College La Trinidad, Benguet. P. 5.
SIMONGO, D. K. AND B. T. GAYAO. 2006. Farmers’ variety management practices in the production of Igorota, Solibao, and Raniag potatoes. The potato seed production technologies in the Highland of Northern Philippines: An assessment.
Pp. 116 – 130.
TAD-AWAN, B. A., D. K. SIMONGO, E. J. D. SAGALLA, J P. PABLO, C. G.
KISWA, AND C.C. SHAGOL. 2008. Organic potatoes: Varieties and practices in Benguet, Philippines, STVRDC-BSU, La Trinidad, Benguet, 2008. 124 pp.
APPENDICES
Appendix Table 1. Percent survival at 30 DAP
ENTRY
BLOCK
TOTAL MEAN
I II III
PHIL 2.21.6.2 100 100 100 300 100
PHIL 5.19.2.2 93 98 95 286 95
CIP 380241.17 100 100 95 295 98
CIP 676070 95 100 100 295 98
CIP 573275 100 95 100 295 98
Granola 100 100 100 300 100
Ganza 100 100 100 300 100
Igorota 100 100 88 288 96
TOTAL 788 793 778 2359 98
ANALYSIS OF VARIANCE SOURCE OF
VARIATION
DEGREES OF FREEDOM
SUM OF SQUARES
MEAN SQUARE
COMPUTED F
TABULATED F
0.05 0.01
Block 2 14.583 7.292
Treatment 7 68.292 9.756 0.95ns 2.77 4.28 Error 14 144.083 10.292
TOTAL 23 226.958
ns= Not significant Coefficient of Variation (%) = 3.26
Appendix Table 2a. Plant vigor at 30 DAP
ENTRY
BLOCK
TOTAL MEAN
I II III
PHIL 2.21.6.2 4 2 2 8 3
PHIL 5.19.2.2 1 2 1 4 1
CIP 380241.17 3 3 3 9 3
CIP 676070 3 3 2 8 3
CIP 573275 2 2 3 7 4
Granola 2 4 3 9 3
Ganza 1 4 4 9 3
Igorota 2 3 2 7 2
TOTAL 18 23 20 61 3
ANALYSIS OF VARIANCE SOURCE OF
VARIATION
DEGREES OF FREEDOM
SUM OF SQUARES
MEAN SQUARE
COMPUTED F
TABULATED F
0.05 0.01
Block 2 1.083 0.542
Treatment 7 13.167 1.881 7.35** 2.77 4.28
Error 14 3.583 0.256
TOTAL 23 17.833
**= Highly significant Coefficient of Variation (%) = 19.58
Appendix Table 2b. Plant vigor at 45 DAP
ENTRY
BLOCK
TOTAL MEAN
I II III
PHIL 2.21.6.2 4 4 3 11 4
PHIL 5.19.2.2 4 4 4 12 4
CIP 380241.17 4 4 4 12 4
CIP 676070 4 4 4 12 4
CIP 573275 4 4 4 12 4
Granola 4 4 4 12 4
Ganza 3 3 3 9 3
Igorota 4 4 4 12 4
TOTAL 31 31 30 92 4
ANALYSIS OF VARIANCE SOURCE OF
VARIATION
DEGREES OF FREEDOM
SUM OF SQUARES
MEAN SQUARE
COMPUTED F
TABULATED F
0.05 0.01
Block 2 0.083 0.042
Treatment 7 2.667 0.381 9.14** 2.77 4.28
Error 14 0.583 0.042
TOTAL 23 3.333
**= Highly significant Coefficient of Variation (%) = 5.32
Appendix Table 2c. Plant vigor at 60 DAP.
ENTRY
BLOCK
TOTAL MEAN
I II III
PHIL 2.21.6.2 5 5 5 15 5
PHIL 5.19.2.2 5 5 5 15 5
CIP 380241.17 5 5 4 14 5
CIP 676070 5 5 4 14 5
CIP 573275 5 5 5 15 5
Granola 5 5 5 15 5
Ganza 2 2 2 6 2
Igorota 5 5 5 15 5
TOTAL 37 37 35 109 5
ANALYSIS OF VARIANCE SOURCE OF
VARIATION
DEGREES OF FREEDOM
SUM OF SQUARES
MEAN SQUARE
COMPUTED F
TABULATED F
0.05 0.01
Block 2 0.333 0.167
Treatment 7 22.625 3.232 45.25** 2.77 4.28
Error 14 1.000 0.071
TOTAL 23 23.958
**= Highly significant Coefficient of Variation (%) = 5.88
Appendix Table 3a. Canopy cover at 30 DAP
ENTRY
BLOCK
TOTAL MEAN
I II III
PHIL 2.21.6.2 59 45 44 148 74
PHIL 5.19.2.2 32 10 31 73 37
CIP 380241.17 75 75 77 227 76
CIP 676070 54 50 33 137 69
CIP 573275 60 65 33 158 79
Granola 67 67 49 183 61
Ganza 40 40 37 117 39
Igorota 49 42 33 124 62
TOTAL 436 394 337 1167 62
ANALYSIS OF VARIANCE SOURCE OF
VARIATION
DEGREES OF FREEDOM
SUM OF SQUARES
MEAN SQUARE
COMPUTED F
TABULATED F
0.05 0.01 Block 2 362.333 181.167
Treatment 7 5277.833 753.976 14.47** 2.77 4.28 Error 14 729.667 52.119
TOTAL 23 6369.833
**= Highly significant Coefficient of Variation (%) = 14.56
Appendix Table 3b. Canopy cover at 45 DAP.
ENTRY
BLOCK
TOTAL MEAN
I II III
PHIL 2.21.6.2 100 100 97 297 99
PHIL 5.19.2.2 47 23 65 135 45
CIP 380241.17 100 100 100 300 100
CIP 676070 96 85 79 260 87
CIP 573275 100 100 100 300 100
Granola 100 100 100 300 100
Ganza 58 63 59 180 60
Igorota 68 81 66 215 72
TOTAL 669 652 666 1987 83
ANALYSIS OF VARIANCE SOURCE OF
VARIATION
DEGREES OF FREEDOM
SUM OF SQUARES
MEAN SQUARE
COMPUTED F
TABULATED F
0.05 0.01
Block 2 20.583 10.292
Treatment 7 9712.625 1387.518 16.62** 2.77 4.28 Error 14 1168.750 83.482
TOTAL 23 10901.958
**= Highly significant Coefficient of Variation (%) = 0.23
Appendix Table 3c. Canopy cover at 60 DAP.
ENTRY
BLOCK
TOTAL MEAN
I II III
PHIL 2.21.6.2 100 100 100 300 100
PHIL 5.19.2.2 100 100 100 300 100
CIP 380241.17 100 100 100 300 100
CIP 676070 100 100 100 300 100
CIP 573275 100 100 100 300 100
Granola 100 100 100 300 100
Ganza 0 0 0 0 0
Igorota 100 100 100 300 100
TOTAL 700 700 700 2100 100
ANALYSIS OF VARIANCE SOURCE OF
VARIATION
DEGREES OF FREEDOM
SUM OF SQUARES
MEAN SQUARE
COMPUTED F
TABULATED F
0.05 0.01
Block 2 0.083 0.042
Treatment 7 26225.292 3746.470 89915.28** 2.77 4.28
Error 14 0.583 0.042
TOTAL 23 26225.958
**= Highly significant Coefficient of Variation (%) = 0.23
Appendix Table 3d. Canopy cover at 75 DAP.
ENTRY
BLOCK
TOTAL MEAN
I II III
PHIL 2.21.6.2 100 100 100 300 100
PHIL 5.19.2.2 100 100 100 300 100
CIP 380241.17 100 100 100 300 100
CIP 676070 100 90 23 173 58
CIP 573275 50 100 34 184 61
Granola 100 80 63 243 81
Ganza 0 0 0 0 0
Igorota 100 100 100 300 100
TOTAL 650 670 520 1800 75
ANALYSIS OF VARIANCE SOURCE OF
VARIATION
DEGREES OF FREEDOM
SUM OF SQUARES
MEAN SQUARE
COMPUTED F
TABULATED F
0.05 0.01 Block 2 1425.000 712.500
Treatment 7 25944.667 3706.381 13.36** 2.77 4.28 Error 14 3884.333 277.452
TOTAL 23 31254.000
**= Highly significant Coefficient of Variation (%) = 19.58
Appendix Table 4a. Initial Plant height at 30 DAP
ENTRY
BLOCK
TOTAL MEAN
I II III
PHIL 2.21.6.2 285 224.5 180 180 689.5
PHIL 5.19.2.2 76.5 39 77.5 77.5 193
CIP 380241.17 338 223.5 284 284 845.5
CIP 676070 211 168 151 151 530
CIP 573275 256 167 226 226 649
Granola 217.6 169 186 186 572.6
Ganza 254 190 150 150 594
Igorota 146 175 80 80 401
TOTAL 1784.1 1356 1334.5 559.3 1784.1
ANALYSIS OF VARIANCE SOURCE OF
VARIATION
DEGREES OF FREEDOM
SUM OF SQUARES
MEAN SQUARE
COMPUTED F
TABULATED F
0.05 0.01 Block 2 16078.001 8039.001
Treatment 7 89460.872 12780.125 12.36** 2.77 4.28 Error 14 14477.006 1034.072
TOTAL 23 120015.859
**=Highly significant Coefficient of Variation (%) = 17.25
Appendix Table 4 b. Final Height at 75 DAP
ENTRY
BLOCK
TOTAL MEAN
I II III
PHIL 2.21.6.2 881.6 882.5 694.4 2458.5 819.5 PHIL 5.19.2.2 881.5 827.3 943.5 2652.3 884.1 CIP 380241.17 885.6 859.7 938.5 2683.8 1341.9
CIP 676070 725.6 729.6 579.5 2034.7 678.2
CIP 573275 742.6 679.5 844.4 2266.5 755.5
Granola 856.6 854.4 958.4 2669.4 889.8
Ganza 254 190 150 150 594
Igorota 735.5 746.4 682.5 2164.4 721.5
TOTAL 5745.38 5939.7 6028.3 17713.4 794
ANALYSIS OF VARIANCE SOURCE OF
VARIATION
DEGREES OF FREEDOM
SUM OF SQUARES
MEAN SQUARE
COMPUTED F
TABULATED F
0.05 0.01 Block 2 25189.801 12594.901
Treatment 7 96957.138 13851.020 7.60** 2.77 4.28 Error 14 25197.740 1799.839
TOTAL 23 147344.740
** =Highly significant Coefficient of Variation (%) = 9.45
Appendix Table 5a. Late blight incidence at 30 DAP
ENTRY
BLOCK
TOTAL MEAN
I II III
PHIL 2.21.6.2 1 1 1 3 1
PHIL 5.19.2.2 1 1 1 3 1
CIP 380241.17 1 1 2 4 1
CIP 676070 2 2 2 6 2
CIP 573275 1 1 2 4 1
Granola 1 2 2 5 2
Ganza 3 3 3 9 3
Igorota 1 2 1 4 1
TOTAL 11 13 14 38 2
Appendix Table 5b. Late blight incidence at 45 DAP
ENTRY
BLOCK
TOTAL MEAN
I II III
PHIL 2.21.6.2 1 1 1 3 1
PHIL 5.19.2.2 1 1 1 3 1
CIP 380241.17 1 1 2 4 1
CIP 676070 3 2 2 7 2
CIP 573275 1 1 2 4 1
Granola 1 2 2 5 2
Ganza 3 4 5 12 4
Igorota 1 2 1 4 1
TOTAL 12 14 16 33 2
Appendix Table 5c. Late blight incidence at 60 DAP
ENTRY
BLOCK
TOTAL MEAN
I II III
PHIL 2.21.6.2 1 1 1 3 1
PHIL 5.19.2.2 1 1 1 3 1
CIP 380241.17 1 1 2 4 1
CIP 676070 3 3 3 9 3
CIP 573275 2 1 3 6 2
Granola 2 3 2 7 2
Ganza 8 8 8 24 8
Igorota 2 3 2 7 2
TOTAL 20 21 22 63 3
Appendix Table 5d. Late blight incidence at 75 DAP
ENTRY
BLOCK
TOTAL MEAN
I II III
PHIL 2.21.6.2 2 2 2 6 2
PHIL 5.19.2.2 1 1 3 5 2
CIP 380241.17 1 2 3 6 2
CIP 676070 6 4 7 17 6
CIP 573275 7 1 6 14 5
Granola 2 7 7 16 5
Ganza 8 8 8 24 8
Igorota 3 3 4 10 3
TOTAL 30 28 40 98 4
Appendix Table 6. Number of super extra-large tubers per plot
ENTRY
BLOCK
TOTAL MEAN
I II III
PHIL 2.21.6.2 140 79 100 319 106
PHIL 5.19.2.2 53 21 43 117 39
CIP 380241.17 126 171 154 456 150
CIP 676070 104 50 76 230 77
CIP 573275 138 93 35 266 89
Granola 164 109 88 361 120
Ganza 78 34 43 155 52
Igorota 21 30 77 128 43
TOTAL 824 587 616 2032 85
ANALYSIS OF VARIANCE SOURCE OF
VARIATION
DEGREES OF FREEDOM
SUM OF SQUARES
MEAN SQUARE
COMPUTED F
TABULATED F
0.05 0.01 Block 2 4178.083 2089.042
Treatment 7 33215.292 4745.042 5.50** 2.77 4.28 Error 14 12072.583 862.327
TOTAL 23 49465.958
**= Highly significant Coefficient of Variation (%) = 19.63
Appendix Table 7. Number of extra large tubers per plot
ENTRY
BLOCK
TOTAL MEAN
I II III
PHIL 2.21.6.2 81 56 59 196 65
PHIL 5.19.2.2 23 24 18 65 22
CIP 380241.17 47 30 74 151 50
CIP 676070 89 54 54 197 66
CIP 573275 41 106 175 322 107
Granola 42 52 39 133 44
Ganza 33 55 33 121 40
Igorota 36 83 52 111 57
TOTAL 392 460 504 1296 56
ANALYSIS OF VARIANCE SOURCE OF
VARIATION
DEGREES OF FREEDOM
SUM OF SQUARES
MEAN SQUARE
COMPUTED F
TABULATED F
0.05 0.01 Block 2 796.000 398.000
Treatment 7 13221.333 1888.762 2.21ns 2.77 4.28 Error 14 11936.667 852.619
TOTAL 23 25954.000
ns= Not significant Coefficient of Variation (%) = 22.69
Appendix Table 8. Number of big tubers per plot
ENTRY
BLOCK
TOTAL MEAN
I II III
PHIL 2.21.6.2 66 74 20 160 53
PHIL 5.19.2.2 21 12 28 61 20
CIP 380241.17 45 21 16 82 27
CIP 676070 50 44 34 128 43
CIP 573275 37 35 33 105 35
Granola 31 31 31 93 31
Ganza 40 40 39 199 40
Igorota 81 56 22 159 53
TOTAL 371 313 223 987 38
ANALYSIS OF VARIANCE SOURCE OF
VARIATION
DEGREES OF FREEDOM
SUM OF SQUARES
MEAN SQUARE
COMPUTED F
TABULATED F
0.05 0.01 Block 2 1390.333 695.167
Treatment 7 2904.625 414.946 2.07ns 2.77 4.28 Error 14 2811.000 200.786
TOTAL 23 7105.958
ns= Not significant Coefficient of Variation (%) = 18.56
Appendix Table 9. Number of marble tubers per plot
ENTRY
BLOCK
TOTAL MEAN
I II III
PHIL 2.21.6.2 52 51 70 137 58
PHIL 5.19.2.2 6 15 10 31 10
CIP 380241.17 11 31 12 54 18
CIP 676070 28 33 18 79 26
CIP 573275 13 41 30 84 28
Granola 16 21 20 57 19
Ganza 21 40 41 102 34
Igorota 65 12 55 132 44
TOTAL 212 244 256 676 30
ANALYSIS OF VARIANCE SOURCE OF
VARIATION
DEGREES OF FREEDOM
SUM OF SQUARES
MEAN SQUARE
COMPUTED F
TABULATED F
0.05 0.01
Block 2 129.333 64.667
Treatment 7 4937.333 705.333 3.57* 2.77 4.28 Error 14 2762.667 197.333
TOTAL 23 7829.333
*= Significant Coefficient of Variation (%) = 24.80
Appendix Table 10. Number of non-marketable tubers per plot
ENTRY
BLOCK
TOTAL MEAN
I II III
PHIL 2.21.6.2 26 25 15 66 22
PHIL 5.19.2.2 0 16 5 21 7
CIP 380241.17 14 6 7 27 9
CIP 676070 3 11 4 18 6
CIP 573275 23 26 26 72 24
Granola 3 1 16 20 7
Ganza 16 40 2 58 19
Igorota 3 11 12 46 15
TOTAL 88 136 87 328 14
ANALYSIS OF VARIANCE SOURCE OF
VARIATION
DEGREES OF FREEDOM
SUM OF SQUARES
MEAN SQUARE
COMPUTED F
TABULATED F
0.05 0.01
Block 2 153.583 76.792
Treatment 7 1155.333 165.048 2.07ns 2.77 4.28 Error 14 1114.417 79.601
TOTAL 23 2423.333
ns= Not significant Coefficient of Variation (%) = 21.71
Appendix Table 11. Total number of marketable tubers kg/5m2
ENTRY
BLOCK
TOTAL MEAN
I II III
PHIL 2.21.6.2 339 260 249 848 283
PHIL 5.19.2.2 103 72 102 277 92
CIP 380241.17 119 253 256 628 209
CIP 676070 271 181 182 272 91
CIP 573275 229 275 273 777 259
Granola 253 213 178 644 215
Ganza 156 169 156 484 161
Igorota 203 181 206 590 197
TOTAL 1673 1604 1602 4520 188
ANALYSIS OF VARIANCE SOURCE OF
VARIATION
DEGREES OF FREEDOM
SUM OF SQUARES
MEAN SQUARE
COMPUTED F
TABULATED F
0.05 0.01 Block 2 408.583 204.292
Treatment 7 71506.292 10215.185 5.24** 2.77 4.28 Error 14 27272.083 1948.006
TOTAL 23 99186.958
**= Highly significant Coefficient of Variation (%) = 21.71
Appendix Table 12. Weight of super extra-large tubers per plot (kg)
ENTRY
BLOCK
TOTAL MEAN
I II III
PHIL 2.21.6.2 11.75 5.50 7.70 24.95 8.32
PHIL 5.19.2.2 6.10 2.10 5.20 13.40 6.70
CIP 380241.17 14.50 13.00 18.50 46.00 15.33
CIP 676070 10.25 5.00 5.85 21.10 7.03
CIP 573275 17.30 7.10 5.50 29.90 14.95
Granola 15.25 12.20 11.00 38.45 12.82
Ganza 7.95 2.75 2.340 13.04 4.35
Igorota 2.50 2.80 7.00 12.30 4.10
TOTAL 85.60 50.45 63.09 199.14 9.20
ANALYSIS OF VARIANCE SOURCE OF
VARIATION
DEGREES OF FREEDOM
SUM OF SQUARES
MEAN SQUARE
COMPUTED F
TABULATED F
0.05 0.01
Block 2 79.471 39.236
Treatment 7 358.598 51.228 6.98** 2.77 4.28 Error 14 102.749 7.339
TOTAL 23 539.813
**= Highly significant Coefficient of Variation (%) = 15.60
Appendix Table 13. Weight of extra large tubers per plot (kg)
ENTRY
BLOCK
TOTAL MEAN
I II III
PHIL 2.21.6.2 3.95 2.20 2.00 8.15 4.08 PHIL 5.19.2.2 1.10 1.10 0.80 3.00 1.50 CIP 380241.17 2.30 3.30 3.80 9.40 4.70
CIP 676070 1.50 3.10 2.50 7.10 3.55
CIP 573275 3.00 3.85 6.80 13.65 6.83
Granola 2.00 2.90 1.90 6.80 3.40
Ganza 1.40 1.85 1.25 4.50 2.25
Igorota 1.90 3.40 2.10 7.40 3.70
TOTAL 17.15 21.70 21.15 60.00 3.75
ANALYSIS OF VARIANCE SOURCE OF
VARIATION
DEGREES OF FREEDOM
SUM OF SQUARES
MEAN SQUARE
COMPUTED F
TABULATED F
0.05 0.01
Block 2 1.542 0.771
Treatment 7 23.922 3.417 3.58* 2.77 4.28
Error 14 13.376 0.955
TOTAL 23 14.06
*= Significant Coefficient of Variation (%) = 14.06
Appendix Table 14. Weight of big tubers per plot (kg)
ENTRY
BLOCK
TOTAL MEAN
I II III
PHIL 2.21.6.2 1.70 1.80 2.90 6.40 2.13 PHIL 5.19.2.2 0.70 0.30 0.50 1.50 0.50 CIP 380241.17 1.05 0.80 0.40 2.25 0.75
CIP 676070 1.70 1.50 1.00 4.20 1.40
CIP 573275 2.25 0.80 0.55 3.60 1.20
Granola 0.90 1.10 0.80 2.80 0.93
Ganza 1.00 0.80 1.00 2.80 0.93
Igorota 2.30 0.90 0.60 3.80 1.27
TOTAL 11.6 8.00 7.75 27.35 1.14
ANALYSIS OF VARIANCE SOURCE OF
VARIATION
DEGREES OF FREEDOM
SUM OF SQUARES
MEAN SQUARE
COMPUTED F
TABULATED F
0.05 0.01
Block 2 1.160 0.580
Treatment 7 5.163 0.738 2.80* 2.77 4.28
Error 14 3.686 0.263
TOTAL 23 10.010
*= Significant Coefficient of Variation (%) = 13.46
Appendix Table 15. Weight of marble tubers per plot (kg)
ENTRY
BLOCK
TOTAL MEAN
I II III
PHIL 2.21.6.2 1.10 0.30 1.00 2.40 0.80 PHIL 5.19.2.2 0.20 0.30 0.15 0.65 0.22 CIP 380241.17 0.20 0.65 0.15 1.00 0.33
CIP 676070 0.50 0.50 0.30 1.30 0.43
CIP 573275 0.30 0.70 0.50 1.50 0.50
Granola 0.20 0.40 0.20 0.80 0.27
Ganza 0.20 0.35 0.50 1.05 0.35
Igorota 0.65 0.10 0.60 1.35 0.45
TOTAL 3.35 3.30 3.40 10.05 0.42
ANALYSIS OF VARIANCE SOURCE OF
VARIATION
DEGREES OF FREEDOM
SUM OF SQUARES
MEAN SQUARE
COMPUTED F
TABULATED F
0.05 0.01
Block 2 0.001 0.001
Treatment 7 0.674 0.096 1.42ns 2.77 4.28
Error 14 0.952 0.068
TOTAL 23 1.627
ns= Not significant Coefficient of Variation (%) = 13.97
Appendix Table 16. Weight of non-marketable tubers per plot (kg)
ENTRY
BLOCK
TOTAL MEAN
I II III
PHIL 2.21.6.2 0.10 0.20 0.90 1.20 0.40 PHIL 5.19.2.2 0.00 0.10 0.05 0.15 0.05 CIP 380241.17 0.20 0.05 0.05 0.30 0.10
CIP 676070 0.05 0.05 0.05 0.15 0.05
CIP 573275 0.30 0.100 0.20 0.60 0.20
Granola 0.05 0.05 0.10 0.20 0.07
Ganza 1.05 0.50 0.10 1.65 0.55
Igorota 0.20 0.45 0.45 1.10 0.37
TOTAL 1.95 1.50 1.90 5.35 0.22
ANALYSIS OF VARIANCE SOURCE OF
VARIATION
DEGREES OF FREEDOM
SUM OF SQUARES
MEAN SQUARE
COMPUTED F
TABULATED F
0.05 0.01
Block 2 0.051 0.025
Treatment 7 0.695 0.099 1.41ns 2.77 4.28
Error 14 0.987 0.071
TOTAL 23 1.733
ns= Not significant Coefficient of Variation (%) = 28.63
Appendix Table 16. Total weight of marketable tubers per plot (kg)
ENTRY
BLOCK
TOTAL MEAN
I II III
PHIL 2.21.6.2 18.50 9.80 13.60 41.90 13.97 PHIL 5.19.2.2 8.10 3.80 6.65 18.55 6.18 CIP 380241.17 18.25 17.80 22.90 58.95 19.65 CIP 676070 13.25 10.10 9.65 33.00 11.00 CIP 573275 22.75 12.45 13.35 48.55 16.18
Granola 18.25 16.60 13.90 48.75 16.25
Ganza 10.55 5.75 6.15 22.45 7.48
Igorota 7.35 7.20 10.30 24.85 8.28
TOTAL 117.00 83.50 96.50 297.00 12.38
ANALYSIS OF VARIANCE SOURCE OF
VARIATION
DEGREES OF FREEDOM
SUM OF SQUARES
MEAN SQUARE
COMPUTED F
TABULATED F
0.05 0.01
Block 2 77.361 38.680
Treatment 7 492.072 70.296 10.62** 2.77 4.28
Error 14 92.671 6.619
TOTAL 23 662.103
**= Highly significant Coefficient of Variation (%) = 20.78
Appendix Table 17. Computed yield T ha-1
ENTRY
BLOCK
TOTAL MEAN
I II III
PHIL 2.21.6.2 37.0 19.6 27.2 83.80 27.93 PHIL 5.19.2.2 16.0 7.6 13.3 36.90 12.30 CIP 380241.17 36.5 35.6 15.8 87.90 29.30
CIP 676070 27.9 20.2 19.3 67.40 22.47
CIP 573275 45.5 24.9 26.7 97.10 32.37
Granola 36.7 33.2 27.8 97.70 32.57
Ganza 21.1 11.5 12.3 44.90 14.97
Igorota 14.7 14.4 20.6 49.70 16.57
TOTAL 235.40 167.00 163.00 565.40 23.56
ANALYSIS OF VARIANCE SOURCE OF
VARIATION
DEGREES OF FREEDOM
SUM OF SQUARES
MEAN SQUARE
COMPUTED F
TABULATED F
0.05 0.01 Block 2 299.963 149.932
Treatment 7 1986.467 283.781 10.43** 2.77 4.28 Error 14 380.823 27.202
TOTAL 23 2667.153
**= Highly significant Coefficient of Variation (%) = 21.02
Appendix Table 18. Dry matter content of potato entries
ENTRY
BLOCK
TOTAL MEAN
I II III
PHIL 2.21.6.2 24 26 20 70 23
PHIL 5.19.2.2 20 20 20 60 20
CIP 380241.17 22 22 20 64 21
CIP 676070 22 24 20 66 22
CIP 573275 22 22 25 69 23
Granola 24 18 20 62 21
Ganza 17 17 16 50 17
Igorota 20 24 24 68 23
TOTAL 171 173 165 509 21
ANALYSIS OF VARIANCE SOURCE OF
VARIATION
DEGREES OF FREEDOM
SUM OF SQUARES
MEAN SQUARE
COMPUTED F
TABULATED F
0.05 0.01
Block 2 4.333 2.1674
Treatment 7 98.625 14.089 3.23* 2.77 4.28
Error 14 61.00 4.357
TOTAL 23 163.958
*= Significant Coefficient of Variation (%) = 9.84