Editor, The Philippine Review of Economics, Rm 237, School of Economics, University of the Philippines, Diliman, Quezon City, 1101. Published articles reflect the sole editorial judgment of the editors and the views of their authors. Over the years, PES has served as one of the strongest networks of economists in academia, government and business.
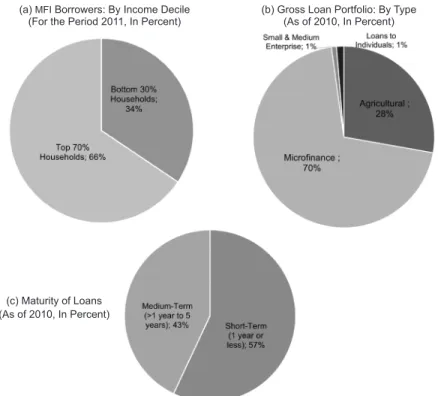
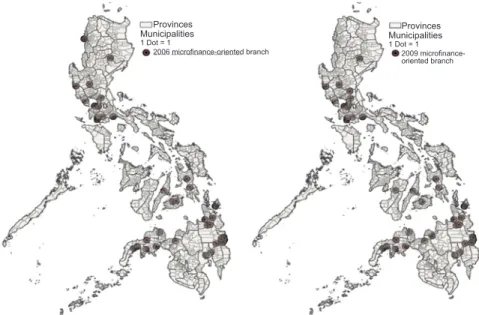
The findings, interpretations and conclusions expressed in this paper are entirely those of the authors. The Bangko Sentral ng Pilipinas (BSP), or Central Bank of the Philippines, partially lifted the moratorium on the creation of new banks in 2001, as long as the new bank will be microfinance-oriented. Meanwhile, IPW calculates the sample selection associated with households that drop out of the survey.
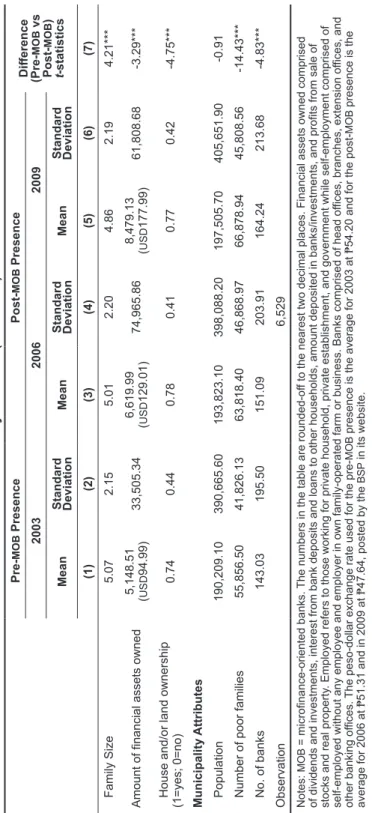
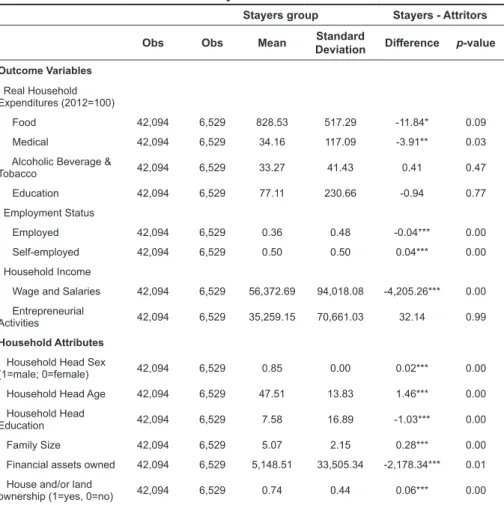
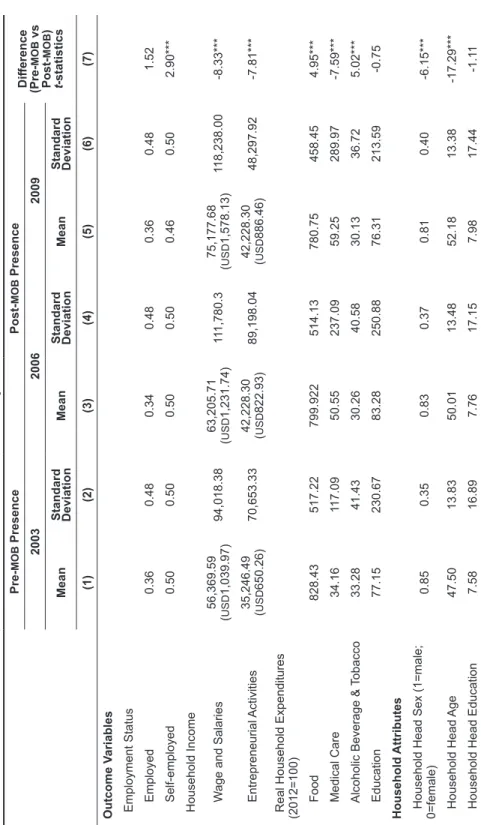
Education level of the household head does not differ statistically between pre- and post-MOB presence periods.
Estimation strategy
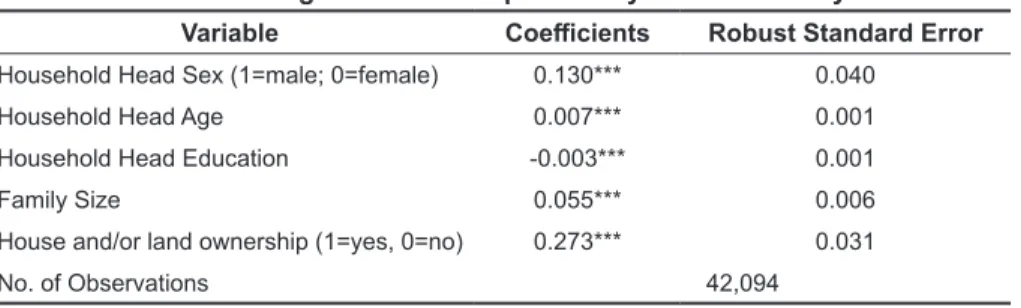
For household characteristics, proportion of males, age of the household head, household assets and households owning a house are statistically higher while family size is lower after the establishment of MOBs. This may be a result of the BSP allowing the establishment of MOBs only in locations that are not fully served by existing rural banks or other MOBs. We are interested in evaluating the employment status of the household head, as microfinance programs are intended to enhance self-employment activities.
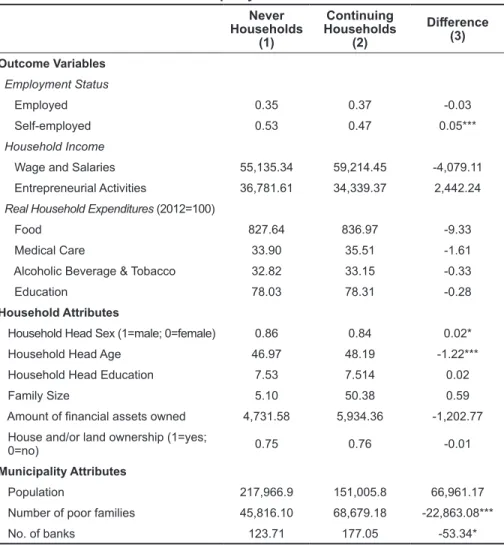
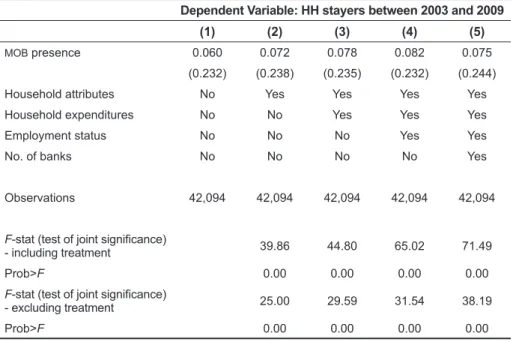
The results of the t-test for differences in the means with standard errors grouped at the municipal level of these households are presented in Column (3). Note that the dataset has only one pre-MOB period in 2003, which prevents testing (indirectly) the parallel trend assumption using multiple pre-intervention periods. In the data subsection of the paper, we discussed that the household panel data set represents about 16 percent of the original sample in and 2009.
It is important to take into account those who leave the survey, especially if attrition is not random, so that the remaining sample can be representative of the original population [Barry 2005]. Household characteristics include gender, age and education of the household head, financial assets owned, and home ownership. Xi is a vector of household characteristics, such as the age, gender and education level of the household head, as well as family size and home ownership from the 2003 FIES, including households that dropped out of the survey (see Appendix Table A1 for the results).
The means of the observable baseline characteristics are balanced after weighting the inverse propensity scores. The results in Appendix Table A2 suggest that there is no significant difference in the baseline mean. The results of the exercise in Appendix Table A3 indicate that there is no significant difference in the means of basic characteristics between households living in a municipality with MOB and those that did not.
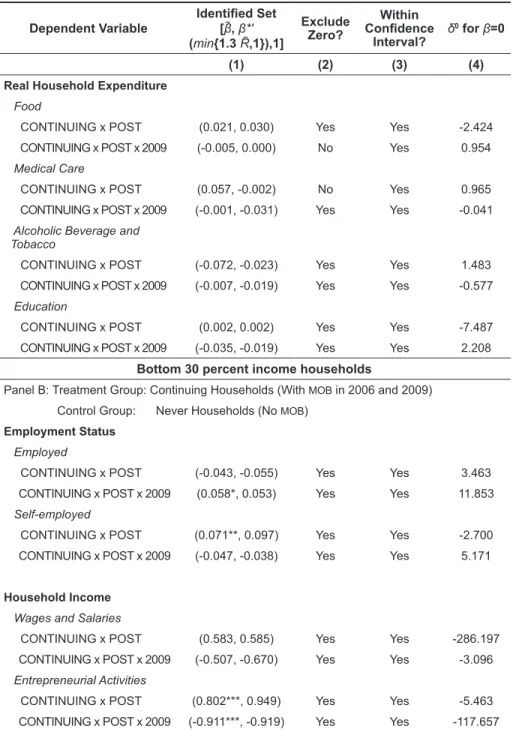
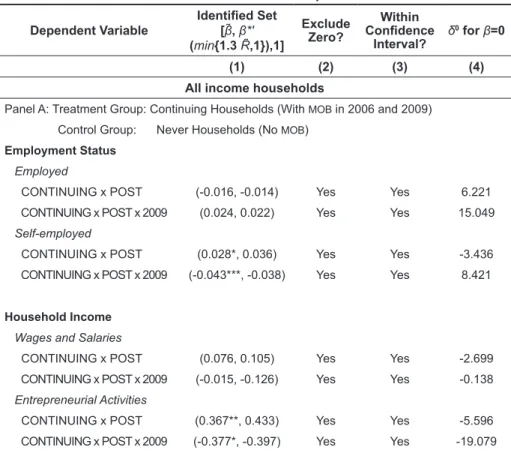
Furthermore, when the boundary set (or identified set) lies within the confidence intervals of the controlled effect β̃, this implies that the omitted variables are unlikely to drive the results. 2005] suggested a ratio of the impact of unobserved variables to the observed explanatory variables that would be necessary to fully explain the treatment effect of MOB presence on the well-being of certain households.
Results and discussion
In Panel B of Table 5, it can be observed that there is also no significant effect on the real expenditure of continuous households. However, they enjoy an immediate increase in 2006 in the probability of being self-employed and in entrepreneurial income of 7.1 percentage points and 1.23 percent, respectively. And while households reap an incremental increase in wage labor of 5.80 percentage points in 2009, they experience an incremental decline in wage income of 0.40 percent.
The direct benefit of MOB presence on entrepreneurial activities is not unusual and is consistent with the findings of Crèpon et al. That is, there is a change in family activity towards self-employment and away from wage work. Meanwhile, the increasing decline in entrepreneurial and wage income and the increase in the likelihood of wage employment are likely due to the fact that households
17 Regarding dropouts, Panel A of Appendix Table A5 indicates that while there is an immediate increase in the probability of wage employment of 23.9 percentage points in 2006, wage income falls by 0.85 percent. A total (statistically significant joint F-test) negative effect on income from entrepreneurial activities of 1.40 percent and persistent negative effect on food expenditure of 0.10 percent in 2009 are also observed. It is also interesting to see a total positive effect of 0.87 percent on medical care spending as well as an immediate negative effect of 0.54 percent in 2006 and sustained positive effect of 1.46 percent in 2009 on education spending.
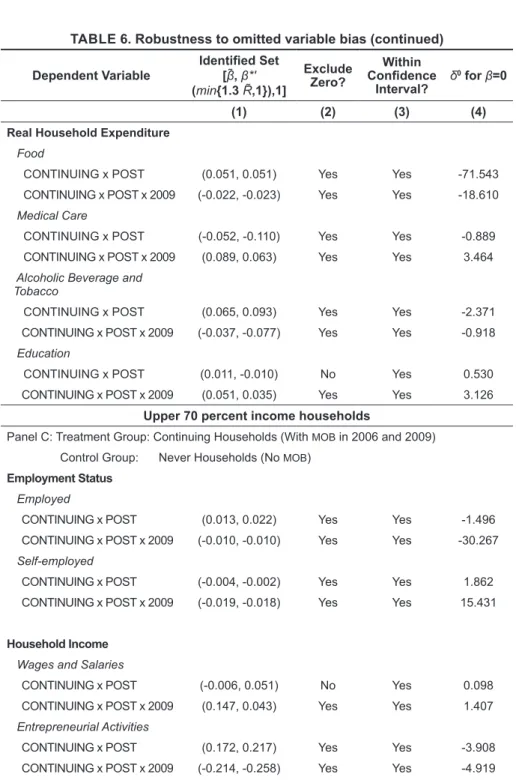
Therefore, we see more households working outside the home to mitigate declining real expenditure and supplement their borrowing and reach the level of resources sufficient to finance an investment that may be unacceptably large [Banerjee et al. 2015] has the presence of microfinance institutions increased the likelihood of informal borrowing by households; or that of Tarozzi et al. Regarding the impact on the top 70 percent of incomes and on non-poor households, the results in Panel C of Table 5 indicate that there is no significant impact on welfare measures – real expenditure on food, medical care, alcoholic beverages and tobacco, and education, as well as The likelihood and income from entrepreneurial and wage and salary activities of continuation of non-poor households are recorded.
Tests on omitted variables
The cost of borrowing from some of these institutions is occasionally either higher or more frequent payment schedules, reducing income from entrepreneurial activities. These results are perhaps not entirely surprising, since microfinance does not have an effect on those who are too unproductive to be entrepreneurs, and the funds lent are too small to significantly affect the livelihoods of the highly educated and non-poor borrowers [Buera et al . For example, the coefficient bound interval for the effect of MOB presence on the probability of self-employment in panel A of Table 6 does not contain 0 and is within the confidence interval of the controlled effect, implying that the estimate is robust.
Similarly, the value of δ20 = 8.42 indicates that the unobservables must be 8.42 times more important than the control variables to bring the treatment effect to 0. Robustness to omitted variable bias of the effects of long-term bank presence oriented from microfinance. Panel A: Treatment Group: Continued Families (With MOB in 2006 and 2009) Control Group: Never Families (No MOB).
19 Tables presenting results for dropouts and newcomers are not included for brevity, but are available from the authors upon request. Panel B: Treatment group: Continued households (with MOB in 2006 and 2009) Control group: Never households (without MOB). Panel C: Treatment group: Continued households (with MOB in 2006 and 2009) Control group: Never households (without MOB).
The effect of treating income and consumption expenditure is not the percentage change, but for an arcsinh-linear specification with dummy independent variables from the IPW DID-FE regression. Column (2) indicates whether the identified set excludes the null, and column (3) reports whether the estimated bias-adjusted coefficient is within the confidence interval of the estimated controlled effect β̃. 2005] the proportionality coefficient that would be required to fully attribute the treatment effect to the influence of unobservable factors.
Policy insights
On the one hand, another microfinance product – micro-agri-agrarian credit up to ₱150,000 and loans that start small and grow gradually based on bank policies – is not easily accessible as it can only be obtained short-term (up to 12 months ) from those with multiple income-generating activities (ie, farm and off-farm), with agricultural activities at least two years in operation, and from existing borrowers with good track records based on bank policies. As such, from a policy perspective, there is a need to not only facilitate the graduation of microfinance clients, but also to aim for microfinance borrowers to engage in activities that have absorptive capacity for additional capital, so that microfinance products and services not only help them increase their earnings above a living income. Credit should be accompanied by complementary development services, such as linking entrepreneurs to markets (eg agricultural value chain financing, market adaptation or trade fairs); product development and marketing training; and entrepreneurship education.
Such initiatives would promote product diversification, integrate microfinance borrowers into broader high-value markets, and strengthen borrowers' business skills, enabling borrowers to operate profitably, increasing business opportunities, and preventing business closures.
Conclusion
Such an initiative in the Philippines is currently being implemented by CARD Mutually Reforming Institutions (CARDMRI), which provides microloans and assists clients who have evolved into medium or large-scale entrepreneurs and need larger loans from universal/commercial and thrift businesses. banks. We propose to check whether the magnitude will increase and whether the direction of the impacts will be the same: (1) if the actual MOB household borrowing is used instead of the presence of MOB and (2) in the presence of non-governmental microfinance providers in the municipalities. where the MOBs are. The Impacts of Microfinance: Evidence from Joint Liability Loans in Mongolia”, American Economic Journal: Applied Economics.
Mullainathan [2010] "The Shape of Temptation: Implications for the Economic Lives of the Poor", National Bureau of Economic Research (NBER) Working Paper 15973. Zinman [2010] "Expanding Credit Access: Using Random Supply Decisions to Estimate the Impacts" , The Review of Financial Studies. Infantando [2008] “Impact of Microfinance on Rural Households in the Philippines”, Institute for Development Studies Bulletin.
2005] “From Margin to Mainstream: Microfinance, Women's Work and Social Change in the Philippines”, Urban Anthropology and Studies of Cultural Systems and Global Economic Development. Khandker [1998] “The impact of group-based credit programs on poor households in Bangladesh: does the gender of participants matter?”, Journal of Political Economy. Effects of microfinance-oriented banks on households with all incomes: IPW DID-FE Employment statusIncomeReal expenses EmployedSelf-employedWages and salaries.
Treatment is defined as the presence of MOBs in the municipality where the household resides. Heterogeneous Effects of Microfinance-Oriented Bank Presence on Bottom 30 Percent Income Households: IPW DID-FE Employment Status IncomeReal Expenditures Employee Self-Employed Wages and Salaries. Treatment is defined as the presence of MOBs in the municipality where the poor household resides.