The Philippine Review of Economics
ISSN 1655-1516 June 2022 Volume LVIX No. 1
Editor-in-Chief JOSEPH J. CAPUNO
Editorial Advisory Board EMMANUEL DE DIOS
RAUL V. FABELLA HAL CHRISTOPHER HILL
CHARLES Y. HORIOKA KIAN GUAN LIM ROBERTO S. MARIANO JOHN VINCENT C. NYE GERARDO P. SICAT JEFFREY G. WILLIAMSON
Associate Editors LAWRENCE B. DACUYCUY FRANCISCO G. DAKILA JR.
JONNA P. ESTUDILLO MARIA S. FLORO GILBERTO M. LLANTO
Managing Editor HONLANI RUTH R. RUFO
ARTICLES IN THIS ISSUE The impacts of secondary
education reforms on schooling and income of women and men in the Philippines
Ma. Laarni D. Revilla Jonna P. Estudillo
Who benefits from Dual Training Systems? Evidence from the Philippines
Takiko Igarashi Pablo Acosta
The impact of Philippine monetary policy on domestic prices and output:
evaluating the country’s transmission channels
Sanjeev Parmanand
The BSP’s Forecasting and
Policy Analysis System Zeno Ronald R. Abenoja Jasmin E. Dacio Sarah Jane A. Castañares Jan Christopher G. Ocampo Mark Rex S. Romaraog
Azcárraga’s critique of mercantilism: trade as an engine of growth
Emmanuel S. de Dios
BOOK REVIEW Trauma to triumph: rising from the ashes of the Asian Financial Crisis
Sarah Lynne S. Daway- Ducanes
The Philippine Review of Economics
A joint publication of the University of the Philippines
School of Economics and the Philippine Economic Society Southeast Asia in the global
economy
Philippine inequality across the twentieth century Philippine policy reforms in infrastructure development he fis al ro ram n re ent Philippine history
Amado Castro and gender equity in education Quality, equality and recent education reforms
Non-inclusive growth, the rofit mot e an the ase for inclusive business A memoir of the young UP School of Economics
Remembering Amado Castro
Amado Castro: economist, educator
The early years of the University of the Philippines School of Economics Dr. Amado Castro
A loving tribute to Dr. Amado A. Castro
Hal C. Hill
Jeffrey G. Williamson
Dante B. Canlas
Benjamin E. Diokno
Vicente B. Paqueo and Aniceto C. Orbeta
Edita A. Tan
Niceto S. Poblador
Gerardo P. Sicat
Benito Legarda, Jr.
Cesar E. A. Virata
Jeffrey G. Williamson
Bernardo M. Villegas Zorayda Amelia C. Alonzo Editor-in-Chief
EMMANUEL S. DE DIOS
Editorial Advisory Board RAUL V. FABELLA
HAL C. HILL CHARLES Y. HORIOKA
KIAN GUAN LIM ROBERTO S. MARIANO JOHN VINCENT C. NYE GERARDO P. SICAT JEFFREY G. WILLIAMSON
Associate Editors DANTE B. CANLAS RAMON L. CLARETE LAWRENCE B. DACUYCUY FRANCISCO G. DAKILA JR.
CRISTINA C. DAVID JONNA P. ESTUDILLO
MARIA S. FLORO GILBERTO M. LLANTO
ANICETO C. ORBETA ERNESTO M. PERNIA STELLA LUZ A. QUIMBO
Managing Editor HONLANI RUTH J. RABE
SPECIAL ISSUE IN HONOR OF AMADO A. CASTRO Issue Editors
ARTICLES IN THIS ISSUE
Emmanuel S. de Dios Emmanuel F. Esguerra
MEMORIALS
Aims and Scope: The Philippine Review of Economics (pre) invites theoretical and empirical articles on economics and economic development. Papers on the Philippines, Asian and other developing economies are especially welcome. Book reviews will also be considered.
The pre is published jointly by the up School of Economics and the Philippine Economic Society. Its contents are indexed in the Journal of Economic Literature, EconLit, and RePEc.
pre’s readership includes economists and other social scientists in academe, business, government, and development research institutions.
Publication Information: The pre (issn 1655-1516) is a peer-reviewed journal published every June and December of each year. A searchable database of published articles and their abstracts is available at the pre website (http://pre.econ.upd.edu.
ph).
Subscription Information:
Subscription correspondence may be sent to the following addresses:
pssc Central Subscription Service,
psscenter, Commonwealth Avenue, 1101, Diliman, Quezon City, Philippines.
P.O. Box 205, up Post Office, Diliman, Quezon City, Philippines 1101
PHONE: 922-9627, FAX: 924-4178/926-5179
Submissions: Authors may submit their manuscripts to addresses below:
[email protected] or [email protected]
The Editor, The Philippine Review of Economics, Rm 237, School of Economics, University of the Philippines, Diliman, Quezon City, 1101.
Manuscripts must be written in English and in ms Word format.
All graphs and tables must be in Excel format. Submission of a manuscript shall be understood by the pre as indicating that the manuscript is not under consideration for publication in other journals. All submissions must include the title of the paper, author information, an abstract of no more than 150 words, and a list of 3–4 keywords. Complete guidelines can be viewed in pre’s website.
Copyright: The Philippine Review of Economics is protected by Philippine copyright laws. Articles appearing herein may be reproduced for personal use but not for mass circulation. To reprint an article from PRE, permission from the editor must be sought.
EDITOR-IN-CHIEF Emmanuel S. de Dios UP SCHOOL OF ECONOMICS EDITORIAL ADVISORY BOARD Raul V. Fabella
UP SCHOOL OF ECONOMICS Hal C. Hill
AUSTRALIAN NATIONAL UNIVERSITY Charles Y. Horioka
ASIAN GROWTH RESEARCH INSTITUTE (KITAKYUSHU)
Kian Guan Lim
SINGAPORE MANAGEMENT UNIVERSITY Roberto S. Mariano UNIVERSITY OF PENNSYLVANIA John Vincent C. Nye GEORGE MASON UNIVERSITY Gerardo P. Sicat UP SCHOOL OF ECONOMICS Jeffrey G. Williamson HARVARD UNIVERSITY ASSOCIATE EDITORS Dante B. Canlas UP SCHOOL OF ECONOMICS Ramon L. Clarete UP SCHOOL OF ECONOMICS Lawrence B. Dacuycuy DE LA SALLE UNIVERSITY Francisco G. Dakila Jr.
BANGKO SENTRAL NG PILIPINAS Cristina C. David PHILIPPINE INSTITUTE
FOR DEVELOPMENT STUDIES Jonna P. Estudillo NATIONAL GRADUATE INSTITUTE
FOR POLICY STUDIES (TOKYO) Maria S. Floro
AMERICAN UNIVERSITY (WASHINGTON D.C.) Gilberto M. Llanto
PHILIPPINE INSTITUTE FOR DEVELOPMENT STUDIES Aniceto C. Orbeta PHILIPPINE INSTITUTE
FOR DEVELOPMENT STUDIES Ernesto M. Pernia UP SCHOOL OF ECONOMICS Stella Luz A. Quimbo UP SCHOOL OF ECONOMICS MANAGING EDITOR Honlani Ruth J. Rabe UP SCHOOL OF ECONOMICS COPY EDITOR Dinna Dayao
and the Philippine Economic Society (PES)
EDITOR IN CHIEF Joseph J. Capuno UP SCHOOL OF ECONOMICS EDITORIAL ADVISORY BOARD Emmanuel de Dios
UP SCHOOL OF ECONOMICS Raul V. Fabella UP SCHOOL OF ECONOMICS Hal Christopher Hill AUSTRALIAN NATIONAL UNIVERSITY Charles Y. Horioka KOBE UNIVERSITY Kian Guan Lim
SINGAPORE MANAGEMENT UNIVERSITY Roberto S. Mariano UNIVERSITY OF PENNSYLVANIA John Vincent C. Nye GEORGE MASON UNIVERSITY Gerardo P. Sicat UP SCHOOL OF ECONOMICS Jeffrey G. Williamson HARVARD UNIVERSITY ASSOCIATE EDITORS Lawrence B. Dacuycuy DE LA SALLE UNIVERSITY Francisco G. Dakila Jr.
BANGKO SENTRAL NG PILIPINAS Jonna P. Estudillo UNIVERSITY OF THE PHILIPPINES Maria S. Floro
AMERICAN UNIVERSITY (WASHINGTON D.C.) Gilberto M. Llanto
PHILIPPINE INSTITUTE FOR DEVELOPMENT STUDIES
MANAGING EDITOR Honlani Ruth R. Rufo UP SCHOOL OF ECONOMICS
Aims and Scope: The Philippine Review of Economics (PRE) invites theoretical and empirical articles on economics and economic development. Papers on the Philippines, Asian and other developing economies are especially welcome. Book reviews will also be considered.
The PRE is published jointly by the UP School of Economics and the Philippine Economic Society. Its contents are indexed in the Journal of Economic Literature, EconLit, and RePec. PRE’s readership includes economists and other social scientists in academe, business, government, and development research institutions.
Publication Information: The PRE (ISSN 1655-1516) is a peer- reviewed journal published every June and December of each year.
A searchable database of published articles and their abstracts is available at the PRE website (http://pre.econ.upd.edu.ph).
Subscription Information:
Subscription correspondence may be sent to the following addresses:
• PSSC Central Subscription Service,
PSSCenter, Commonwealth Avenue, 1101, Diliman, Quezon City, Philippines.
P.O. Box 205, UP Post Office, Diliman, Quezon City, Philippines 1101
PHONE: 922-9627, FAX: 924-4178/926-5179
Submissions: Authors may submit their manuscripts to the addresses below:
• [email protected] or [email protected]
• The Editor, The Philippine Review of Economics, Rm 237, School of Economics, University of the Philippines, Diliman, Quezon City, 1101.
Manuscripts must be written in English and in MS Word format.
All graphs and tables must be in Excel format. Submission of a manuscript shall be understood by the PRE as indicating that the manuscript is not under consideration for publication in other journals. All submissions must include the title of the paper, author information, an abstract of no more than 150 words, and a list of 3–4 keywords. Complete guidelines can be viewed in the PRE’s website.
Copyright: The Philippine Review of Economics is protected by Philippine copyright laws. Articles appearing herein may be reproduced for personal use but not for mass circulation. To reprint an article from PRE, permission from the editor must be sought.
Acknowledgements: The PRE gratefully acknowledges the financial support towards its publication provided by the Philippine Center for Economic Development (PCED). The Review nonetheless follows an independent editorial policy. The articles published reflect solely the editorial judgement of the editors and the views of their respective authors.
2017 OFFICERS AND BOARD OF DIRECTORS
PRESIDENT Jose Camacho Jr.
UNIVERSITY OF THE PHILIPPINES LOS BAÑOS VICE PRESIDENT
Majah-Leah Ravago
UNIVERSITY OF THE PHILIPPINES DILIMAN SECRETARY
Ronald Mendoza ATENEO SCHOOL OF GOVERNMENT TREASURER
Emilio Neri Jr.
BANK OF THE PHILIPPINE ISLANDS MEMBERS
Victor Abola
UNIVERSITY OF ASIA AND THE PACIFIC Cristina Bautista
ATENEO DE MANILA UNIVERSITY Kevin Chua
WORLD BANK
Lawrence Dacuycuy DE LA SALLE UNIVERSITY Lawrence Fernandez MERALCO
George Manzano
UNIVERSITY OF ASIA AND THE PACIFIC Stella Quimbo
PHILIPPINE COMPETITION COMMISSION IMMEDIATE PAST PRESIDENT Rosemarie Edillon
NATIONAL ECONOMIC AND DEVELOPMENT AUTHORITY
PHILIPPINE REVIEW OF ECONOMICS Emmanuel de Dios
EDITOR
COUNCIL OF ADVISERS Romeo Bernardo
LAZARO, BERNARDO, TIU AND ASSOCIATES Raul Fabella
UNIVERSITY OF THE PHILIPPINES DILIMAN Cielito Habito
ATENEO DE MANILA UNIVERSITY Ernest Leung
Solita Collas-Monsod
UNIVERSITY OF THE PHILIPPINES DILIMAN Cesar Virata
C. VIRATA AND ASSOCIATES
Founded 1961
The Philippine Economic Society (PES) was established in August 1962 as a nonstock, nonprofit professional organization of economists.
Over the years, the PES has served as one of the strongest networks of economists in the academe, government, and business sector.
Recognized in the international community of professional economic associations and a founding member of the Federation of ASEAN Economic Associations (FAEA), the PES continuously provides a venue for open and free discussions of a wide range of policy issues through its conferences and symposia.
Through its journal, the Philippine Review of Economics (PRE), which is jointly published with the UP School of Economics, the Society performs a major role in improving the standard of economic research in the country and in disseminating new research findings.
At present the society enjoys the membership of some 800 economists and professionals from the academe, government, and private sector.
who pays the lifetime membership dues shall be granted lifetime membership and shall have the rights, privileges, and responsibilities of a regular member, except for the payment of the annual dues.
years of age or older who have obtained at least a bachelor’s degree in economics, or who, in the opinion of the Board of Directors, have shown sufficient familiarity and understanding of the science of economics to warrant admission to the Society. Candidates who have been accepted shall become members of the Society only upon payment of annual dues for the current year.
time college or graduate students majoring in economics. Affiliation for junior membership is coursed through the Junior Philippine Economic Society (JPES).
For more information, visit: www.phileconsociety.org.
BOARD OF TRUSTEES 2022 PRESIDENT
Charlotte Justine Diokno-Sicat PHILIPPINE INSTITUTE FOR DEVELOPMENT
STUDIES
VICE PRESIDENT Philip Arnold P. Tuaño ATENEO DE MANILA UNIVERSITY
SECRETARY
Ruben Carlo O. Asuncion UNION BANK OF THE PHILIPPINES
TREASURER Kevin C. Chua WORLD BANK
BOARD MEMBERS Agham C. Cuevas
UNIVERSITY OF THE PHILIPPINES-LOS BAÑOS Jovi C. Dacanay
UNIVERSITY OF ASIA AND THE PACIFIC Sarah Lynne S. Daway-Ducanes UNIVERSITY OF THE PHILIPPINES-DILIMAN Alice Joan G. Ferrer
UNIVERSITY OF THE PHILIPPINES-VISAYAS Emilio S. Neri, Jr.
BANK OF THE PHILIPPINE ISLANDS Majah-Leah V. Ravago ATENEO DE MANILA UNIVERSITY Marites M. Tiongco DE LA SALLE UNIVERSITY
EX-OFFICIO BOARD MEMBERS Faith Christian Q. Cacnio BANGKO SENTRAL NG PILIPINAS IMMEDIATE PAST PRESIDENT Joseph J. Capuno
UNIVERSITY OF THE PHILIPPINES-DILIMAN EDITOR, PHILIPPINE REVIEW OF ECONOMICS
The Philippine Review of Economics
Vol. LVIX No. 1 June 2022
ISSN 1655-1516
DOI: 10.37907/ERP2202J
1 The impacts of secondary education reforms on schooling and income of women and men in the Philippines
Ma. Laarni D. Revilla Jonna P. Estudillo
26 Who benefits from Dual Training Systems?
Evidence from the Philippines Takiko Igarashi
Pablo Acosta
46 The impact of Philippine monetary policy on domestic prices and output: evaluating the country’s transmission channels Sanjeev Parmanand
77 The
BSP’sForecasting and Policy Analysis System Zeno Ronald R. Abenoja
Jasmin E. Dacio
Sarah Jane A. Castañares Jan Christopher G. Ocampo Mark Rex S. Romaraog
108 Azcárraga’s critique of mercantilism: trade as an engine of growth
Emmanuel S. de Dios 156 Book Review
Sarah Lynne S. Daway-Ducanes
The
BSP'sForecasting and Policy Analysis System
Zeno Ronald R. Abenoja*
Jasmin E. Dacio*
Sarah Jane A. Castañares*
Jan Christopher G. Ocampo*
Mark Rex S. Romaraog*
Bangko Sentral ng Pilipinas**
The Bangko Sentral ng Pilipinas (BSP) subscribes to the Forecasting and Policy Analysis System (FPAS) as the framework for macroeconomic forecasting and analysis in support of monetary policy formulation. FPAS is a standard framework, adopted by many inflation-targeting central banks, that organizes the generation, consolidation, and analysis of economic information relavant to monetary policy formulation. This paper aims to describe how macroeconomic forecasts and policy simulations are generated to support monetary policy analysis and formulation at the BSP. To this end, this article summarizes the main features of the process involved in generating the baseline forecasts, alternative scenarios, and policy simulations. We highlight the complementary roles played by the BSP’s suite of models and the expert judgement from the sector specialists as well as the importance of forecast communication in the transmission of monetary policy. Finally, we present a systematic evaluation of the forecasting performance of the BSP from 2010 to 2020 together with some of the lessons in forecasting during the COVID-19 pandemic and the recent efforts to improve the BSP’s FPAS.
JEL classification: C5, E5
Keywords: monetary policy, macroeconomic modelling, forecasting, inflation targeting
* Address all correspondence to [email protected], [email protected], [email protected], [email protected], and [email protected].
** Disclaimer: The views expressed in this paper are those of the authors and do not necessarily represent the official views of the BSP.
1. Introduction
Since the adoption of inflation targeting (IT) as the framework for monetary policy in 2002, forecasting inflation with reasonable precision had become a key priority for the Bangko Sentral ng Pilipinas (BSP) due to the forward-looking nature of monetary policy formulation. IT central banks, including the BSP, formulate policies generally based on a reasonable picture of the macroeconomy and risks surrounding it over the policy horizon.
The use of models establishes a structure for policy analysis by providing a theoretical framework to understand and summarize key economic relationships.
Models are also natural storytelling devices that facilitate external communications.
The BSP uses a variety of methodologies ranging from purely time series techniques to semi-structural and theoretical models. These are used for generating forecasts of inflation and other key macroeconomic variables to guide the economic surveillance activities of the BSP in aid of monetary policy decision making as well as policy evaluation.
BSP modelling efforts subscribe to a “thick” modelling philosophy by maintaining a suite of models for forecasting and policy simulation. According to Pagan [2003], it is desirable to maintain a diverse set of models since no single model can address all policy issues. In addition, the selection of appropriate model requires a careful balance of the trade-off between theoretical and empirical coherence. The “thick” modelling approach recognizes the natural limitations of models to (i) forecast accurately the exact path of the variables over the forecast horizon; and (ii) adequately address or cover all policy issues in the economy. In other words, this modelling approach addresses the inherent trade- off between model tractability and model size and depth that allow for richer structural features. In recognizing these limitations, the suite-of-models approach offers flexibility to address different policy issues and forecasting requirements of monetary policy analysis.
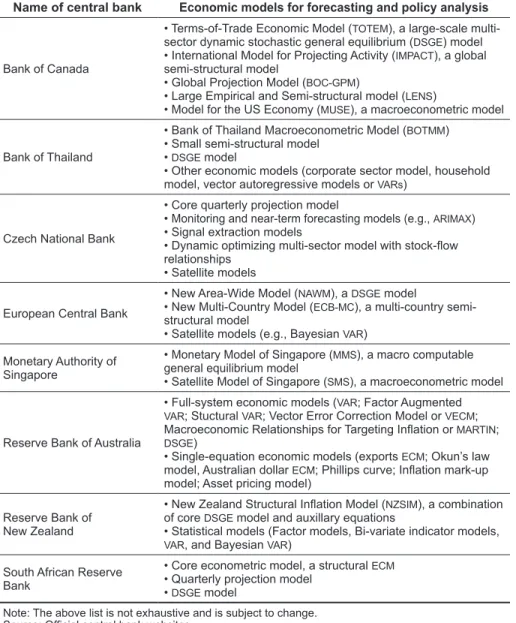
The use of macroeconometric models for forecasting and policy analysis is common in IT central banks which combine fully-structural and semi-structural types of models to generate their baseline projections. Thus, the BSP’s pluralistic approach to modelling is consistent with the practice among central banks of maintaining various models (i.e., economy-wide or specific to some sectors such as oil and housing market, among others) for forecasting as well as for scenario analysis and risk assessment (Table 1). The pluralistic approach to macroeconomic modelling is similarly employed by the International Monetary Fund (IMF) to address a broad range of policy issues globally and in individual countries [Isard 2000]. Such policy questions include the spillover effects of policy changes, implications of rise in global oil prices, and sustainability of a country’s pension system, among others. The utilization of nowcasting models along with the judgment of sector specialists is also a common practice among central banks as part of their forecasting process.
TABLE 1. Economic models for forecasting and policy analysis at various central banks
Name of central bank Economic models for forecasting and policy analysis
Bank of Canada
• Terms-of-Trade Economic Model (TOTEM), a large-scale multi- sector dynamic stochastic general equilibrium (DSGE) model
• International Model for Projecting Activity (IMPACT), a global semi-structural model
• Global Projection Model (BOC-GPM)
• Large Empirical and Semi-structural model (LENS)
• Model for the US Economy (MUSE), a macroeconometric model
Bank of Thailand
• Bank of Thailand Macroeconometric Model (BOTMM)
• Small semi-structural model
• DSGE model
• Other economic models (corporate sector model, household model, vector autoregressive models or VARs)
Czech National Bank
• Core quarterly projection model
• Monitoring and near-term forecasting models (e.g., ARIMAX)
• Signal extraction models
• Dynamic optimizing multi-sector model with stock-flow relationships
• Satellite models
European Central Bank
• New Area-Wide Model (NAWM), a DSGE model
• New Multi-Country Model (ECB-MC), a multi-country semi- structural model
• Satellite models (e.g., Bayesian VAR) Monetary Authority of
Singapore
• Monetary Model of Singapore (MMS), a macro computable general equilibrium model
• Satellite Model of Singapore (SMS), a macroeconometric model
Reserve Bank of Australia
• Full-system economic models (VAR; Factor Augmented VAR; Stuctural VAR; Vector Error Correction Model or VECM; Macroeconomic Relationships for Targeting Inflation or MARTIN; DSGE)
• Single-equation economic models (exports ECM; Okun’s law model, Australian dollar ECM; Phillips curve; Inflation mark-up model; Asset pricing model)
Reserve Bank of New Zealand
• New Zealand Structural Inflation Model (NZSIM), a combination of core DSGE model and auxillary equations
• Statistical models (Factor models, Bi-variate indicator models, VAR, and Bayesian VAR)
South African Reserve Bank
• Core econometric model, a structural ECM
• Quarterly projection model
• DSGE model
Note: The above list is not exhaustive and is subject to change.
Source: Official central bank websites.
It should be emphasized that the BSP does not employ models as black boxes. Significant inputs and judgment from sector experts and management are incorporated in the forecasting and modelling exercises to form a coherent narrative. At the same, there is recognition of the inherent uncertainty in the forecasting process, due in part to the complexity of the operating environment along with model/parameter uncertainty. This is mitigated by considering
alternative scenarios for the assumptions used and subjecting the baseline forecasts to various shocks. A key output of the forecasting process is an assessment of risks over the policy horizon as well as confidence intervals for key variables, typically shown as fan charts.
The increased role of judgment and risk assessment in the forecasting process warrants further improvements. Recent research has shown that the combination of model-based and judgment-based forecasts have performed relatively well in terms of out-of-sample forecasting. The role of subjective judgement in forecasting is particularly useful during unusual events (e.g., oil crisis, currency crisis, terrorist attack, etc.) in which estimation of the impact could require more information to complement historical statistics [Sims 2002]. Thus, a more formal framework on how to combine various model forecasts and expert judgment of the staff and policymakers could lead to improvements in the central bank’s analytical capacities [Adolfson et al. 2007].1
This paper summarizes the main features of the process involved in generating the baseline forecasts, alternative scenarios, and policy simulations in the BSP. We highlight the complementary roles played by the BSP’s suite of models and the expert judgement from both the sector specialists and top officials as well as the importance of sufficiently communicating the inflation outlook and risks in improving the transmission of monetary policy. We also present a systematic evaluation of the forecasting performance of the BSP from 2010 to 2020 together with some of the lessons in forecasting during the COVID-19 pandemic and the recent efforts to improve the BSP’s suite of macroeconomic models.
2. Forecasting and Policy Analysis System (FPAS)
The FPAS is the standard framework adopted by many IT central banks to systematically organize monetary policy decision-making [Clinton et al.
2017]. IT central banks in the 1990s pioneered the systematic use of tools and processes in setting their interest rates. The framework covers the efficient provision and generation of all economic information, including forecasts for and policy simulations on macroeconomic variables, relevant to monetary policy formulation. It also provides guidance on the organizational structure of the forecasting team, sources of external assumptions, schedule of deadlines and meetings for each forecast exercise, database management, and information technology requirements.
1 Adolfson et al. [2007] illustrated specific episodes when expert judgment complemented model-based forecasts at the Sveriges Riksbank (the central bank of Sweden). For instance, in Q2 2002, the official forecasts of Riksbank incorporated the sector experts’ view that the food price increases due to the mad cow and foot and mouth diseases represent a persistent shock to price level but small effects in annual inflation.
In contrast, the purely model-generated forecasts from DSGE overestimated the impact of food price shock to inflation in 2001 and 2002.
Laxton et al. [2009] identified the benefits of establishing an FPAS. This includes improved internal communications between the staff, management, and policy decision-makers, ease in identifying and communicating policy issues, enhanced ability to systematically review the previous forecast and policy decisions, development of technical skills of bank personnel involved in surveillance, forecasting, and policy analysis, improvements in institutional knowledge, and greater transparency behind the monetary policy decisions.
The framework involves the following major components (Adrian et al.
[2018]; Mæhle et al. [2021]):
1. Establish a forecasting team responsible for model development, near-term forecasting (current and one-quarter ahead), and medium- term forecasting.
2. Develop a reporting system based on a key set of macroeconomic variables so that everyone involved in the process will be informed about how new information affects the near-term inflation forecast and the implications if any for the longer-term outlook.
3. Develop a projection model of the economy that embodies policymakers view about the monetary policy transmission mechanism in the standard set of shocks that affect the economy.
4. Develop a consistent model-based macroeconomic forecast. This includes assessing the risks to the previous official baseline forecast and using that to propose changes to the official baseline forecast.
5. Develop measures of uncertainty in the forecast such as model-based confidence intervals. These measures should be used to communicate the extent of this uncertainty both internally and to the public.
6. Study specific risks in the baseline forecast in developing contingency plans for reacting to new information.
2.1. Features of the BSPFPAS
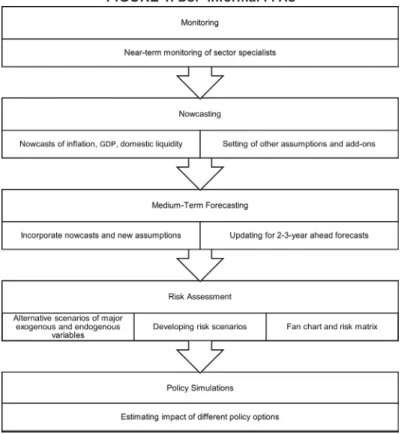
Figure 1 illustrates the informal FPAS of the BSP. This covers the overall process for economic surveillance, generation of near-term and medium-term macroeconomic forecasts, and risk assessment in support of monetary policy analysis and formulation at the BSP.
2.2. Monetary policy analysis at the BSP2
Monetary policy analysis at the BSP is non-linear and iterative with the end goal of generating a comprehensive and coherent narrative on factors underpinning the policy decision. The forecasting process starts about a month before the Monetary Board (MB) monetary policy meeting. The Technical Staff
2 Please refer to the FAQ on Inflation Targeting for a more detailed description of the inflation targeting framework of the BSP available online [“The BSP and Price Stability” 2020].
(TS) of the BSP’s Advisory Committee (AC)3 comprising of sector experts, meets to discuss recent developments and possible risks in the key economic sectors that influence the outlook for inflation and growth in the country. Information from these discussions is incorporated by the DER forecasting team in the baseline projection and risk assessment. The inflation outlook and alternative scenarios are finalized when the TS reconvenes about two weeks after.
During the second technical level meeting, the DER forecasting team may be asked to revise its baseline estimates to incorporate the consensus view of the TS on the inflation outlook. The risks collectively identified by the TS will then be simulated using the BSP economic models to quantify their likely impact on the baseline projections. Table 2 shows a typical timeline of meetings on monetary policy analysis at the BSP.
3 The AC was formed as part of the institutional setting for inflation targeting. It is tasked to deliberate, discuss and make recommendations on monetary policy to the MB. The AC is composed of seven members and chaired by the BSP Governor. The other members include the Deputy Governors of the Monetary and Economics Sector, Corporate Services Sector, Financial Supervision Sector, and the Senior Assistant Governors of the Monetary Policy Sub-Sector, Financial Markets, and Office of Systematic Risk Management.
FIGURE 1. BSP informal FPAS
Source: Authors.
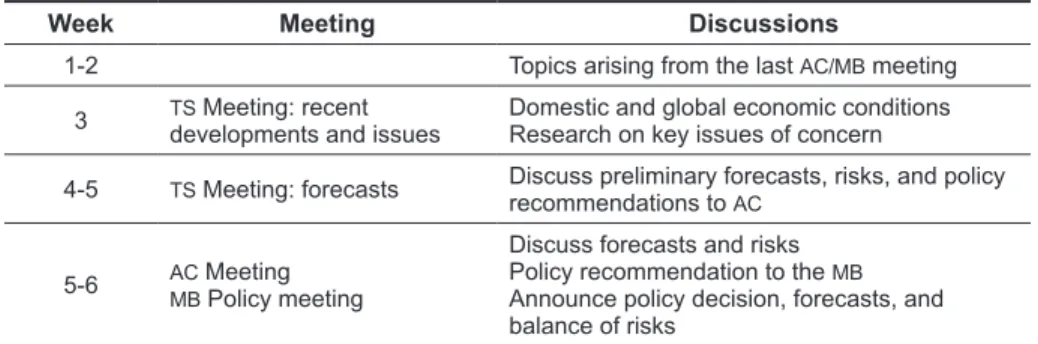
TABLE 2. Timeline of meetings
Week Meeting Discussions
1-2 Topics arising from the last AC/MB meeting
3 TS Meeting: recent
developments and issues Domestic and global economic conditions Research on key issues of concern
4-5 TS Meeting: forecasts Discuss preliminary forecasts, risks, and policy recommendations to AC
5-6 AC Meeting MB Policy meeting
Discuss forecasts and risks Policy recommendation to the MB Announce policy decision, forecasts, and balance of risks
Source: Authors.
The assessment of the TS on current macroeconomic conditions, baseline forecasts of key macroeconomic variables and risks surrounding the outlook as well as its policy recommendation are then presented to the AC during its scheduled policy review meeting. During the said meeting, the members of the AC will deliberate on the TS submissions and decide on their monetary policy recommendation to the MB. Members of the AC can suggest refinements to the forecasts or request additional scenario-building exercises or policy simulations to fully incorporate its view on the direction of the macroeconomy over the policy horizon. The policy recommendation of the AC is then submitted for discussion during the MB’s monetary policy meeting. Once approved by the MB during its monetary policy meeting, the staff forecasts are then considered as the BSP’s official forecasts, released to the public at the BSP’s press conference on monetary policy decision.
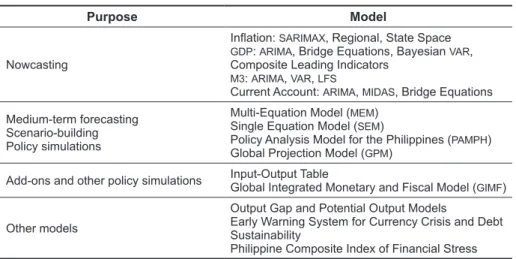
TABLE 3. BSP's suite of models
Purpose Model
Nowcasting
Inflation: SARIMAX, Regional, State Space GDP: ARIMA, Bridge Equations, Bayesian VAR, Composite Leading Indicators
M3: ARIMA, VAR, LFS
Current Account: ARIMA, MIDAS, Bridge Equations Medium-term forecasting
Scenario-building Policy simulations
Multi-Equation Model (MEM) Single Equation Model (SEM)
Policy Analysis Model for the Philippines (PAMPH) Global Projection Model (GPM)
Add-ons and other policy simulations Input-Output Table
Global Integrated Monetary and Fiscal Model (GIMF)
Other models
Output Gap and Potential Output Models
Early Warning System for Currency Crisis and Debt Sustainability
Philippine Composite Index of Financial Stress Source: Authors.
The BSP maintains a suite of models for forecasting and policy simulations with a view that no single and superior model could accurately forecast the exact path of economic variables or address all policy issues. This approach also recognizes the inherent trade-off between model tractability and model size and depth that allow for richer structural features. In recognizing these limitations, the suite-of-models approach offers flexibility to address different policy issues and forecasting requirements of monetary policy analysis. The BSP suite of models includes models used for near-term forecasting or nowcasting, medium-term forecasting, scenario building and policy simulations (Table 3).
2.3. Nowcasting models
Nowcasting models were developed to supplement the BSP’s medium-term forecasting models. The forecasts from nowcasting models are considered as initial conditions when generating the forecasts from the medium-term forecasting models. By providing a clearer picture of the state of the current quarter or current month than what is officially available due to lags in data releases, the use of nowcasts as initial conditions lead to improvements in medium-term forecast performance. The following describes the various nowcasting models that are currently in operation at the BSP.
2.3.1. Inflation
The Disaggregated Seasonal Autoregressive, Integrated, Moving Average (SARIMA) model with exogenous variables generates 1- to 3-month ahead forecasts for 30 select sub-components of the CPI. The sub-component forecasts are then combined to produce estimates for headline, core, and other inflation measures. Using a Seasonal Autoregressive Integrated Moving Average process with exogenous variables (SARIMAX), forecasts are derived from the univariate analyses of historical movements along with occasional structural features and seasonal factors. Some equations are supplemented by higher-frequency data on the actual domestic prices of agricultural commodities, petroleum products and electricity. Estimates from the model provide a more detailed and components- based approach to analyzing inflation outcomes [Allon 2015].
The Regional Inflation Model forecasts headline inflation at the regional level to gain a more granular perspective on the price dynamics across the 17 regions in the country. The model uses the univariate and multivariate support vector regression (SVR) algorithm, which is a machine learning model that is capable of both linear and non-linear regressions. Unlike the standard ordinary least squares approach, SVR offers more flexibility by directly specifying an acceptable tolerance level for the error term in the estimation. Meanwhile, the multivariate SVR extends the analysis by including a dummy variable for a supply shock as assessed through news analysis and expert judgement [Gabriel et al. 2020].
The state-space model provides nowcasts for headline and core inflation via time-varying regressions written in state-space form. The selected explanatory variables for headline inflation are weekly price variables that represent potential shocks to major components of the CPI. Meanwhile, regressors for core inflation are demand-based indicators that reflect long-term trends in economic fundamentals rather than transitory price fluctuations. The state-space specification then captures non-linearities in the relationships (i.e., coefficients) of the inflation measures and their high-frequency explanatory variables through the use of the Kalman filter as well as the simultaneous estimation of observed and unobserved variables (Allon et al. [forthcoming]).
2.3.2. GDP growth
The quarterly GDP growth nowcast that feeds into the forecasting models of BSP is a consolidated forecast derived from different nowcasting methods.
The methods considered for projecting the quarter-ahead GDP growth include:
autoregressive models at the major industry and expenditure level; ordinary least square regression using frequently (i.e., monthly) released contemporaneous and leading indicators of GDP. Indicators used in the models are total and industrial electricity sales, manufacturing volume of production index, national government revenue and expenditure, and passenger car sales from Chamber of Automotive Manufacturers of the Philippines, Inc. (CAMPI). The models also consider a dummy variable for elections in industries positively influenced by election- related activities.
Forecasts from each model are aggregated using the inverse of the mean square error derived from the forecasted and actual values. The results from these models along with staff judgment based on recent trends in high-frequency indicators are used as the one quarter-ahead projection. These models undergo regular updating and refinement. A more sectoral GDP nowcasting using industry-related indicators is preferred to provide a detailed analysis of the factors driving the GDP forecasts.
For example, data on overseas Filipino (OF) remittances, foreign trade statistics imports of consumer goods, and total number of employed persons are used as indicators to nowcast household final consumption expenditure.
2.3.3. Domestic liquidity
Various nowcasting models are also used to enhance the short-term forecasting performance of M3 growth. These time series models are based on high-frequency indicators, such as placements in the BSP’s liquidity facilities, government deposits in the BSP, and other financial market variables. Alternative estimates of the money multiplier are also used to generate alternative forecasts of M3 in different states. The average of these nowcasts is used as initial conditions for the M3 growth forecasts over the policy horizon.
2.4. Workhorse models
The Multi-Equation Model (MEM) and Single Equation Model (SEM) are the BSP’s workhorse models for macroeconomic forecasting and policy simulations.
These were developed together with Dr. Roberto S. Mariano of the University of Pennsylvania in 1997 and 2013, and have been reviewed and refined by the staff thereafter. Details on the earlier version of MEM and SEM along with an evaluation of their forecast accuracy were explained in Guinigundo [2005].
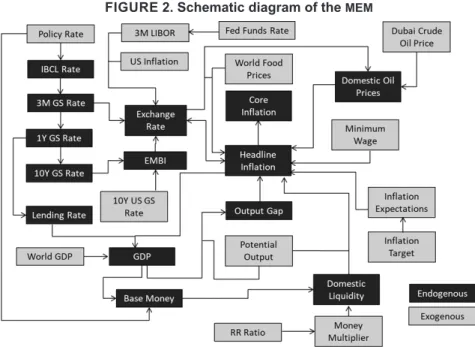
The MEM is a system of equations aimed at providing a comprehensive view of the macroeconomic outlook over the policy horizon by capturing the main aspects of monetary transmission in the country. The MEM consists of simultaneous equations, estimated largely using the error-correction mechanism (ECM), and other identities. The key relationships in the model are described in Figure 2. The equation for monthly year-on-year (Y-O-Y) inflation is the primary equation in the MEM. Under this structure, the long-run price level follows the quantity theory of money, augmented by supply-side variables, such as nominal wages, oil prices, and non-oil prices. Meanwhile, the short-run dynamics is determined by both supply-side and demand-side variables as well as inflation expectations. Other important equations in the MEM relate to GDP growth, domestic liquidity, exchange rate, and market interest rates.
FIGURE 2. Schematic diagram of the MEM
Source: Authors.
External variables, like world GDP growth, foreign interest rates, international food prices, and Dubai crude oil prices are treated exogenously in the MEM. World GDP growth follows the trade-weighted average of the country’s major trading partners. The growth assumptions for each trading partner as well as the path of international food prices are based on the projections from the IMF’s World Economic Outlook (WEO) and Global Projection Model Network (GPMN).
In addition, foreign interest rates and Dubai crude oil prices are assumed to follow the futures market. Shocks in the external sector affect inflation directly and indirectly. Higher international oil and food prices directly lead to higher inflation. Higher world GDP growth leads to higher domestic GDP growth, which boosts aggregate demand and leads to higher inflation. Higher foreign interest rates impact the interest parity condition, which could lead to depreciation of the peso and higher inflation.
The SEM specifies the monthly Y-O-Y inflation as a cointegrating relationship with a short-run ECM. Because the SEM is equivalent to the inflation equation in the MEM, it can be considered as the reduced-form version of the MEM. This results in a more consistent modelling approach between the two models. The major equations and identities of the MEM are shown in Table 4.
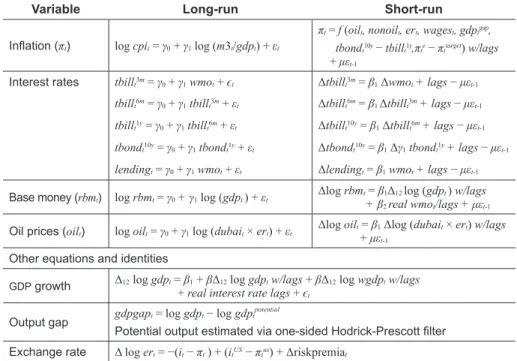
TABLE 4. Major equations and identities of the MEM
Variable Long-run Short-run
Inflation (πt) log cpit = γ0 + γ1 log (m3t/gdpt) + εt
πt = f (oilt, nonoilt, ert, wagest, gdptgap, tbondt10y − tbillt1y,πte − πttarget) w/lags + μεt-1
Interest rates tbillt3m = γ0 + γ1 wmot + ϵt Δtbillt3m = β1 Δwmot + lags − μεt-1
tbillt6m = γ0 + γ1 tbillt3m + εt Δtbillt6m = β1 Δtbillt3m + lags − μεt-1
tbillt1y = γ0 + γ1 tbillt6m + εt Δtbillt10y = β1 Δtbillt6m + lags − μεt-1
tbondt10y = γ0 + γ1 tbondt1y + εt Δtbondt10y = β1 Δγ1 tbondt1y + lags − μεt-1
lendingt = γ0 + γ1 wmot + εt Δlendingt = β1 wmot + lags − μεt-1
Base money (rbmt) log rbmt = γ0 + γ1 log (gdpt ) + εt Δlog rbmt = β1Δ12 log (gdpt ) w/lags + β2 real wmot/lags + μεt-1
Oil prices (oilt) log oilt = γ0 + γ1 log (dubait× ert) + εt Δlog oilt = β1 Δlog (dubait× ert) w/lags + μεt-1
Other equations and identities
GDP growth Δ12 log gdpt = β1 + βΔ12 log gdpt w/lags + βΔ12 log wgdpt w/lags + real interest rate lags + ϵt
Output gap gdpgapt = log gdpt − log gdptpotential
Potential output estimated via one-sided Hodrick-Prescott filter Exchange rate Δ log ert = −(it − πt ) + (itUS − πtus) + Δriskpremiat
Domestic liquidity m3t = mmt × bmt
Source: Authors.
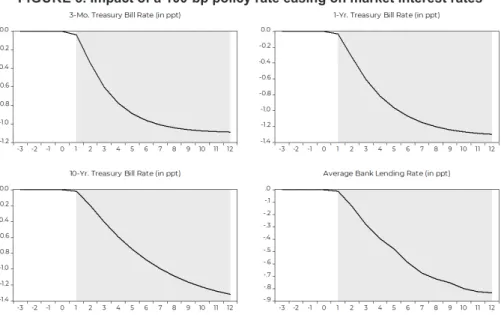
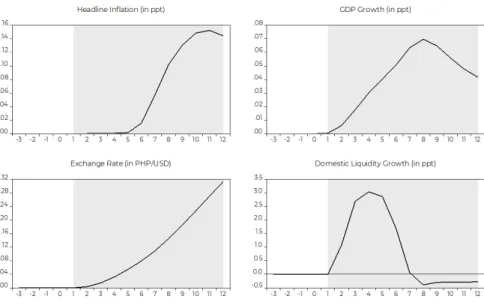
In the MEM, changes in the policy rate affect the economy through the standard transmission channels of monetary policy, i.e., interest rate, credit, exchange rate, and expectations. An easing of the policy rate is projected to result in lower market interest rates (Figure 3), faster domestic liquidity growth, a depreciation in the exchange rate, and higher GDP growth and inflation (Figure 4). However, over the forecast horizon, the BSP policy rate is assumed to remain at its current level.
FIGURE 3. Impact of a 100-bp policy rate easing on market interest rates
Source: BSP estimates.
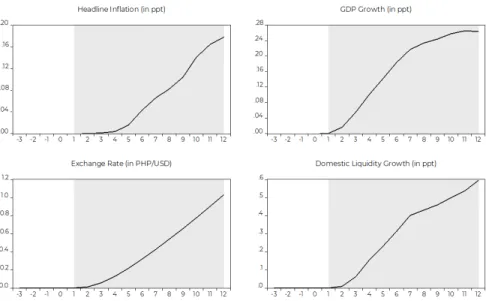
FIGURE 4. Impact of 100-bp policy rate easing on macroeconomic variables
Source: BSP estimates.
Meanwhile, a reduction in the reserve requirement ratio (RRR) leads to a corresponding increase in the money multiplier which raises domestic liquidity and inflation via the standard quantity theory of money identity. RRR adjustments affect the major macroeconomic variables with a lag, wherein the peak impact occurs after about four to six quarters (Figure 5).
2.5. Expert judgement
The models are not mechanically employed to produce the macroeconomic forecasts. Instead, the generation of the inflation outlook benefits from the careful surveillance and monitoring activities of DER sector specialists. Key developments that could influence the outlook for inflation and growth are incorporated as either add-ons to the baseline forecast or as inflation risks, depending on the probability assigned by the ACTS. Meanwhile, the expected impact of highly probable events that were not captured by the models (e.g., implementation of tax reforms), due to the inherent limitations of econometric models, are incorporated as add-ons in the baseline forecasts.
Consistent with the practice of flexible inflation targeting, the DER endeavors to provide a comprehensive assessment of the price environment in the baseline forecast and risk assessment. DER surveillance activities cover various sectors in both supply and demand side of inflation. On the supply side, developments in the agriculture and oil market, among others, are closely monitored given their large weights in the Philippine CPI basket and their considerable impact on inflation
FIGURE 5. Impact of a 100-bp RRR reduction on macroeconomic variables
Source: BSP estimates.
expectations [Españo and Santillan 2018]. On the demand side, domestic economic activity and external demand, along with liquidity conditions, are given a lot of focus. The DER is also watchful of possible early signs of second-round effects to check whether inflation pressures are becoming entrenched in the price dynamics.
At the same time, the DER leverages its representation in key committees and assessment of multilateral institutions.
• The TS regularly engages with counterparts from government agencies with direct involvement in sectors of importance to the price dynamics. This includes the Department of Agriculture (DA), Department of Energy (DOE), Department of Trade and Industry (DTI), Department of Labor and Employment (DOLE), Philippine Atmospheric, Geophysical and Astronomical Services Administration (PAGASA), and Land Transportation Franchising and Regulatory Board (LTFRB) among others.
• The sector experts also interact with industry and consumer groups through inter-agency meetings such as the National Price Coordinating Council and the National Wages and Productivity Commission. Insights from discussions with the National Food Authority (NFA) Council, Committee on Tariff and Related Matters (CTRM), and Export Development Council (EDC) are incorporated in the assessment as needed.
• On the analysis of the global oil market, which influences heavily trends in domestic energy prices, the TS relies heavily on the assessment of the International Energy Agency (IEA), US Energy Information Agency (EIA), Organization of the Petroleum Exporting Countries (OPEC), and IMF along with market reports from Capital Economics, and Oxford Economics.
• The TS also attends the regular meetings of the GPMN to track the latest developments in global economic conditions and global economic prospects, supplemented with analysis from the IMF.
More importantly, the AC and MB are part of the assessment process with the narrative on the inflation outlook and risks representing the consensus view.
Details on all the assumptions used to generate the baseline forecasts as well as risks to the inflation outlook are carefully presented to the AC and MB during the regular review of the BSP monetary policy. Comments and clarifications on these assumptions are addressed and taken into consideration in the subsequent review/
update of the inflation forecasts to ensure that the inflation forecasts and risks announced to the public represent the views and assessment of BSP policymakers.
2.6. Risk assessment
The forecasting team, together with the TS, evaluates the sensitivity of the baseline forecasts to various paths of the major exogenous variables, such as crude oil prices and world GDP growth. The baseline estimate is also subjected to shocks, implied by historical data, to determine the range of variability underpinned by the forecasts.
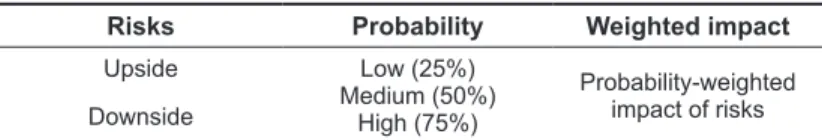
In addition, the TS considers different scenarios that pertain to upside and downside risks to the inflation outlook, which is summarized in a risk matrix (Table 5). The various scenarios are then assigned probability values based on the discussion at the technical level meeting involving the forecasting team and sector specialists. The outlook of other multilateral institutions as well as information gathered during inter-agency meetings are considered in determining the probabilities. Scenarios that have more than 75 percent probability of taking place over the forecast horizon are incorporated in the baseline. The estimated impact of each scenario is then multiplied by the assigned probabilities. The sum of the weighted impact for each year will indicate whether the risks to the outlook are balanced, on the upside, or on the downside.
TABLE 5. Risk matrix
Risks Probability Weighted impact
Upside Low (25%)
Medium (50%) High (75%)
Probability-weighted impact of risks Downside
Source: Authors.
The balance of risks to the outlook are graphically presented using a fan chart (Figure 6).4 The fan chart shows the probability of various outcomes for inflation over the forecast horizon. The darkest band depicts the central projection, which corresponds to the BSP’s baseline inflation forecast. It covers 25 percent of the probability distribution. Each successive pair of bands is drawn to cover a further 25 percent probability until 75 percent of the probability distribution is covered.
Lastly, the lightest band covers the lower and upper 90 percent of the probability distribution. The bands widen (i.e., “fan out”) as the time frame is extended, indicating increasing uncertainty about outcomes. The band in wire mesh depicts the inflation profile in the previous report.
The shaded area measures the range of uncertainty which is based on the deviation of forecasts from actual outcomes in the past years. The relative magnitude of the probability areas lying above and below the central projection captures the level of skewness based on the downside and upside shocks that affect the inflationary process over the next two years.
4 Central banks, such as the Bank of England (BOE) and the Czech National Bank (CNB), publish fan charts in their reports. CNB [2008] provides a detailed explanation on the methodology for construction of fan charts.