The community can mitigate the damage of the pandemic by arming itself with preventive public goods (PEPG). The probability of the good outcome (either no one gets infected, or everyone only gets asymptomatic infection) increases with the resources, assessed from the members' payments in the EDG, to finance the preventive public goods.
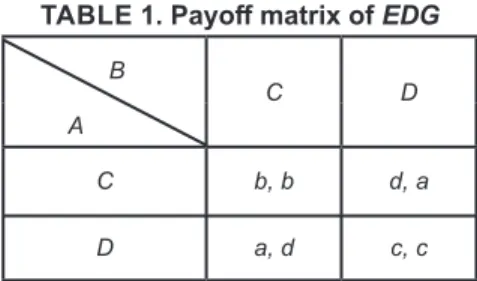
The Composite Game
This state of readiness is achieved and maintained by a threat level that exceeds Ostrom's threshold. Note that the magnitude of X may be a common subjective estimate in the public mind.
Summary
Spending on preventive public goods reduces the likelihood that a bad outcome of the pandemic will have to be financed from revenues estimated on the basis of individual payments to the EDG. The assumptions used in N+EDG reflect Ostrom's assumptions for successfully avoiding the tragedy of the commons.
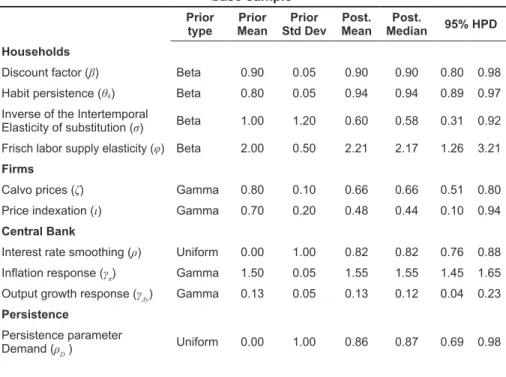
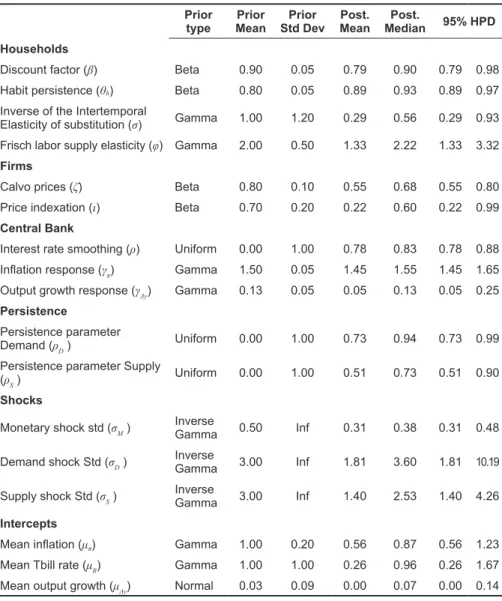
How influential are COVID–19 data points? A fresh look at an estimated small scale DSGE model for the Philippines
Introduction
Non-pandemic emergencies such as the African swine fever epidemic, which began to destroy the pig supply from the first quarter of 2020, caused price increases. In contrast to the above model features, this paper's main objective is to account for the empirical performance of the New Keynesian DSGE model when influential pandemic data points are included in the estimation sample.
The model
Maximizing (1) with respect to consumption and bonds, subject to the constraint (6), leads to the specification of the dynamic IS curve. The firm's marginal cost can be derived by minimizing the total labor cost subject to feasibility constraints.
Estimation of the New Keynesian System
Our entire sample period covers the quarters 2002Q1 to 2020Q4 to be consistent with BSP's inflation targeting framework.5 The first sample covers the period 2002Q1–2019Q4. Apparently, this sample is related to the start of the enhanced community quarantine (ECQ) protocol – the highest level of mobility restrictions.
Concluding remarks
Yilmaz [2009] “Measuring returns on financial assets and volatility spillovers, with application to global stock markets”, The Economic Journal.
Targeting ‘highly vulnerable’ households during strict lockdowns
Data
For the analysis, we use the various nationally representative household surveys of the Philippine Statistics Authority (PSA), especially the Labor Force Surveys (LFS), both pre-pandemic and during the pandemic. 4 From February 2021, in order to monitor the impact of the pandemic on employment, the PSA also conducts a monthly LFS in the months where there is no quarterly LFS.
Defining ‘highly vulnerable’ households
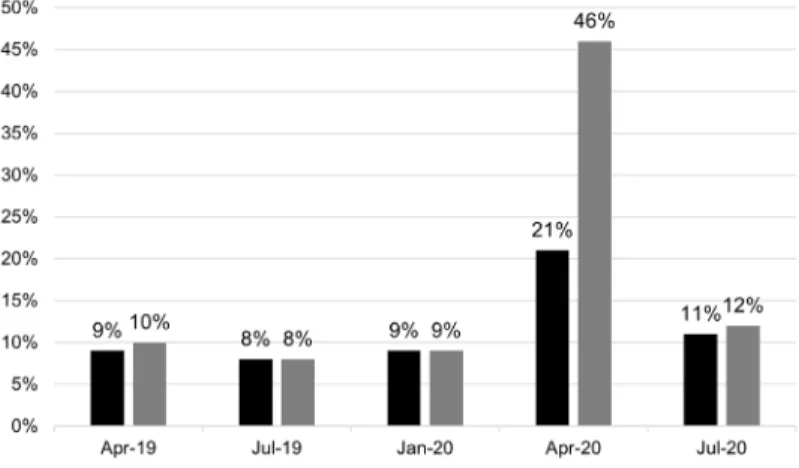
In July 2020, as lockdowns were eased, the number of households without paid work fell to 2.6 million, which was still 22 percent higher compared to the pre-pandemic level of 2.1 million (January 2020). Share of households without paid work Source: Authors' calculations based on LFS.

Identifying vulnerable employment
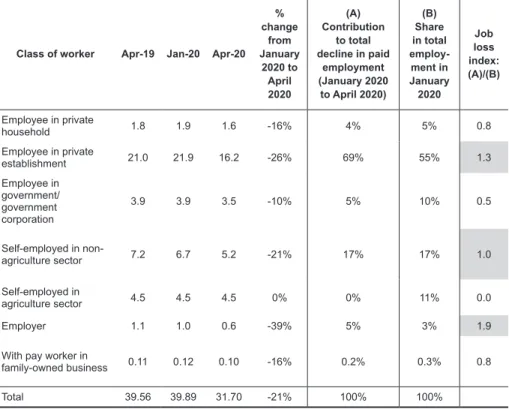
Paid jobs and paid jobs lost during the EKQ, by class of worker (in millions). Paid jobs and paid jobs lost during the EKQ by job sector (in millions).
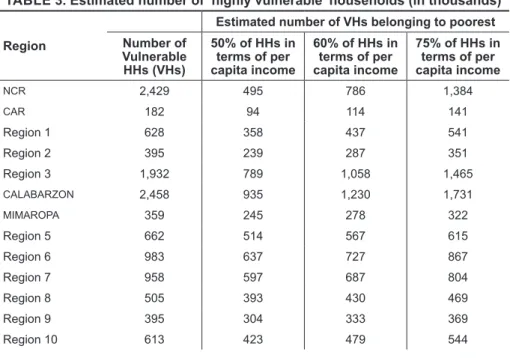
Estimate of ‘highly vulnerable’ households and budget needed to support them during ECQ
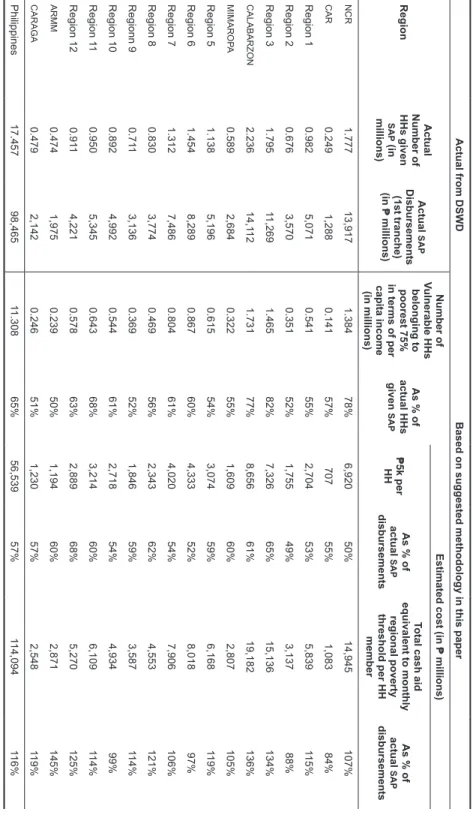
Using the estimated number of "highly vulnerable" households in Table 3, we calculate the total budget needed to support "highly vulnerable" households per ECQ month. Estimated cost of providing cash assistance equal to the monthly regional poverty threshold for each individual in "highly vulnerable" households.
Operationalization
In NCR, Region 3 and CALABARZON, where the lockdowns were the longest, the estimated number of highly vulnerable households was equivalent to about 80 percent of those who actually received cash assistance. The total estimated cost of providing each member of highly vulnerable households with an amount equal to the regional poverty line was 116 percent of what was actually paid out.
Concluding remarks
Paid jobs and paid jobs lost during the ECQ by employment sector (in millions) (continued). Paid jobs and lost paid jobs during ECQ by pay base (in millions).
COVID-19 , job loss, and underemployment
Methodology 1. Data and sample
On the other hand, it is equal to 0 if individual i was employed during the reference week and had a job in the previous quarter. If individual i did not have a job during the reference week, we use the data on the sector where he or she worked in the previous quarter. It is equal to 0 if individual i did not have a job in the previous quarter and was considered unemployed during the reference week.
Results and discussion
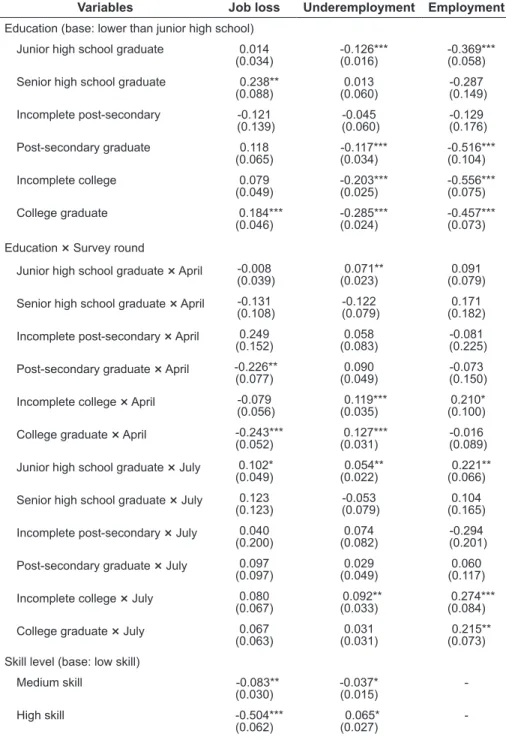
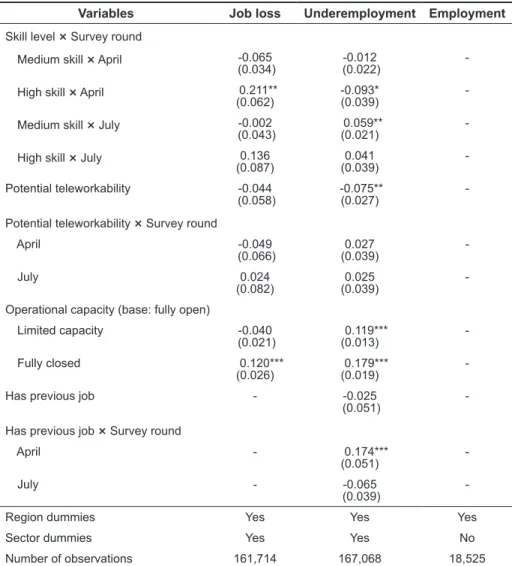
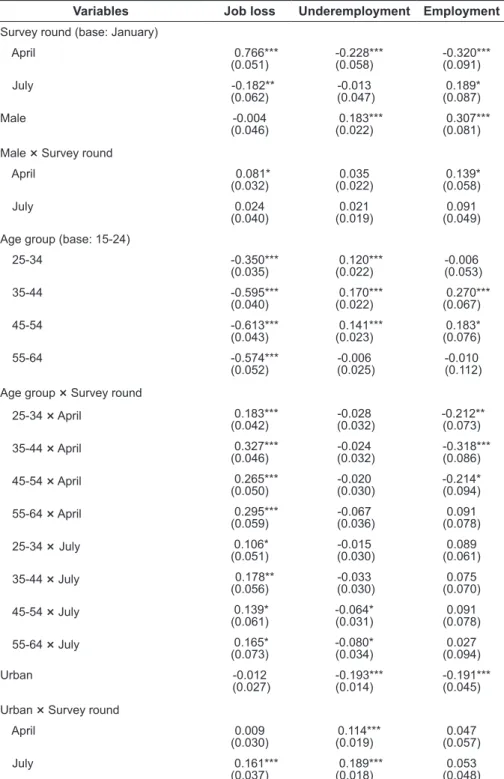
The equation's estimates of the probability of underemployment are shown in the third column of Table 4 and the average marginal effects are plotted in Figure 5. However, workers surveyed in April and employed in the previous quarter had a greater are less likely to be employed than those who were not employed in the previous quarter. Workers living in urban areas were less likely to be working in January, and the difference in the probability of employment by city is not significantly different between survey periods.
Conclusion
2020] "Measuring the teleworkability of jobs in the Philippines", presented in the 58th Philippine Economic Association Annual Meeting and Conference (November 11, 2020, online conference). International Labor Organization (ILO) [2020] “COVID-19 labor market impact in the Philippines: assessment and national policy responses”. Rao [2021] “COVID-19 impact on micro, small and medium-sized enterprises under the lockdown: evidence from a rapid survey in the Philippines” ADBI Working Paper Series No.
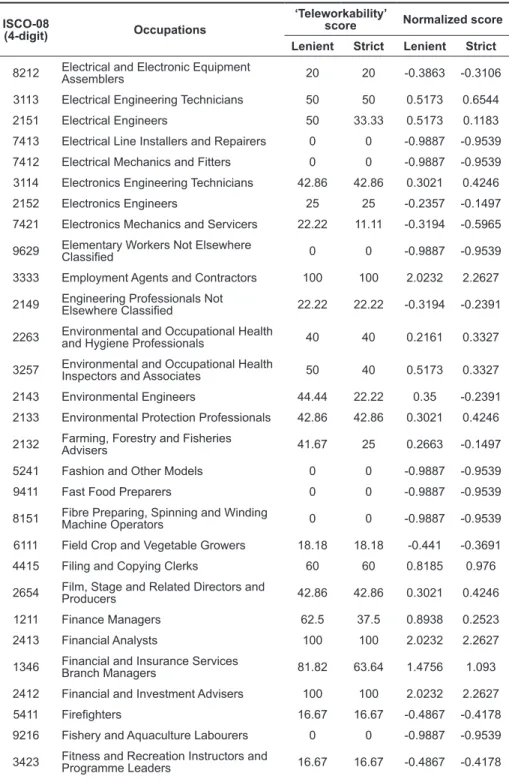
Measuring the telework potential of jobs: evidence from the International Standard Classification of Occupations
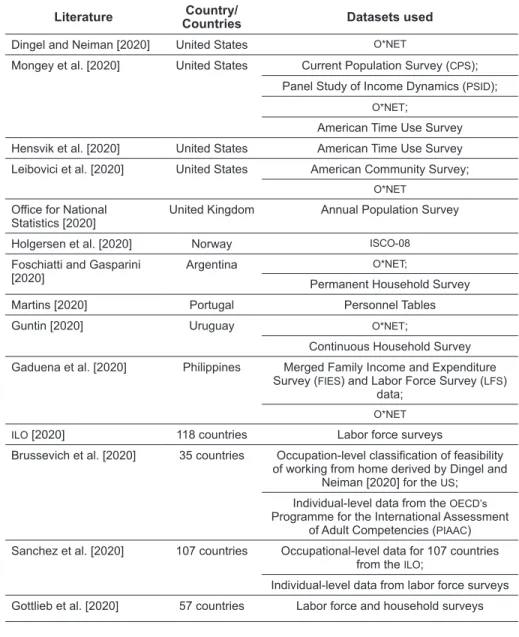
Telework literature
The primary data sources Dingel and Neiman [2020] used are O*NET's "Work Context" and "General Work Activities" surveys. Internet access as a key determinant in determining the 'telecommutability' of an occupation has been highlighted by Sanchez et al. Leibovici et al. [2020]), the primary aim has been to classify which jobs can be done at home, constructing binary indices of 'teleworkability' or WFH.
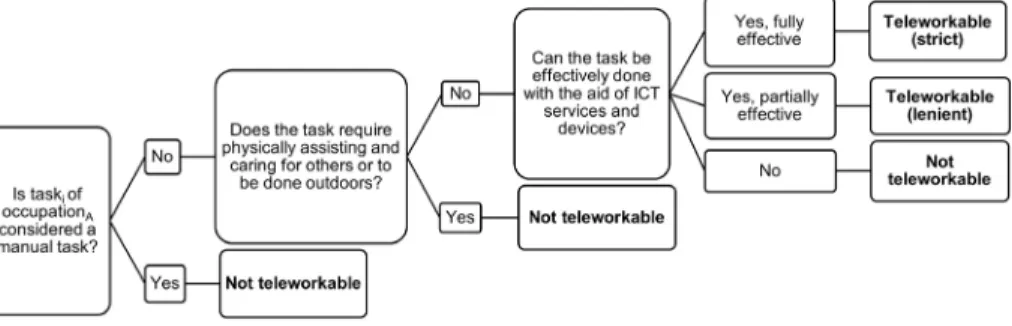
Telework classification of occupational tasks
As mentioned before, in the first round, we use Generalao's [2019] task type classification to classify manual tasks as 'unworkable by TV.' Since no tasks are identified as non-routine manuals or routine manuals, all tasks survive the first round. Of the 427 occupations, only 35 to 43 occupations (8 to 10 percent) have duties that are all classified as 'television workable'. On the other hand, a larger number of occupations, 152 to 157 (35 to 37 percent) only require the performance of 'non-telecommutable' tasks. The rest of the occupations consist of a combination of "teleworkable" and "non-teleworkable" tasks and make up the majority (54 to 55 percent.
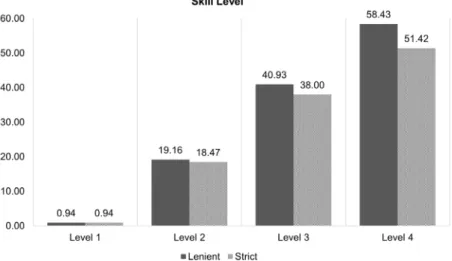
Correlates of ‘teleworkability’ or telework potential
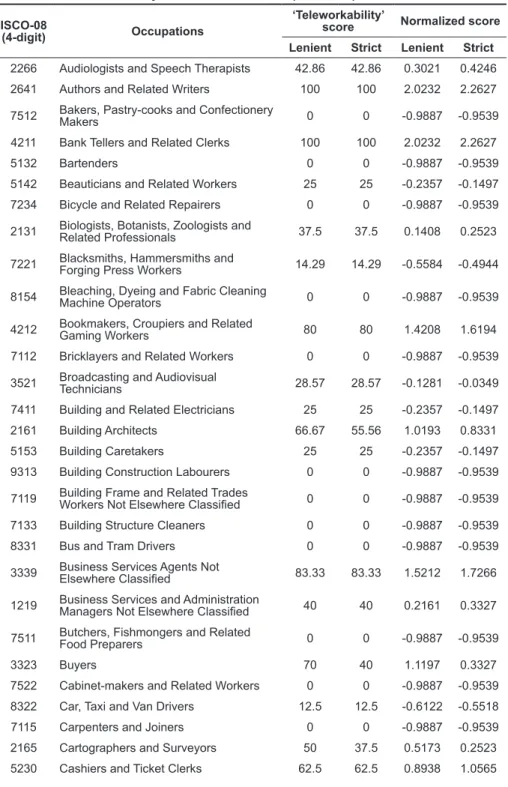
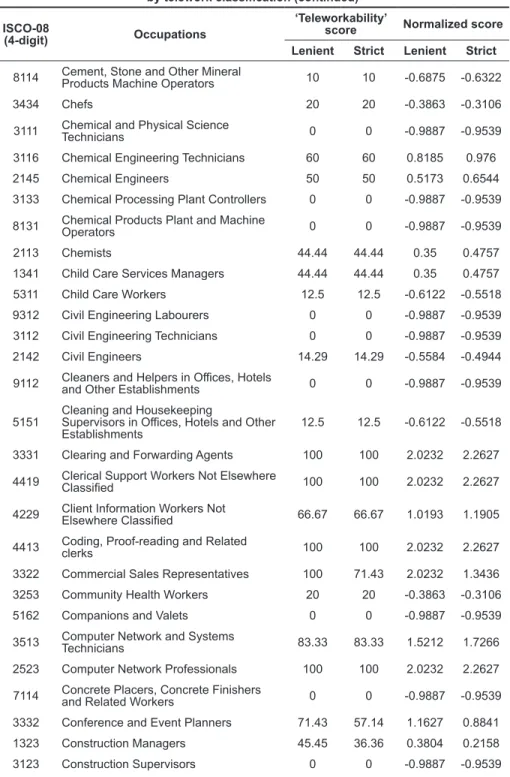
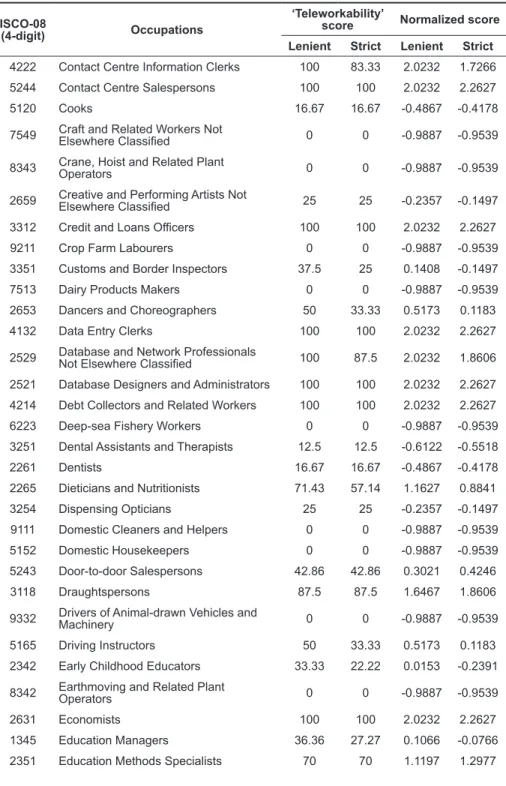
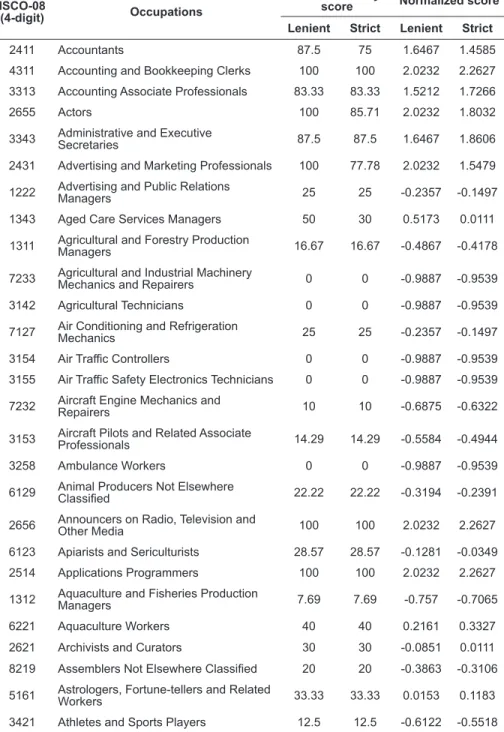
Application of the ‘teleworkability’ indices: case of Philippine jobs The ‘teleworkability’ indices we developed from ISCO-08 can be applied to
This study estimates that only 1.7 to 2.4 million workers, or 4 to 6 percent of employed workers, are in occupations where all tasks are 'telecommutable.' On the other hand, 17 to 18 million (42 to 43 percent) are in professions where all tasks are 'not remotely workable.' The majority of workers, about 22 million or 53 percent, are in occupations with a mixture of the two types of tasks (Figure 5). They also found that a smaller proportion, 12 percent of the total number of employed workers currently work in these occupations. First, due to the nature of the task content developed in ISCO-08, the relative intensity of each task in each occupation is not taken into account.
Conclusions and ways forward
Leuschner [2009] “Can a task-based approach explain recent changes in the German wage structure?”, Jahrbücher für Nationalökonomie und Statistik (Journal of Economics and Statistics. British Office for National Statistics [2020] “Coronavirus and home working in the United Kingdom labor market: 2019", https://www.ons.gov.uk/. Lemieuz Occupational tasks and changes in the wage structure," IZA Discussion Papers 5542, Institute of Labor Economics (IZA).
Life in the times of the COVID-19 pandemic
Methodology
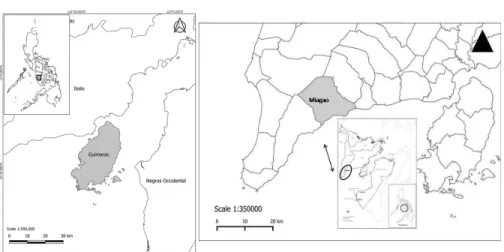
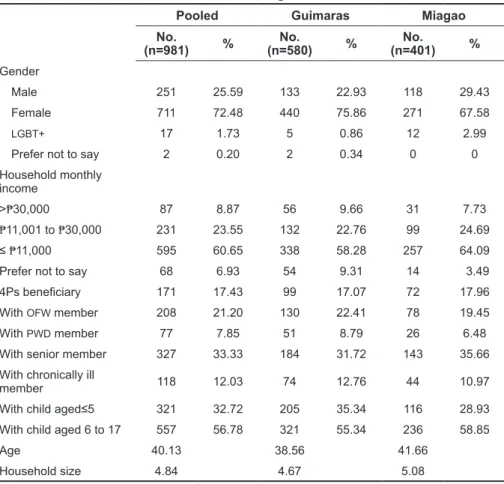
On the other hand, the municipality of Miagao in southern Iloilo province was one of the first municipalities to record active cases and the first death due to COVID-19. Miagao, like the rest of the municipalities in the province of Iloilo, was placed under ECQ from March 17, 2020 to May 15, 2020. Hard copies of the questionnaire were also distributed to households in available barangays in Miagao (450 copies) and Guimaras (400 copies) .
Results and discussion
- Experience during the E/GCQ period
- Coping
Three quarters of households in Miagao were worried all the time (51 percent) or several times (25 percent). Distribution of participants in terms of feeling safe during the E/GCQ period, Guimaras and Miagao, 2020. This represented 6 and 8 percent of the local households surveyed in Guimaras and Miagao, respectively.
Conclusions and recommendations
Kenney [2020] “The COVID-19 pandemic is straining families' ability to afford basic needs”, Health Policy Center Urban Institute: Washington. Knowledge, Attitudes and Practices of COVID-19 Among Income-Poor Households in the Philippines: A Cross-Sectional Study", Journal of Global Health. National Health Insurance Program Financing During the COVID-19 Pandemic: Financial Viability and the Burden of.
National Health Insurance Program financing during the COVID-19 pandemic: financial viability and the burden of
Framework
Total Expenditure = Total Revenue+ ∆Reserve Fund (1) The NHIP accounting framework identifies total revenue as composed of premium contributions and interest and other income, and identifies total expense as composed of benefit payments and administrative expenses (see Equations 2 and 3). This means that economic viability is negatively affected when the ratio between total expenditure and total income exceeds 1, as this implies a draw from the reserve fund. The contribution ratio between benefit payment and premium contribution is interpreted differently from the ratio between expenses and total income.
Data and methodology
The projected income from the formal sector is calculated by inflating the premium collection in the formal economy sector for 2020 by the ratio of the number of members of the formal economy sector for 2019 to 2020 (see equation 14). On the other hand, revenues from the shadow economy sector for 2021 are expected to remain at the level of 2020, assuming that the collection rate from voluntary payments will not change. In the case of indirect contributors, premium subsidies for indigent and sponsored members in 2021 are expected to remain at 2020 levels, assuming that.
Summary of findings and conclusion
Philippine Health Insurance Corporation (PhilHealth audited financial statements”, https://www.philhealth.gov.ph/about_us/transparency/. 2020] “Probable and confirmed COVID-19 hospital care benefit packages that develops severe disease/outcomes", https://www.philhealth.gov. Economic-Impact-of-COVID-19-Implics-for-Health-Financing-in-Asia- and-Pacific.pdf?sequence=6&isAllowed= y.
The COVID-19 outbreak and its impact on business establishments: a study on challenges
The survey and stakeholder consultations
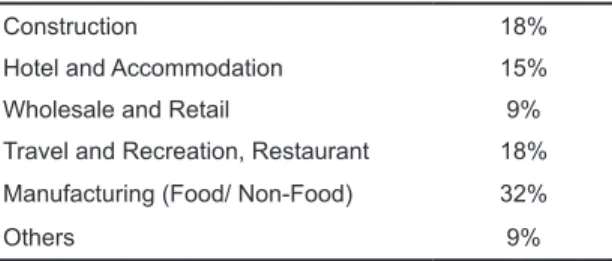
In terms of salaries, 43 percent of respondents reported no changes in the salaries of their other employees as of August 2020. The remaining 12 percent of respondents had no changes in their sales revenues. Although the majority of respondents (80 percent) are located in Luzon and the rest are outside Luzon, the latter experienced a greater contraction in sales during the lockdown, and thus a greater decline in manpower and labor costs (see Table 11 for comparison). .