Editor, The Philippine Review of Economics, Rm 237, School of Economics, University of the Philippines, Diliman, Quezon City, 1101. Published articles reflect the sole editorial judgment of the editors and the views of their authors. Over the years, PES has served as one of the strongest networks of economists in academia, government and business.
Candidates who have been accepted will only become members of the Association after payment of the annual membership fee for the current year. An empirical analysis of the effect of exchange rates on RCEP exports using the gravity model. The presence of delays in data availability is one of the main reasons for the adoption of nowcasting in economics.
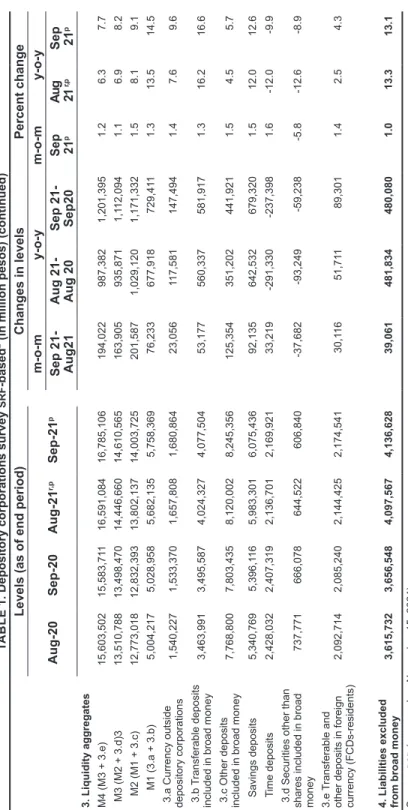
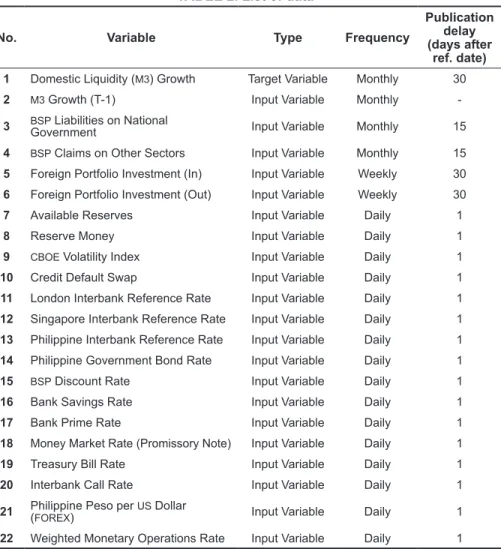
Its Department of Economic Statistics (DES) consolidates the balance sheet of the BSP and ODC to calculate this monetary indicator in a given period. Based on the BSP publication policy, the latest statistical reports (which include DCS) are treated as preliminary information (Table 1). Liquidity forecasting is currently part of the multi-equation model (MEM) of the institution [Abenoja et al.
Review of related literature
19 Tree-based methods are nonparametric techniques that do not require underlying relationships between dependent and independent variables. The paper by Woloszko [2020] was one of the last studies that specifically used AT to provide a 3- to 12-month forecast of GDP growth for the Group of Seven (G7) countries.22 In this study, the author used country-specific information (eg, surveys of expectations, consumer confidence) and macroeconomic data (eg, house prices, employment rate) as explanatory variables of the tree-based forecasting model.23 . Using these input variables, Boluis and Rayner [2020] as well as Soybilgen and Yazgan [2021] concluded that tree-based methods provide superior predictions than benchmark models.
Several studies also exploit the strengths of both regularization and tree-based methods to perform forecasting or nowcasting. 2018] used regularization and tree-based methods to formulate a model that could accurately predict the movement of GDP growth in New Zealand. 27 See page 8 of Richardson et al. current account) and financial market statistics (e.g. stock price change) data.28 Using these indicators as explanatory variables, the authors concluded that regularization and tree-based methods provide better results in estimating short-term GDP growth in Indonesia, as shown by low RMSE and mean average deviation (MAD).
The authors also found that regularization and tree-based methods reduced average forecast errors from 38 to 63 percent relative to ARIMA.
Data
The first value is the average from the first to the 15th day of the month, while the second half is the average from the 16th to the last day of the month (e.g. available backup data from 1st to 15th January and 16th to 31 January is the average respectively). Meanwhile, the latter was implemented on the low frequency (i.e. monthly) variables such as domestic liquidity, BSP liabilities on NG and BSP claims on other sectors. The data points between each period of average input variable data (eg, mid-month data) are considered missing values and interpolated using a spline interpolation method commonly used for non-linear data estimation.
4 BSP requirements on other sectors Input Variable Monthly 15 5 Foreign Portfolio Investment (In) Input Variable Weekly 30 6 Foreign Portfolio Investment (Out) Input Variable Weekly 30. 11 London Interbank Reference Rate Input Variable Daily 1 12 Singapore Interbank Reference Rate Input Variable Daily 1 13 Philippine Interbank Reference Rate Input Variable Daily 1 14 Philippine Government Bond Rate Input Variable Daily 1.
Research methodology
The essential factor in this equation is the tuning parameter λ, which controls the relative impact of the regression coefficient estimates [James et al. However, as λ = ∞, the impact of the shrinkage increases and the coefficient estimates approach zero [Tiffin 2016 ]. The respective weights of the two penalties are determined via the additional tuning parameter α [Richardson et al.
RF is a machine learning tree algorithm that uses combinations of several decision trees to form a comprehensive forecast.32 It modifies the decision tree approach to reduce the overfitting problem and increase the information content of the data by using subsamples of observations and predictions (Tiffin [ 2016 ]; Bolhuis and Rayner [ 2020]). In particular, RF uses bootstrap clustering (also known as bagging) in each decision tree using a random sample of observations in the training data set. This process is repeated k times, and the results are averaged to reduce the total variance without increasing the bias of the data set.
It then uses the prediction errors from said decision tree to train a second decision tree. Next, the errors from the second decision tree are used to train the tree, and so on. After the final iteration, the algorithm uses the summation of these predictions to provide a final prediction (James et al. [2013]; Bolhuis and Rayner [2020]).
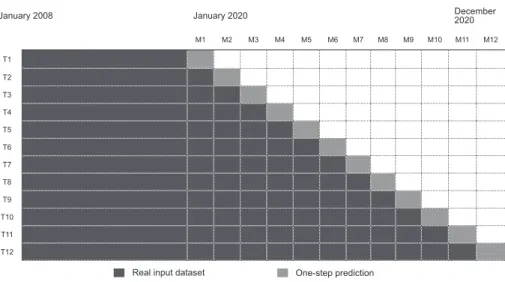
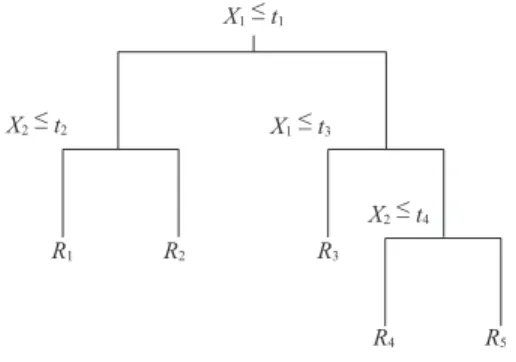
32 Decision Tree is the fundamental structure of any tree-based machine learning method used for classification and regression problems (James et al. [2013]; Fan [2019]). This approach divides categorical (e.g., name, address) or continuous (e.g., level, growth rate) data into two classes in a systematic manner to reduce the prediction error of the target variable of interest. To estimate short-term domestic liquidity growth, this study evaluates the performance of time series models and machine learning algorithms based on their one-step-ahead (out-of-sample) nowcast.
The first training data set covers the numerical values of the target and input variables from January 2008 to December 2019. This process is carried out until the test data set covers the numerical values of the target and input variables from December 2020 (Figure 2).
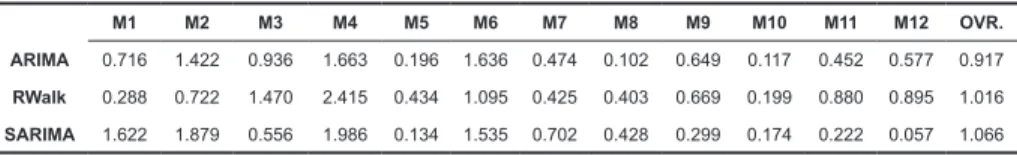
Results and analysis 34 1. Univariate models
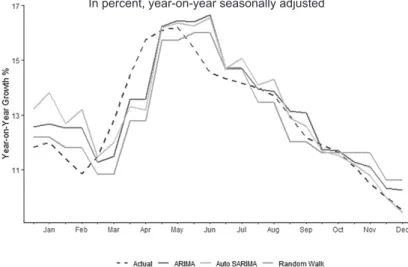
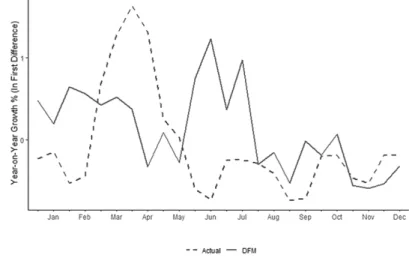
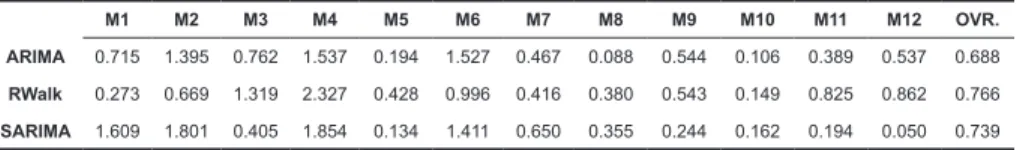
In contrast to the three univariate models, the DFM provides inconsistent estimates of the overall movement of domestic liquidity in the first semester of 2020. 37 The DFM was used as a multivariate model because it reduces the dimension of the wide range of high frequency monetary, financial, and external sector indicators as input variables used in this study. It can be observed that the monthly forecast errors of the said model are relatively lower than those of ARIMA, Random Walk and SARIMA, especially from August to December 2020 (Tables 5 and 6).
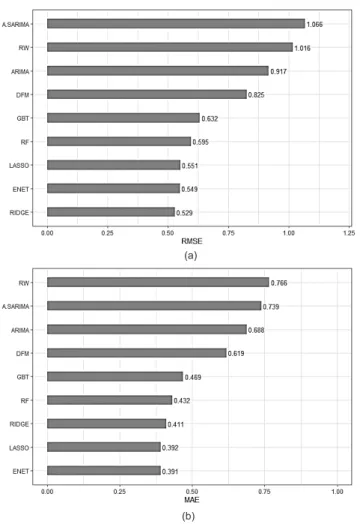
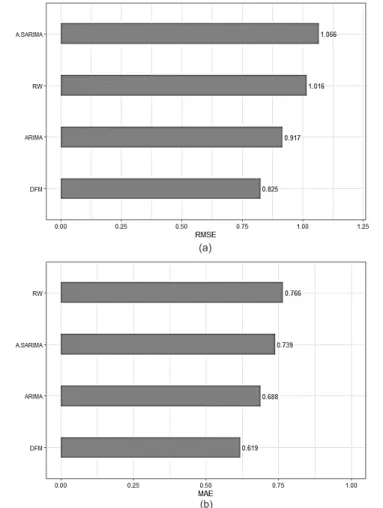
Additionally, this particular outcome can be similarly observed in the overall prediction errors of DFM. These prediction errors are relatively lower than those exhibited by the univariate models (Figure 5). In particular, the monthly nowcasts of these models have lower forecast errors than the individual estimates stipulated by ARIMA, Random Walk, SARIMA and DFM (Tables 7 and 8), except for September and October 2020 (Figure 6).
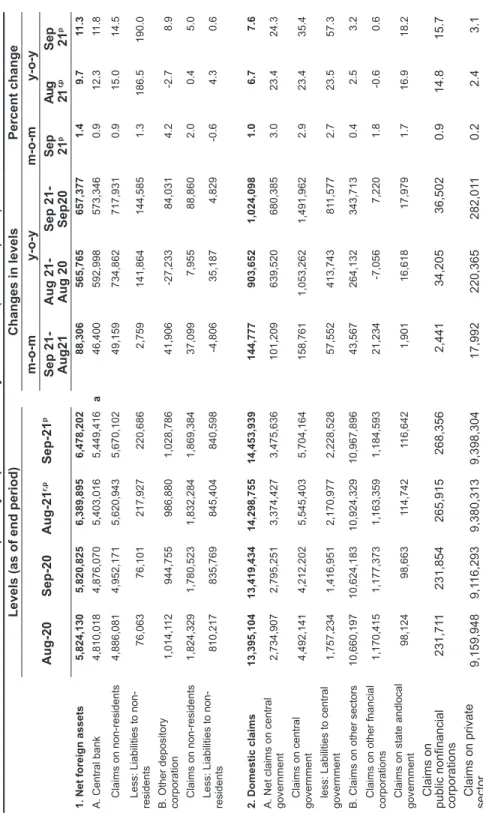
In addition, the regularization methods estimate domestic liquidity with low forecast errors in the months when it unexpectedly expands due to the increase in central government loans and deposits to the central bank from March to May 2020 (Tables 7 and 8). A similar result was observed from the overall forecast errors using the three regularization methods. Comparing the three models under the regularization method, it can be observed that LASSO gave the highest number of months (i.e. five months) with relatively low forecast errors from January to December 2020 (Tables 7 and 8).
The monthly forecast errors of the two machine learning models are significantly lower than those under ARIMA, RW, SARIMA and DFM, except for the now-cast result under RF in September 2020 (Figure 8). Likewise, the results indicate that RF and GBT estimate domestic liquidity growth with low forecast error in the months when growth in this monetary indicator suddenly increased due to increased borrowing and deposits by the national government (Tables 9 and 10). Apart from their robust monthly estimates, the overall RF and GBT nowcasts also recorded lower forecast errors.
These figures are significantly lower than the total prediction errors recorded by the univariate and multivariate models run in this study (Figure 9). Moreover, among the tree-based methods used in this study, it can also be found that RF produced the lowest prediction errors. One of the key benefits of using machine learning algorithms in economic nowcasting is their ability to identify a subset of selected input variables that better predicts the movement or growth of a given macroeconomic indicator.
However, the main difference is that both the tree-based methods used in this study have identified that the lagged value (t−1) of the target variable, as an input variable, is also crucial in estimating domestic liquidity growth in the Philippines.
Conclusion
In addition to their powerful one-step-ahead (out-of-sample) estimations, machine learning algorithms also offer substantial advantages over traditional time series models. These models can identify indicators that can define current parsimonious models with more accurate results. Therefore, now the transmissions based on LASSO, ENET, RF and GBT show that (1) national government deposits, (2) BSP claims on other sectors, (3) FOREX and (4) domestic liquidity lagged values are among the indicators that may be useful in tracking the current increase in domestic liquidity in the Philippines.
Acknowledgments: The author would like to express his deepest gratitude to Professor Konstantin Kucheryavyy, Ph.D. Mattsson [2015] "Forecasting GDP growth, or how random forests can improve predictions in economics", Uppsala University - Department of Statistics. Papailias [2016] "Big data and macroeconomic nowcasting: from data access to modelling", in Eurostat Statistical Book.
D'Elia [2010] "Euro area GDP forecasting using large survey dataset - a random forest approach", Euroindicators Working Papers. Swanson [2018] “Forecasting and now-forecasting emerging market GDP growth rate: the role of latent global economic policy uncertainty and macroeconomic data surprise factors”, Journal of Forecasting. Sidi [2010] "Nowcasting Israel GDP using high-frequency macroeconomic disaggregates", Bank of Israel Discussion Paper No.
2019] “GDP in Real Time in New Zealand”, Massey University - School of Natural and Computational Sciences. 2018] “Nowcasting the inflation rate in the Philippines using mixed frequency models”, University of the Philippines - School of Statistics. Highly Mixed Frequency Dynamic Latent Factor Forecasting Models for GDP in the Philippines”, Estudios de Economia Aplicada: 451-462.
Predictive performance of mixed-frequency forecasts and forecasting models (with application to Philippine inflation and GDP growth)”, University of Pennsylvania, Department of Economics. Vehbi [2018] “Nowcasting New Zealand GDP using machine learning algorithms”, IFC – Bank Indonesia International Workshop and Seminar on “Big Data for Central Bank Policies/Building Pathways for Policy Making with Big Data”. 2017] “Examining Philippine Economic Growth Using MIDAS Regression Modeling”, DLSU Angelo King Institute for Economic and Business Studies.
Soleh [2020] “Nowcasting Indonesia's GDP Growth Using Machine Learning Algorithms,” Munich Personal RePEc Archive [MPRA] no.