The Philippine Review of Economics
Editor-in-Chief EMMANUEL F. ESGUERRA
Editorial Advisory Board EMMANUEL DE DIOS
RAUL V. FABELLA HAL CHRISTOPHER HILL
CHARLES Y. HORIOKA KIAN GUAN LIM ROBERTO S. MARIANO JOHN VINCENT C. NYE GERARDO P. SICAT JEFFREY G. WILLIAMSON
Associate Editors LAWRENCE B. DACUYCUY FRANCISCO G. DAKILA JR.
JONNA P. ESTUDILLO MARIA S. FLORO GILBERTO M. LLANTO
Managing Editor HONLANI RUTH R. RUFO
A joint publication of the University of the Philippines
School of Economics and the Philippine Economic Society
ARTICLES IN THIS ISSUE Unemployment and monetary policy:
a revisit and new job strategies Dante B. Canlas
A SYMPOSIUM ON THE CARE ECONOMY Introduction to the symposium on
the care economy Maria S. Floro
Elizabeth M. King Child and elderly care in South Korea:
policy analysis with a gendered, care-focused computable general equilibrium model
Martín Cicowiez Hans Lofgren
Women’s market work and childcare policies in Colombia: policy simulations using a computable general equilibrium model
Martín Cicowiez Hans Lofgren Ana Tribin Tatiana Mojica The enduring impact of the
pandemic on gender patterns of paid and unpaid work: evidence from time-use data in Turkey
Ipek Ilkkaracan Emel Memiş
Unpaid eldercare and its impact on
the US labor supply Tanima Ahmed
Maria S. Floro Care work and the demographic
composition of households: two Asian cases
Elizabeth M. King Hannah L. Randolph Jooyeoun Suh Care workers’ sense of responsibility,
working conditions, and the quality of care in South Korea
Shirin Arslan Arnob Alam Maria S. Floro Seung-Eun Cha Eunhye Kang
Aims and Scope: The Philippine Review of Economics (pre) invites theoretical and empirical articles on economics and economic development. Papers on the Philippines, Asian and other developing economies are especially welcome. Book reviews will also be considered.
The pre is published jointly by the up School of Economics and the Philippine Economic Society. Its contents are indexed in the Journal of Economic Literature, EconLit, and RePEc.
pre’s readership includes economists and other social scientists in academe, business, government, and development research institutions.
Publication Information: The pre (issn 1655-1516) is a peer-reviewed journal published every June and December of each year. A searchable database of published articles and their abstracts is available at the pre website (http://pre.econ.upd.edu.
ph).
Subscription Information:
Subscription correspondence may be sent to the following addresses:
• pssc Central Subscription Service,
psscenter, Commonwealth Avenue, 1101, Diliman, Quezon City, Philippines.
P.O. Box 205, up Post Office, Diliman, Quezon City, Philippines 1101
PHONE: 922-9627, FAX: 924-4178/926-5179
Submissions: Authors may submit their manuscripts to addresses below:
• [email protected] or [email protected]
• The Editor, The Philippine Review of Economics, Rm 237, School of Economics, University of the Philippines, Diliman, Quezon City, 1101.
Manuscripts must be written in English and in ms Word format.
All graphs and tables must be in Excel format. Submission of a manuscript shall be understood by the pre as indicating that the manuscript is not under consideration for publication in other journals. All submissions must include the title of the paper, author information, an abstract of no more than 150 words, and a list of 3–4 keywords. Complete guidelines can be viewed in pre’s website.
Copyright: The Philippine Review of Economics is protected by Philippine copyright laws. Articles appearing herein may be reproduced for personal use but not for mass circulation. To reprint an article from pre, permission from the editor must be sought.
EDITOR-IN-CHIEF Emmanuel S. de Dios UP SCHOOL OF ECONOMICS EDITORIAL ADVISORY BOARD Raul V. Fabella
UP SCHOOL OF ECONOMICS Hal C. Hill
AUSTRALIAN NATIONAL UNIVERSITY Charles Y. Horioka
ASIAN GROWTH RESEARCH INSTITUTE (KITAKYUSHU)
Kian Guan Lim
SINGAPORE MANAGEMENT UNIVERSITY Roberto S. Mariano UNIVERSITY OF PENNSYLVANIA John Vincent C. Nye GEORGE MASON UNIVERSITY Gerardo P. Sicat UP SCHOOL OF ECONOMICS Jeffrey G. Williamson HARVARD UNIVERSITY ASSOCIATE EDITORS Dante B. Canlas UP SCHOOL OF ECONOMICS Ramon L. Clarete UP SCHOOL OF ECONOMICS Lawrence B. Dacuycuy DE LA SALLE UNIVERSITY Francisco G. Dakila Jr.
BANGKO SENTRAL NG PILIPINAS Cristina C. David PHILIPPINE INSTITUTE
FOR DEVELOPMENT STUDIES Jonna P. Estudillo NATIONAL GRADUATE INSTITUTE
FOR POLICY STUDIES (TOKYO) Maria S. Floro
AMERICAN UNIVERSITY (WASHINGTON D.C.) Gilberto M. Llanto
PHILIPPINE INSTITUTE FOR DEVELOPMENT STUDIES Aniceto C. Orbeta PHILIPPINE INSTITUTE
FOR DEVELOPMENT STUDIES Ernesto M. Pernia UP SCHOOL OF ECONOMICS Stella Luz A. Quimbo UP SCHOOL OF ECONOMICS MANAGING EDITOR Honlani Ruth J. Rabe UP SCHOOL OF ECONOMICS COPY EDITOR Dinna Dayao
and the Philippine Economic Society (PES)
EDITOR IN CHIEF Emmanuel F. Esguerra UP SCHOOL OF ECONOMICS EDITORIAL ADVISORY BOARD Emmanuel de Dios
UP SCHOOL OF ECONOMICS Raul V. Fabella UP SCHOOL OF ECONOMICS Hal Christopher Hill AUSTRALIAN NATIONAL UNIVERSITY Charles Y. Horioka KOBE UNIVERSITY Kian Guan Lim
SINGAPORE MANAGEMENT UNIVERSITY Roberto S. Mariano UNIVERSITY OF PENNSYLVANIA John Vincent C. Nye GEORGE MASON UNIVERSITY Gerardo P. Sicat UP SCHOOL OF ECONOMICS Jeffrey G. Williamson HARVARD UNIVERSITY ASSOCIATE EDITORS Lawrence B. Dacuycuy DE LA SALLE UNIVERSITY Francisco G. Dakila Jr.
BANGKO SENTRAL NG PILIPINAS Jonna P. Estudillo UNIVERSITY OF THE PHILIPPINES Maria S. Floro
AMERICAN UNIVERSITY (WASHINGTON D.C.) Gilberto M. Llanto
PHILIPPINE INSTITUTE FOR DEVELOPMENT STUDIES
MANAGING EDITOR Honlani Ruth R. Rufo UP SCHOOL OF ECONOMICS
Aims and Scope: The Philippine Review of Economics (PRE) invites theoretical and empirical articles on economics and economic development. Papers on the Philippines, Asian and other developing economies are especially welcome. Book reviews will also be considered.
The PRE is published jointly by the UP School of Economics and the Philippine Economic Society. Its contents are indexed in the Journal of Economic Literature, EconLit, and RePec. PRE’s readership includes economists and other social scientists in academe, business, government, and development research institutions.
Publication Information: The PRE (ISSN 1655-1516) is a peer- reviewed journal published every June and December of each year.
A searchable database of published articles and their abstracts is available at the PRE website (http://pre.econ.upd.edu.ph).
Subscription Information:
Subscription correspondence may be sent to the following addresses:
• PSSC Central Subscription Service,
PSSCenter, Commonwealth Avenue, 1101, Diliman, Quezon City, Philippines.
P.O. Box 205, UP Post Office, Diliman, Quezon City, Philippines 1101
PHONE: 922-9627, FAX: 924-4178/926-5179
Submissions: Authors may submit their manuscripts to the addresses below:
• The Editor, The Philippine Review of Economics, Rm 237, School of Economics, University of the Philippines, Diliman, Quezon City, 1101.
Manuscripts must be written in English and in MS Word format.
All graphs and tables must be in Excel format. Submission of a manuscript shall be understood by the PRE as indicating that the manuscript is not under consideration for publication in other journals. All submissions must include the title of the paper, author information, an abstract of no more than 150 words, and a list of 3–4 keywords. Complete guidelines can be viewed in the PRE’s website.
Copyright: The Philippine Review of Economics is protected by Philippine copyright laws. Articles appearing herein may be reproduced for personal use but not for mass circulation. To reprint an article from PRE, permission from the editor must be sought.
Acknowledgements: The PRE gratefully acknowledges the financial support towards its publication provided by the Philippine Center for Economic Development (PCED). The Review nonetheless follows an independent editorial policy. The articles published reflect solely the editorial judgement of the editors and the views of their respective authors.
2017 OFFICERS AND BOARD OF DIRECTORS
PRESIDENT Jose Camacho Jr.
UNIVERSITY OF THE PHILIPPINES LOS BAÑOS VICE PRESIDENT
Majah-Leah Ravago
UNIVERSITY OF THE PHILIPPINES DILIMAN SECRETARY
Ronald Mendoza ATENEO SCHOOL OF GOVERNMENT TREASURER
Emilio Neri Jr.
BANK OF THE PHILIPPINE ISLANDS MEMBERS
Victor Abola
UNIVERSITY OF ASIA AND THE PACIFIC Cristina Bautista
ATENEO DE MANILA UNIVERSITY Kevin Chua
WORLD BANK
Lawrence Dacuycuy DE LA SALLE UNIVERSITY Lawrence Fernandez MERALCO
George Manzano
UNIVERSITY OF ASIA AND THE PACIFIC Stella Quimbo
PHILIPPINE COMPETITION COMMISSION IMMEDIATE PAST PRESIDENT Rosemarie Edillon
NATIONAL ECONOMIC AND DEVELOPMENT AUTHORITY
PHILIPPINE REVIEW OF ECONOMICS Emmanuel de Dios
EDITOR
COUNCIL OF ADVISERS Romeo Bernardo
LAZARO, BERNARDO, TIU AND ASSOCIATES Raul Fabella
UNIVERSITY OF THE PHILIPPINES DILIMAN Cielito Habito
ATENEO DE MANILA UNIVERSITY Ernest Leung
Solita Collas-Monsod
UNIVERSITY OF THE PHILIPPINES DILIMAN Cesar Virata
C. VIRATA AND ASSOCIATES
Founded 1961
The Philippine Economic Society (PES) was established in August 1962 as a nonstock, nonprofit professional organization of economists.
Over the years, the PES has served as one of the strongest networks of economists in the academe, government, and business sector.
Recognized in the international community of professional economic associations and a founding member of the Federation of ASEAN Economic Associations (FAEA), the PES continuously provides a venue for open and free discussions of a wide range of policy issues through its conferences and symposia.
Through its journal, the Philippine Review of Economics (PRE), which is jointly published with the UP School of Economics, the Society performs a major role in improving the standard of economic research in the country and in disseminating new research findings.
At present the society enjoys the membership of some 800 economists and professionals from the academe, government, and private sector.
• Lifetime Membership – Any regular member who pays the lifetime membership dues shall be granted lifetime membership and shall have the rights, privileges, and responsibilities of a regular member, except for the payment of the annual dues.
• Regular Membership – Limited to individuals 21 years of age or older who have obtained at least a bachelor’s degree in economics, or who, in the opinion of the Board of Directors, have shown sufficient familiarity and understanding of the science of economics to warrant admission to the Society. Candidates who have been accepted shall become members of the Society only upon payment of annual dues for the current year.
• Junior Membership – This is reserved for full- time college or graduate students majoring in economics. Affiliation for junior membership is coursed through the Junior Philippine Economic Society (JPES).
For more information, visit: www.phileconsociety.org.
BOARD OF TRUSTEES 2023 PRESIDENT
Philip Arnold P. Tuaño ATENEO DE MANILA UNIVERSITY
VICE PRESIDENT Agham C. Cuevas
UNIVERSITY OF THE PHILIPPINES-LOS BAÑOS
SECRETARY Alice Joan G. Ferrer
UNIVERSITY OF THE PHILIPPINES-VISAYAS
TREASURER Marites M. Tiongco DE LA SALLE UNIVERSITY
BOARD MEMBERS Faith Christian Q. Cacnio BANGKO SENTRAL NG PILIPINAS Jovi C. Dacanay
UNIVERSITY OF ASIA AND THE PACIFIC Sarah Lynne S. Daway-Ducanes NATIONAL ECONOMIC AND DEVELOPMENT
AUTHORITY Ricardo L. Dizon
POLYTECHNIC UNIVERSITY OF THE PHILIPPINES Adoracion M. Navarro
PHILIPPINE INSTITUTE FOR DEVELOPMENT STUDIES
Emilio S. Neri, Jr.
BANK OF THE PHILIPPINE ISLANDS Ser Percival K. Peña-Reyes ATENEO DE MANILA UNIVERSITY
EX-OFFICIO BOARD MEMBERS Charlotte Justine Diokno-Sicat ASIAN DEVELOPMENT BANK
IMMEDIATE PAST PRESIDENT Emmanuel F. Esguerra UNIVERSITY OF THE PHILIPPINES DILIMAN
EDITOR-IN-CHIEF, THE PHILIPPINE REVIEW OF ECONOMICS
The Philippine Review of Economics
Vol. LX No. 1 June 2023
ISSN 1655-1516
DOI: 10.37907/ERP3202J
1 Unemployment and monetary policy: a revisit and new job strategies
Dante B. Canlas
A Symposium on the Care Economy 10 Introduction to the symposium on the care economy
Maria S. Floro Elizabeth M. King
19 Child and elderly care in South Korea: policy analysis with a gendered, care-focused computable general equilibrium model Martín Cicowiez
Hans Lofgren
65 Women’s market work and childcare policies in Colombia:
policy simulations using a computable general equilibrium model Martín Cicowiez
Hans Lofgren Ana Tribin Tatiana Mojica
99 The enduring impact of the pandemic on gender patterns of paid and unpaid work: evidence from time-use data in Turkey Ipek Ilkkaracan
Emel MemiŞ
Maria S. Floro
158 Care work and the demographic composition of households:
two Asian cases Elizabeth M. King Hannah L. Randolph Jooyeoun Suh
191 Care workers’ sense of responsibility, working conditions, and the quality of care in South Korea
Shirin Arslan
Arnob Alam
Maria S. Floro
Seung-Eun Cha
Eunhye Kang
Unpaid eldercare and its impact on the
USlabor supply
Tanima Ahmed*
World Bank
Maria S. Floro
American University
Globally, the dependency ratio is rising due to increase in aging population.
Individuals, especially women are challenged when choosing between participating in the labor market and providing care. Using 2011-2017 American Time Use Survey data for a subsample of individuals aged 25- 61 years, we examine the effect of frequent eldercare provision on labor force participation in the US using bivariate probit instrumental variable approach. Our findings suggest that unpaid eldercare performed frequently reduces labor force participation. Female frequent providers are likely to have lower labor force participation compared to their male counterparts.
Robustness and sensitivity checks confirm these findings.
JEL Classification: J14, J16, J22
Keywords: aging, eldercare, labor supply, United States
* Address all correspondence to [email protected].
1. Introduction
The world is facing a demographic turn. The number of persons aged 65 and older is expected to rise from 703 million in 2019 to 1.5 billion in 2050, i.e., one in six people worldwide will be 65 and older by the year 2050, increasing from one in 11 in 2019 [United Nations 2019]. The rate of increase in the older population is highest in Eastern and Southeastern Asia, with the largest growth estimated to be in the Republic of Korea (23 percent). With the increase in the aging population and declining fertility, the old-age dependency ratio is projected to rise in all regions of the world, with Japan and Korea estimated to be having the highest old-age dependency ratio of 81 and 79 persons aged 65 years and older, depending on 100 persons aged 20-64 years by 2050, respectively.
The US will also follow—soon facing a significant demographic turn by the year 2035. The 2018 US Census Bureau report predicts that the elderly, aged 65 years and older, will outnumber children, aged 18 years and younger for the first time
in the US history (78 million elderly vs. 76.4 million children) [US Census Bureau 2018]. Due to aging, the dependency ratio in the population is expected to increase to 41 percent by the year 2060, nearly four times the level in 1940 (11 percent) [Vespa et al. 2018]. This change in demographic composition poses a unique set of challenges for long-term care for frail elderly. Many low and middle-income countries either lack or have inadequate government support for long-term care services, and so the burden of eldercare largely falls upon family members (e.g., children, spouse, niece or nephew, and grandchildren).
In many low- and middle-income countries, family members (e.g., children, spouse, niece or nephew, and grandchildren) shoulder the heavy burden of caregiving. This is in large part due to the prevailing cultural norms involving filial piety or familial obligations to care for elderly parents. It is also due to the high cost of private long-term care insurance and of institutional forms of elder care such as nursing homes, given the weak or no government support for such services.
On the other hand, the increasing prevalence of nuclear families and urbanization in high-income countries and in some middle-income countries have weakened the ability of families to provide eldercare on their own. As a result, their governments are also increasingly providing support for long-term care insurance and are investing in eldercare supply. Not surprisingly, nursing homes, community-based eldercare services, and private residential care facilities have grown in these countries in the past few decades.
In the US, nursing homes care for nearly three million elderly persons each year, with government-funded Medicaid paying the majority of the USD 235 billion in annual cost. However, millions more Americans needing long-term care support largely rely on services provided by unpaid caregivers [Mitchell et al 2022].1 This is because US government spending on long-term care is proportionally the lowest among high-income countries [Commonwealth Fund 2023]. There is, by now, a general consensus that inadequate prioritization of public investment in long-term care in the US has led to a highly variable quality of care, critical staff shortages, racial and ethnic disparities, and wasteful spending, all of which have become evident during the COVID-19 pandemic [Mitchell et al. 2022].
Eldercare has become a pressing issue given the increase in life expectancies and the fact that as population ages and the elderly live longer, many of the elderly will live with limited functionalities and disabilities, which increases the complexity and duration of care tasks (Hagen [2013]; National Alliance for Caregiving and AARP Public Policy Institute (2015); Reinhard et al. (2015)].
Care for older adults involves a wide range of activities—from assisting with daily living activities such as eating, bathing, getting dressed, continence, and moving
1 In all states, US Medicaid gives health coverage to eligible individuals and families based on incomes and family size, including children, parents, pregnant women, and elderly persons below a certain income level, as well as people with disabilities. See: https://www.hhs.gov/answers/medicare-and-medicaid/who-is- eligible-for-medicaid/index.html.
around, performing medical and nursing tasks, to assistance with financial, housing, as well as legal issues. It also involves providing emotional support and companionship, which includes activities such as listening or taking the elderly out for a walk.
Studies by Arora and Wolf [2014], Zagheni et al. [2016], Hammersmith and Lin [2016], and Bott et al. [2017] point to the challenges and difficulties that many eldercare providers face in balancing care responsibilities with their employment.
Other studies show that an increase in unpaid eldercare is likely to lead to withdrawal from the labor force or a shift from full-time to part-time employment, and decline in earnings (Butrica and Karamcheva [2015]; Chari et al. [2015];
Feinberg [2016]; Feinberg and Choula [2012]; Reinhard et al. [2015]; US Bureau of Labor Statistics [2017]). However, the impact on labor force participation is likely to be underestimated, for two reasons. First, several of these studies, e.g., Johnson and Lo Sasso [2006], Houtven et al. [2013], and Butrica and Karamcheva [2015] focus only on individuals 50 years and older, leaving out prime-aged adults who also provide unpaid eldercare. Second, these studies do not distinguish the effects on labor supply between those providing frequent (daily or several times a week) eldercare and those who perform infrequent eldercare (once a month or a few times a year), which results in a pooled average effect. The distinction is important since the frequency of care provision is closely related with the level and intensity of unpaid care provided and the extent to which caregiving poses a serious time constraint in performing other activities such as market work.
On the other hand, the labor supply effect may be overestimated if the issues of selection bias and endogeneity are not addressed (Lam and Garcia-Roman [2017];
Yamashita et al. [2018]).
This study addresses the above methodological and data issues in our analysis of the impact of unpaid eldercare on labor supply. First, it examines the relationship between frequent eldercare and labor force participation using a subsample of individuals aged 25 to 61 years. Second, it makes a distinction between infrequent and frequent eldercare providers and focuses on the labor supply effect in the latter case, thus providing a more accurate, albeit nuanced assessment. The study is distinct from other studies in that it uses the eldercare module of the 2011-2017 American Time Use Survey (ATUS) dataset rather than special survey datasets, e.g., the Health and Retirement Study (HRS) or other time use surveys, which do not collect specific data on eldercare. ATUS’s time diary approach along with an eldercare module allows for a more accurate measure of the amount of time spent on eldercare; and its design includes not just spouse and parents as care recipients but also other family members e.g., aunts, uncles, grandparents, friends, and neighbors. While Johnson and Lo Sasso [2006], Houtven et al. [2013], Skira [2015], and Butrica and Karamcheva [2015] used panel data to deal with the selection bias, in this paper we address the problem using a bivariate probit with instrumental variable (IV) approach. Our findings suggest that frequent eldercare provision reduces the labor force participation of
individuals aged 25 to 61 years old by nine percentage points. Interestingly, we also find that frequent male providers reduce their labor force participation more than frequent female providers. A series of robustness tests confirm our results.
2. Background
Most people nowadays provide care for an elderly family member, friend, or neighbor at some point in their lives. For a growing number of individuals, this occurs while they are still economically active and thus its provisioning can affect the labor supply, as demonstrated by studies in high-income countries such as the US. Using the HRS longitudinal data, Johnson and Lo Sasso [2006], Houtven et al. [2013], Skira [2015], and Butrica and Karamcheva [2015] show that providing eldercare leads to lower labor force participation of those aged 51 years and older in the US. Houtven et al. [2013] and Butrica and Karamcheva [2015] point out that the effect of providing eldercare on labor force participation varies by types and the intensity of care. Butrica and Karamcheva [2015] show that the likelihood of the labor force participation of women fall by 3.9 percent if women provide intensive care. Houtven et al. [2013] find that female caregivers are more likely to be retired, and male caregivers are more likely to reduce their labor force participation by around 2.4 percentage points.
Studies outside the US that explore the impact of caregiving on the paid work hours of elder caregivers show mixed results. Maurer-Fazio et al. [2011] find that an elderly living in the household increases the likelihood of market work of prime-aged married women in urban China. Leigh’s [2010] and Nguyen and Connelly’s [2014] research on Australian working-age population, and Crespo and Mira’s [2014] study of European mature women, on the other hand, find a negative effect of eldercare on labor force participation. Jacobs et al. [2014] show that providing higher intensity eldercare in Canada increases the likelihood of retirement for the age 55-69 years. However, the studies by Schneider et al. [2013]
(on working population in Austria) and Meng [2013] (on age 36-63 individuals in Germany) find that eldercare has no effect on labor force participation.
The ambiguous findings may be due to differences in the sample and methodology and the fact that there is great variation in the level and intensity of unpaid eldercare provisioning. It can be given infrequently, say a few times a year or during once a month visits, or on a daily (or near daily) basis by a household member. The latter is likely to take on a greater toll on the provider in terms of the amount of time spent in providing basic (e.g. dressing, feeding, giving bath, etc.), instrumental (shopping, cleaning house, doing laundry, answering phone calls, etc.) and emotional (talking and listening, etc.) support and therefore may have a different impact on labor supply. In our study, we take into account the heterogeneity in eldercare giving and distinguish between frequent and infrequent eldercare. We also consider whether the impact on labor supply is likely to differ between female and male providers.
2.1. Data and sampling
This paper analyzes the 2011-2017 ATUS data collected by the US Census Bureau (US Bureau of Labor Statistics 2018a). ATUS interviews one randomly selected individual aged 15 years and older from a subset of households that have completed their eighth and final month of interviews with the Current Population Survey (CPS). The ATUS collects time diary and socio-demographic and labor market information. Since 2011, ATUS has collected information on eldercare using a supplementary module. ATUS defines eldercare as “not including financial assistance or help that one provided as part of her paid job, whether one has provided any other care or assistance in the last three to four months for an adult who needed help because of a condition related to aging” (US Bureau of Labor Statistics 2018a). The caregiver can be a family member or a non-family member. Eldercare includes activities such as assisting with grooming and feeding, preparing meals, arranging medical care, providing transportation, providing companionship, and being available (“on call”) to assist whenever help is needed. The ATUS eldercare module also collects information on the care recipient including age, frequency of care provided by the respondent-caregiver, relationship with the caregiver, whether co-residing with the caregiver or not, and the length of time the respondent has provided for each activity.
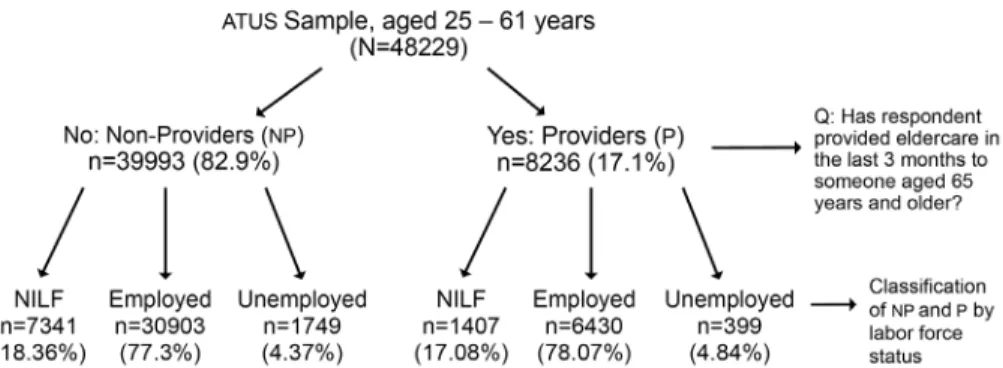
We examine the impact of eldercare on labor force participation among adults in their prime working ages (25 to 61 years). We restrict the upper bound of the prime working age to 61 years because an individual in the US can retire with partial social security benefits starting at 62. Since the retirement eligibility for workers 62 years or older may lead to bias in our estimation of the impact on labor force participation, we exclude them from the analysis. We also consider the possibility that the labor supply effect of unpaid eldercare is more likely to occur when it is performed on a regular basis. The frequency in which individuals do eldercare, whether for a few days during the year or several days a week, matters since the caregivers have to adjust their daily routine schedule to accommodate their care work. Figure 1 presents the distribution of 48,229 ATUS sample respondents aged 25-61 years as to whether they provided eldercare or not, based on their response to the following question: “Has respondent provided care to an elderly person (aged 65 years or older) in the last three to four months?” It also shows the distribution of the elder care provider (P) and non-provider (NP) respondents according to their labor force status. About 8,236 respondents2 (17.1 percent) are considered providers (P), i.e. individuals who have provided care to an elderly person (aged 65 years or older) in the last three to four months; out of which 1,407 (17.08 percent) are not in the labor force; 6,430 (78.07 percent) are employed and 399 (4.84 percent) are unemployed. A significant proportion (82.9 percent) of the sample consists of non- providers (NP), with 7,341 (18.36 percent) not in the labor force, while 30,903 or 77.3 percent employed and 1,749 (4.37 percent) unemployed.
2 Respondents with inconsistent and missing responses are also excluded from the sample.
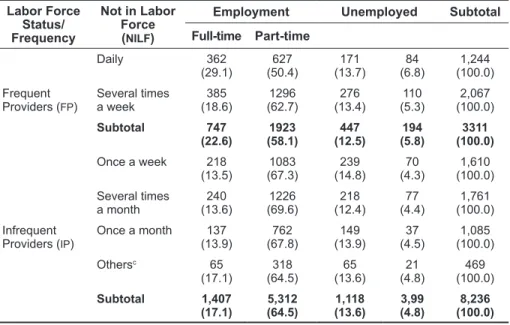
Eldercare providers (P) are further divided into two groups: frequent providers (FP) and infrequent providers (IP). FP provide care either on a daily basis or several times a week while those who provide care once a week, several times a month, once a month or several times a year are considered IP. Table 1 shows the distribution of P by frequency type and by labor force status. FP are more likely to be not in the labor force (22.6 percent) compared with IP (17.1 percent). IP on the other hand are more likely to be full-time employed (64.5 percent or higher) compared with the FP (58.1 percent).
TABLE 1. Distribution of eldercare providers (P), by frequency of eldercare and labor force statusa,b
Labor Force Status/
Frequency
Not in Labor Force (NILF)
Employment Unemployed Subtotal
Full-time Part-time
Frequent Providers (FP)
Daily 362
(29.1) 627
(50.4) 171
(13.7) 84
(6.8) 1,244 (100.0) Several times
a week 385
(18.6) 1296
(62.7) 276
(13.4) 110
(5.3) 2,067 (100.0)
Subtotal 747
(22.6) 1923
(58.1) 447
(12.5) 194
(5.8) 3311 (100.0)
Infrequent Providers (IP)
Once a week 218
(13.5) 1083
(67.3) 239
(14.8) 70
(4.3) 1,610 (100.0) Several times
a month 240
(13.6) 1226
(69.6) 218
(12.4) 77
(4.4) 1,761 (100.0) Once a month 137
(13.9) 762
(67.8) 149
(13.9) 37
(4.5) 1,085 (100.0)
Othersc 65
(17.1) 318
(64.5) 65
(13.6) 21
(4.8) 469
(100.0)
Subtotal 1,407
(17.1) 5,312
(64.5) 1,118
(13.6) 3,99
(4.8) 8,236 (100.0)
a Row percentages in parentheses.
b Not survey weight adjusted.
c Others refer to several times a year.
FIGURE 1. Distribution of 2011-17 ATUS respondents aged 25 to 61 years, by eldercare provision and labor force status
Table 1 indicates that as the frequency of eldercare increases, the likelihood of being in the labor force declines, implying that providing eldercare on a frequent basis can impose time constraints on the caregiver. FP and IP represent 40.1 percent and 59.9 percent respectively of P in the sample.
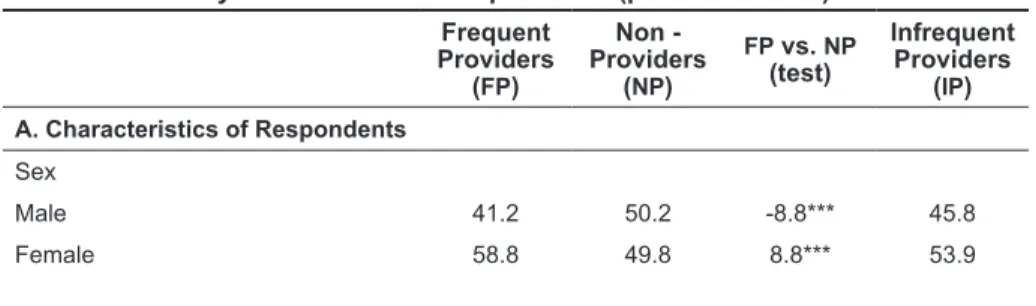
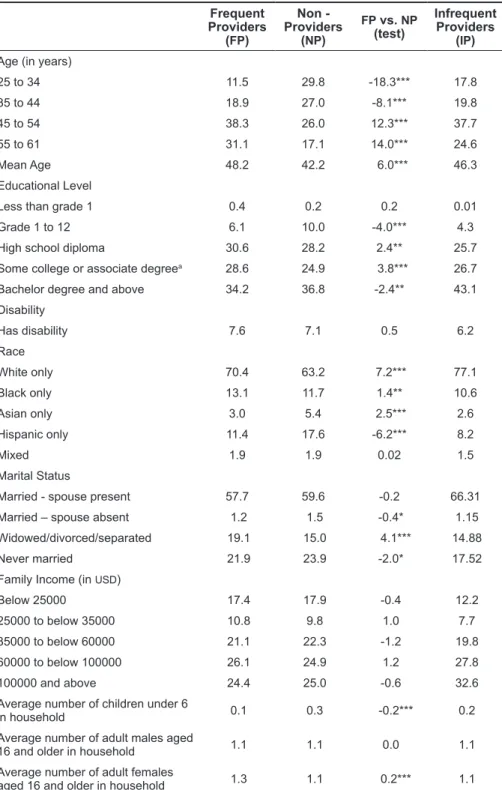
Table 2 provides the pertinent characteristics of the FP subsample. For comparison, we also include the characteristics of IP and non-providers (NP). Not surprisingly, the majority of P, whether FP or IP, are women. More than half of FP (58.8 percent) are women; they also constitute 53.9 percent of IP. Table 2 also shows that the likelihood of being an FP increases with age and then slightly falls as the FP gets older. The average age of FP (48.2 years) is higher compared to the NP (42.2 years) and IP (46.3 years). IP on the other hand have higher education level, with 43.1 percent having a bachelors’ degree or higher compared with FP (34.3 percent) and NP (36.8 percent). More than half (58.9 percent) of FP are married, most of whom have their spouses present. Nearly half (49.3 percent) of FP and half (50 percent) of IP have annual family incomes below USD 60,000, compared to 39.7 percent of IP.3 Other significant differences in the characteristics between FP and NP can be noted. Women are 8.8 percent more likely to be FP than NP. The average age of FP is higher than that of NP by six years. Around 4.1 percent of individuals who are widowed, divorced or separated are more likely to be FP than NP. Additionally, FP belong to households with more adult female members compared with NP.
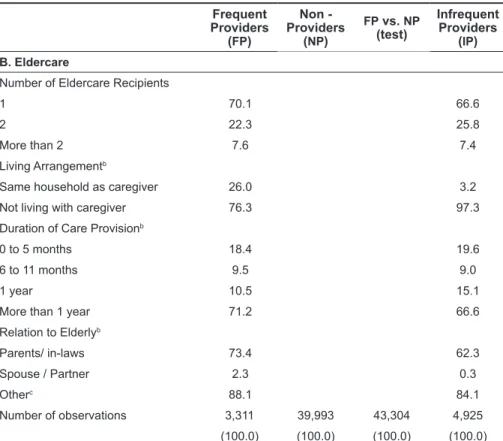
Table 2 also shows the characteristics of the elderly cared for by frequent and infrequent providers. The majority of FP (70.1 percent) and IP (66.6 percent) care for only one elderly person; however, more than one-fifth (22.3 percent) of FP and one-fourth (25.8 percent) of IP provide care to two elderly and another 7.6 percent care for more than two persons, suggesting that a number of P may be subject to stress. A higher proportion of elderly persons live with the FP (26.0 percent), compared to 3.2 percent living with the IP. Nearly a quarter (73.4 percent) of FP care for their parents or in-laws, compared to 62.3 percent of IP.
TABLE 2. Characteristics of sample respondents aged 25-61 years, by occurrence of care provision (percent of total)
Frequent Providers
(FP)
Non - Providers
(NP)
FP vs. NP (test)
Infrequent Providers
(IP) A. Characteristics of Respondents
Sex
Male 41.2 50.2 -8.8*** 45.8
Female 58.8 49.8 8.8*** 53.9
3 The median family income in the US (in current dollars) ranged from USD 50,054 in 2011 to USD 61,372 in 2017 [US Census Bureau n.d.].
TABLE 2. Characteristics of sample respondents aged 25-61 years, (continued) Frequent
Providers (FP)
Non - Providers
(NP)
FP vs. NP (test)
Infrequent Providers
(IP) Age (in years)
25 to 34 11.5 29.8 -18.3*** 17.8
35 to 44 18.9 27.0 -8.1*** 19.8
45 to 54 38.3 26.0 12.3*** 37.7
55 to 61 31.1 17.1 14.0*** 24.6
Mean Age 48.2 42.2 6.0*** 46.3
Educational Level
Less than grade 1 0.4 0.2 0.2 0.01
Grade 1 to 12 6.1 10.0 -4.0*** 4.3
High school diploma 30.6 28.2 2.4** 25.7
Some college or associate degreea 28.6 24.9 3.8*** 26.7
Bachelor degree and above 34.2 36.8 -2.4** 43.1
Disability
Has disability 7.6 7.1 0.5 6.2
Race
White only 70.4 63.2 7.2*** 77.1
Black only 13.1 11.7 1.4** 10.6
Asian only 3.0 5.4 2.5*** 2.6
Hispanic only 11.4 17.6 -6.2*** 8.2
Mixed 1.9 1.9 0.02 1.5
Marital Status
Married - spouse present 57.7 59.6 -0.2 66.31
Married – spouse absent 1.2 1.5 -0.4* 1.15
Widowed/divorced/separated 19.1 15.0 4.1*** 14.88
Never married 21.9 23.9 -2.0* 17.52
Family Income (in USD)
Below 25000 17.4 17.9 -0.4 12.2
25000 to below 35000 10.8 9.8 1.0 7.7
35000 to below 60000 21.1 22.3 -1.2 19.8
60000 to below 100000 26.1 24.9 1.2 27.8
100000 and above 24.4 25.0 -0.6 32.6
Average number of children under 6
in household 0.1 0.3 -0.2*** 0.2
Average number of adult males aged
16 and older in household 1.1 1.1 0.0 1.1
Average number of adult females
aged 16 and older in household 1.3 1.1 0.2*** 1.1
TABLE 2. Characteristics of sample respondents aged 25-61 years, (continued) Frequent
Providers (FP)
Non - Providers
(NP)
FP vs. NP (test)
Infrequent Providers
(IP) B. Eldercare
Number of Eldercare Recipients
1 70.1 66.6
2 22.3 25.8
More than 2 7.6 7.4
Living Arrangementb
Same household as caregiver 26.0 3.2
Not living with caregiver 76.3 97.3
Duration of Care Provisionb
0 to 5 months 18.4 19.6
6 to 11 months 9.5 9.0
1 year 10.5 15.1
More than 1 year 71.2 66.6
Relation to Elderlyb
Parents/ in-laws 73.4 62.3
Spouse / Partner 2.3 0.3
Otherc 88.1 84.1
Number of observations 3,311 39,993 43,304 4,925
(100.0) (100.0) (100.0) (100.0)
a Some college or associate degree includes individuals with occupational/vocational and associate degree.
b Some caregivers have provided care to more than one individual. Hence, the column percentages for living arrangement of care recipients, relationship to the recipients and the duration of providing care are greater than 100.
c Refers to aunt/uncle, grandparent, neighbor, etc.
d ***, ** and * denote level of significance at one percent, five percent and ten percent respectively.
e Statistics are survey weight adjusted.
3. Empirical analysis
We test whether providing eldercare affects the probability of participating in the labor force using probit regression and bivariate probit methods. In the first approach, we estimate the impact of frequent eldercare provision on labor force participation for individual i with the following model (Model 1) specification:4
LFi* = β0 + β1 Ei + βX Xi + γ + t + ε1 LFi = 𝕀(LFi* > 0); (1)
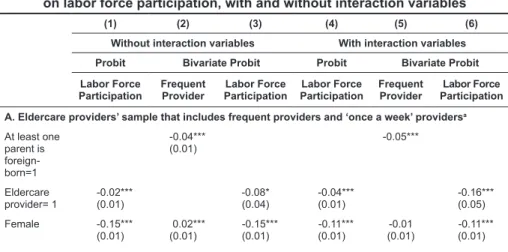
4 In our study, we only compare the labor force participation of FP with those of NP. Results of similar analyses comparing the labor force participation between IP and NP indicate no statistical significance. They are provided in Table A1, Appendix A. The empirical model already controls for race, education, and age.
where,
LFi* refers to the latent variable labor force participation of an individual i taking the value of one if the individual participates in the labor force and zero otherwise;
Ei refers to frequent eldercare giving, taking the value of one if the individual is a frequent eldercare provider and zero if non-provider;
Xi is a vector containing individual and household level control variables;
γ is a vector of state fixed effects;
t is a vector of time fixed effects; and ε1 is the error term.
The vector Xi includes the following variables namely: lifecycle stage (age and age squared), sex (female=1), level of education categories, disability status (controls for health-related issues), race/ethnicity, marital status, annual family income categories, and household composition (number of children in the household aged six and younger, number of male adults 16 years and older, and number of female adults 16 years and older).
3.1. Endogeneity issue and bivariate probit model
The relationship between eldercare provision and labor force participation, however, is endogenous, as both are simultaneously determined. In other words, it is also possible that individuals not in the labor force are more likely to provide eldercare on a frequent basis. To address the endogeneity problem, we simultaneously estimate the LF Equation 1 with the probability of providing frequent eldercare as shown in the following specification (Model 2):
LFi* = β0 + β1 Ei + βX Xi + γ + t + ε2 LFi = 𝕀(LFi* > 0); (2a) Ei* = α0 + α1 Zi + αX Xi + γ + t + ε3 Ei = 𝕀(Ei* > 0); (2b)
where the error terms are ε2 and ε3.
Model 2 is estimated by a recursive bivariate probit model that allows a structural equation modeling of a binary outcome (labor force participation) as a function of a binary endogenous variable (frequent eldercare provision, Ei*). The binary endogenous variable is, in turn, expressed in a set of reduced form equations. Although Equation 2a is similar to Equation 1, Equation 2b explicitly models the selection into eldercare provision. Identification of the model is achieved by excluding the Zi variable from Equation 2a. The correlation coefficient ρ measures the correlation between disturbances in the equations.
Disturbances in the equations capture the omitted factors. The recursive bivariate model is estimated by full information maximum likelihood.
ε2
ε3 ~N 0
0 1
ρ ρ
( ) [ ( ) · (
1) ]
We use the ATUS sample weights throughout our regression analyses. The ATUS weights take into account a) the issue of oversampling of some of the demographic groups, b) variation in the sampling of weekends and weekdays, and c) non-responses [US Bureau of Labor Statistics 2018b].
3.2. Selection of instrumental variable (IV)
In selecting the IV, we take into account the following conditions that the IV must satisfy: it is exogenous and not affected by other variables (Cov(Z,ε) = 0), and it is correlated with eldercare giving, which is the endogenous explanatory variable (Cov(Z,E) ≠ 0).
Johnson and Lo Sasso [2006] use the age of parents as one of the instruments for identifying childcare obligation in the US. Alternatively, Meng [2013] uses parental residence, i.e., whether parents live in the household or not, as instrument for determining the likelihood of providing informal care in Germany. In the absence of information on parental residence or age in ATUS, we use parental birthplace as a proxy in deducing whether parents live nearby and thus may need care from the respondent. We use the parental birthplace (at least one of the parents is foreign-born versus both parents are US-born) as instrument to determine the selection into frequent eldercare provision.
Based on the parental birthplace information, FP and NP subsamples are sorted into the first, second and third-generation respondents living in the US. The first- generation (immigrants) are foreign-born themselves. The second-generation respondents are native-born with at least one foreign-born parent, while the third- generation respondents constitute the native-born with both US-born parents.
The exclusion variable Zi is equal to one for both first and second-generation respondents. More than 99 percent of foreign-born individuals in our sample have at least one foreign-born parent. The Zi compares the frequent eldercare provision of the third-generation (Z=0) subsample with the combined first and second- generation subsample (Z=1).
In the US, the third generation mainly comprises Baby Boomers born from 1946 to 1964. The youngest boomers will turn 65 by the year 2030 [Passel and Cohn 2017]. The exogenous demographic shift in the US population (towards older age cohort) makes the third generation older than individuals in the first and second generations. As such, third-generation individuals are likely to have parents or families who are older and demand care. Additionally, foreign-born parents of the first generation are more likely to reside outside the US. As such, the instrument is expected to have a negative correlation with frequent eldercare provision. Individuals with at least one foreign-born parent are less likely to provide frequent eldercare.
The potential strength of the instrument is tested by the estimation of Equation 2b using the probit model with and without the control variables and the results are given in Table B2 in Appendix B. The sample distribution of the FP and NP
sample by the exclusion variable Z and the covariate balance statistics are given in Tables B1 and B3 of Appendix B. The marginal effects of the probit model with control variables show that individuals with at least one foreign-born parent are three percentage points less likely to be a frequent eldercare provider and these are statistically significant (see Table B2 in Appendix B).
In addition to the relevance of the instrument, it is essential that the instrument be exogenous. Parental birthplace satisfies the exogeneity condition of the instrument and therefore cannot be influenced by the labor force participation or frequent eldercare provision. It is also critical to argue that the instrument only affects the labor force participation through selection into frequent eldercare provision.
Without the availability of a direct statistical technique to test whether the instrument only influences labor force participation through eldercare, it is difficult to establish such criteria. Instead, we review the literature for supporting evidence.
We examine whether there is any evidence of parental birthplace directly determining the labor force participation in the US. Trevelyan et al. [2016] show that the average labor force participation rate of the first and second generations in the US is 62.4 percent, whereas the labor force participation rate of the third generation is 63.2 percent. The very small gap in the labor force participation rates across generations negates the idea that the instrument has a direct influence on the outcome.
Enchautegui [2014] argues that the difference in the labor force participation across generations is predominantly due to the exogenous demographic shift related to the aging of the Baby Boomers. The control variables namely age and age squared in Model 2 capture this impact of lifecycle on labor force participation.
Taking the above study findings into account, we then estimate a probit model that takes into account the effect of the IV on labor force participation. The results of our estimation with control variables are given in Appendix B, Table B2 and shows that parental birthplace does not influence the respondents’ labor force participation.
We also examine other potential channels through which the instrument may determine labor force participation. The US Bureau of Labor Statistics [2018c], Trevelyan et al. [2016], Americans [2013], and Myers et al. [2013] studies show that first, second and third generation cohorts differ by race, age, marital status, educational attainment, household income, fertility, and household sizes. Model 2 controls for race, age, marital status, educational attainment, and annual family income. The number of children under six years in the model is used as proxy for fertility rate, and the number of adult males and females above 16 years for household size.
It is also possible that the nativity of the individual affects labor force participation and is highly correlated with parental birthplace. Non-natives are more likely to have at least one parent born outside the US. In 2017, the labor force participation of the foreign-born was 74 percent, and the native-born was 71.8 percent in the US (OECD [2017a], OECD [2017b]). According to the US Bureau of Labor Statistics (2018c) report, the gap in the labor force participation between the foreign-born and US-born (native) workers is mainly due to differences in
race, education, and age.5 Except for Johnson and Lo Sasso [2006] study, none of the existing studies that examine the relationship between eldercare and labor force participation controlled for nativity. In fact, Johnson and Lo Sasso [2006]
find no evidence of the effect of nativity on the working hours of respondents.
Thus, the lack of correlation between the respondent’s birthplace and labor force participation is indirectly confirmed by these study findings. Therefore, parents’
nativity is also unlikely to be related to labor force participation.
Finally, whether or not the instrument influences labor force participation through other unobservables is examined. For instance, cultural differences across generations can be a potential channel through which the instrument can influence labor force participation. In this study, we use state fixed effects and race/ethnicity variables to control for any variation in cultures across states and ethnicity. The presence of a potential unobservable is also tested by examining the covariate balances and evaluating the standardized difference,6 variance ratio,7 and the overlap coefficient8 between the two groups, i.e., individuals with at least one foreign-born parent and individuals with both US-born parents. The idea is to demonstrate that a balance in the covariates9 by parental birthplace also suggests a balance in the unobservables. As such, the unobservables may not be an issue in the empirical analysis. Similar to what is suggested in the literature, the standardized difference test shows covariate imbalance for White, Asian, Hispanic and individuals with educational attainment of grade 1 to 12 (See Table B3 in Appendix B). For the other covariates, all three test results show a balance in the sample. Hence, we conclude that the exclusion variable, parental birthplace meets the IV criteria.
3.3. Gender dimensions of frequent eldercare impact on labor force participation
We next analyze the gendered impact of frequent eldercare on labor force participation by extending Models 1 and 2 in the previous section. The extended models take into account the gender differences in providing eldercare and in labor market participation. Gender norms around care responsibilities and household division of labor and persistence of gender-based occupational segregation in the labor market are likely to lead to different outcomes for women and men [Neumark 2018]. In particular, we expect women are less likely to be in the labor market and more likely to be frequent eldercare providers.
5 The empirical model already controls for race, education, and age.
6 Standardized difference assesses differences of selection groups in the means.
7 Variance ratio is the ratio of the variances of the characteristics by two groups determined by IV.
8 Overlap coefficient is a measure of the closeness of the location of two distributions.
9 We do not use t-test to examine the characteristics balance across the IV groups. In this paper, the observations across FP and NP are unbalanced. When distributions are sensitive to the variance differences between the groups, t-test with the assumption of equal variance or even unequal variance can be misleading. The sensitivity of the distributions is also evident in the estimated overlap coefficients provided in Table B3, Appendix B.
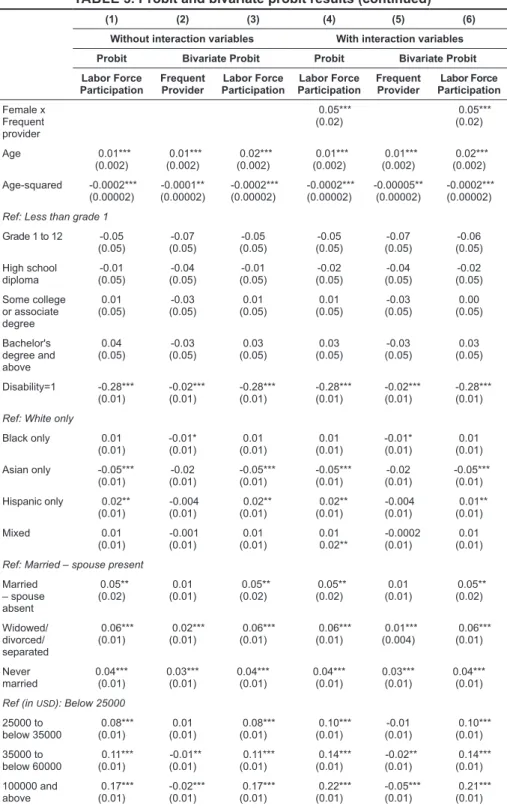
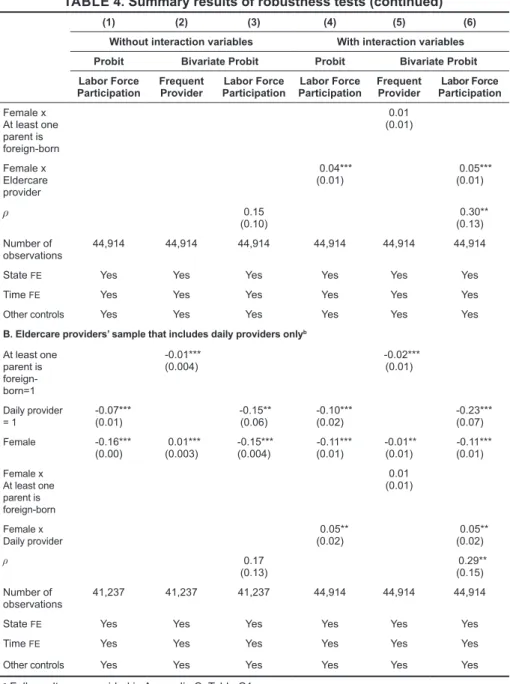
Models 1 and 2 are re-estimated by including two interaction variables: female dummy interacted with frequent elder caregiving and female dummy interacted with family income category. This is expressed as follows (Model 3):
LFi* = β0 + β1 Ei + β2 Fi + β3 (Fi × Ei) + β4 Yi + β5(Yi × Fi) + βx Xi + γ + t + ε4
LFi = 𝕀(LFi* > 0); (3)
whereby:
Fi refers to the sex of respondent, female takes the value of 1 and male is 0;
Ei refers to frequent eldercare provision (=1);
Fi × Ei refers to the interaction variable between sex and frequent eldercare provision;
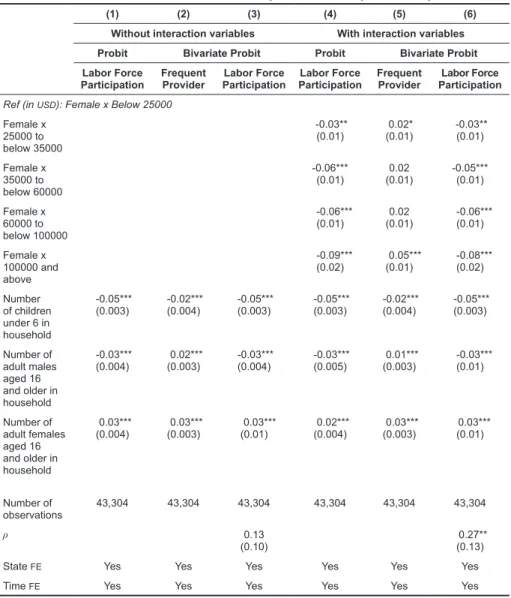
Yi refers to the dummies for family income ranges (in USD), e.g., below 25,000 (reference), 25,000 to below 35,000, 35,000 to below 60,000, 60,000 to below 100,000, and 100,000 and above;
Yi × Fi : interaction variable between sex and family income categories; and Xi : is a vector containing other individual and household level control variables.
The coefficient of the interaction Fi × Ei helps identify whether or not frequent eldercare performed by women is associated with lower labor force participation, more so than among male frequent providers. The interaction variable Yi × Fi is added in order to examine whether women are more likely to work in the labor market when they have to (belong to a lower income group) compared to men.10 In other words, it captures the extent to which the economic necessity to earn income is greater for women compared to men. We expect that although caregiving is considered to be women’s primary responsibility, female FP in lower income households may be more compelled to earn income in order to help meet basic needs even if they also provide eldercare, compared to men FP. Men on the other hand are socially expected to be breadwinners or economic providers, regardless of economic status. This gender norm is challenged, however, when men provide frequent eldercare, say to their spouse or a parent and so to ease their workload, they withdraw from the labor market.
As mentioned earlier, there is an endogeneity problem given that labor force participation and eldercare provision are simultaneously determined. To address this issue, we estimate a bivariate probit with IV model (Model 4), which is an extension of Model 2:
LFi* = β0 + β1 Ei + β2 Fi + β3 (Fi × Ei) + β4 Yi + β5 (Yi × Fi) + βX Xi + γ + t + ε5
LFi = 𝕀(LFi* > 0); (4a)
10 Bradbury and Katz [2008], Albanesi and Prados [2011], and Hua [2014] studies show that spousal or family income is an important determinant of labor force participation of married women in the US. However, the ATUS data does not include spousal income for married women; moreover, the sample includes respondents with different marital status, e.g., never married, separated, divorced, widowed, married with spouse absent and married with a spouse present.