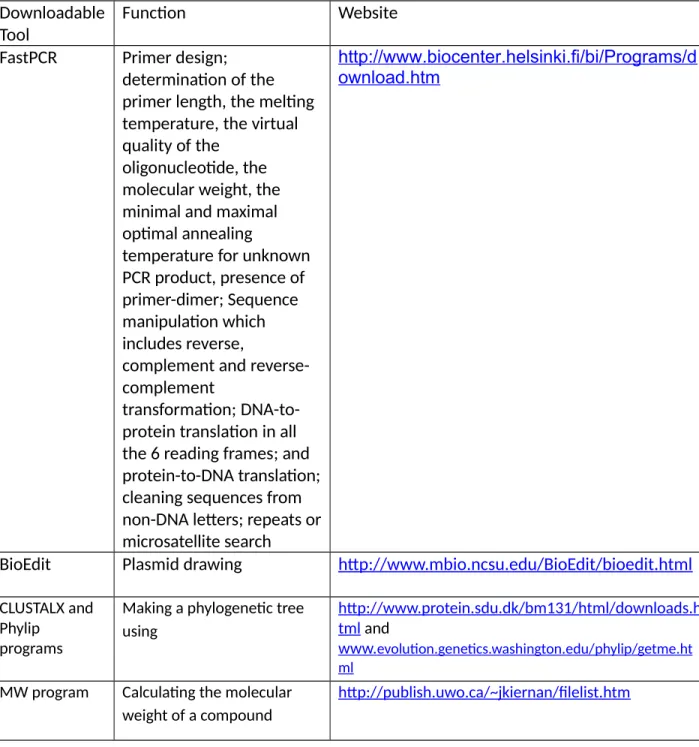
Specifically, this study will create a list of freely available bioinformatics tools and web-based resources through a needs-based method. It is also worth mentioning here that all bioinformatics tools and resources included here are free. The goal of this study is to accelerate access to free bioinformatics tools and web-based resources and present them in a way that is easy to use even for beginners.
The specific goals are: (1) to collect and catalog commonly used and freely available bioinformatics tools and web-based resources. Improved access to some of the bioinformatics tools in case of internet connection limitation will be provided by free. Collection and cataloging of commonly used and freely available bioinformatics tools and web-based resources.
The tools mentioned will be listed and grouped according to the bioinformatics tools used together, including databases. BlastDigester Generating CAPS markers http://www.bar.utoronto.ca/ntools/cgi-bin/ntools_blast_digester.cgi.
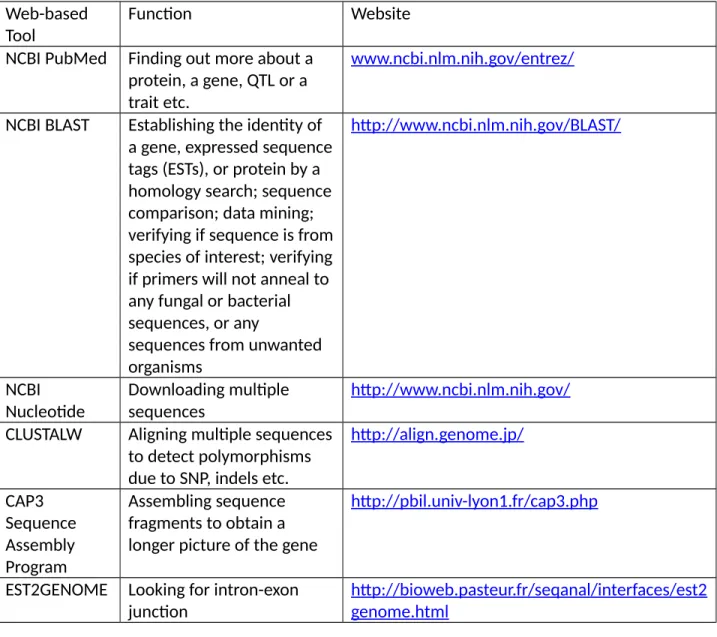
Finding out more about a protein; a gene, a trait etc; Searching nucleotide; Retrieving protein and DNA sequences;
Establishing the identity of a gene, expressed sequence tags (ESTs), or protein by a homology searches;
In "database", select "Others", as we do not want to limit our search to human or mouse sequences. Note that there are several other options, but for the sake of simplicity, we're fine with the default. At this point we have confirmed that the identity of our EST is trypsin-like.
By convention, the e-value must be less than or equal to 1 x 10⁻⁴ for the agreement to be valid. Click on the highlighted number which in this case is the number of CoreNucleotide records. Let's say that we are only interested in downloading the FASTA format of the rice tungro spherical virus sequences.
So what we do is click on the screen dropdown and change it from 'Summary' to 'FASTA'. Then we click on the 'send to' drop-down menu and select 'file' to download all the series, or just the ones you selected.
Aligning multiple sequences to detect polymorphism due to SNP, insertion, deletion etc.;
Assembling sequence fragments to obtain a longer picture of the gene;
What you do is enter the above sequences into this online program called CAP3, a DNA sequence assembly program. Here now is a more complete DNA sequence of the gene after assembly of the smaller DNA sequences.
Looking for intron-exon junction
Here you can see a graphical representation of the splice junction showing the exact location of the intron. Predicting the Function of a Specific DNA Sequence As an example, you might have the following sequence:.
Prediction of function of a certain DNA sequence Just as an example you may have the following sequence
Establishing presence of targeting sequences either from mitochondria or chloroplast
Finding out about the taxonomical hierarchy of a certain organism;
Data mining using BLAST; to verify that your sequence is truly from your species of interest, not from some unrelated organism; verify about primers.
Data mining using BLAST; verifying if your sequence is really from your species of interest not from any unrelated organism; verifying if primers
In the database, select Others, and in the drop-down menu, select "Nucleotide pool (nr/nt)". You may have a protein of interest or an enzyme, and for whatever reason, you find it necessary to see which biochemical pathway it is involved in.
Removing contamination in a sequence like vector sequences, and other artifacts;
Restriction mapping for finding out the enzymes that could cut a DNA sequence
Finding the open reading frame;
Deducing the physico-chemical property of a protein;
Finding domains in protein
Verifying the location of primers in rice genome
Click the 'view' button for the forward or reverse primer to see their matches in the rice genome. From here, you need to gather more information or evidence to truly determine the location or target of your primer. Clicking the "view" button of our reverse primer showed that it is located on chromosome 1.
So if your initial search didn't work, you can try another search term that is synonymous with the property you're interested in. This gives us a list of tabulated results that include the attribute name, attribute category, linkage group and map position. Let's say that we are interested in Oryza sativa drought, so we click on the 'QTL Accession ID' of the second entry in the table result.
To see the position of the QTL in the context of a genetic map, click on 'View Comparative Map'. To see other traits or QTL that are on the same chromosome as your trait of interest (e.g. Needless to say, there are also several links of interest such as marker association, related ontologies and references.
Find the location of a marker in the genome?
As an example, we enter the rice aroma marker RM223 in the function name. To find more information about the marker, you can click on the 'Feature Details' link above.
Find markers for fine mapping?
Suppose we need more markers other than the one or few we have (eg RM223). Click on the 'Map Viewer' one after the other until you find one containing the marker RM 223. To highlight the marker RM223 and reveal the adjacent markers, click the "Feature Options" box.
Get a list of predicted genes within a QTL region?
To export the file containing the genes between the two markers (S12564 and S10019), go to the left side of the screen and search for 'Export Data' as shown below. Click on the drop-down list and for the sake of example select 'Tab-separated values' below. Then go to: http://www.bar.utoronto.ca/ntools/cgi-bin/ntools_blast_digester.cgi.
To obtain DNA or protein sequences, visit the NCBI site: www.ncbi.nlm.nih.gov. If you have the accession number for the specific nucleotide you are looking for, you can enter it in the blank space provided. For example, you can click on number 2 and the following web page will appear with the nucleotide sequences of RTSV.
For example, we have the following sequences, and the primers below to amplify certain regions of DNA. To extract the sequence you want, first click on the desired first restriction enzyme and then on the second restriction enzyme. Extract by going here: http://www.sanbi.ac.za/%7Ermuller/SMS/index.html and paste the content of a Genebank entry.
To quickly transform a GenBank format to FASTA format, go here: http://www.bioinformatics.org/sms/. To align two DNA, RNA or protein sequences, go to: http://insilico.ehu.es/align/. Go to http://wishart.biology.ualberta.ca/PlasMapper/index.html and enter the sequence of your plasmid as shown below.
We click on the hyperlink 'rice tungro spherical virus' and we are presented with the web page below. For more information about a bacterial genome, visit http://www.ncbi.nlm.nih.gov/genomes/static/eub.html. We can click on the hyperlink 'Bacillus thuringiensis serovar aizawai' for more information about this strain of Bacillus thuringiensis.
Go to: http://www.ebi.ac.uk/Tools/clustalw2/index.html and paste the entire edited document. For example, you have the following two sequences and you want to perform a pairwise alignment.
Searching for a new bioinformatics tool
Go here to download the program:. http://www.biocenter.helsinki.fi/bi/Programs/download.htm. Each primer combination in the Result2 notebook includes information on primer position and length, optimal annealing temperature, and product length. N1 stands for the shortest product (minimum 30 bp) and N2 for the longest PCR product (No limit).
It is better to change the location of the primer search than to change the default design conditions. Only if a small field of primers or primers for degenerate sequences or low GC% (or other very specific criteria) is required, the default condition should be changed manually. To load this, go to the "PCR" drop-down menu and then select "PCR Primers (Probes) Options".
VERIFICATION OF CASES FOR COMPATIBILITY AND PREDICTION OF ANEANING TEMPERATURE The program allows determining the optimal PCR annealing temperature for PCR with an.
CHECKING PRIMERS FOR COMPATIBILITY AND PREDICTION OF ANNEALING TEMPERATURE The program allows to determine the PCR optimal annealing temperature for a PCR with an
The program will immediately display the primer length, melting temperature, virtual quality of the oligonucleotide, molecular weight and the minimum and maximum optimal annealing temperature for unknown PCR products. Enter the sequences above by going to the 'File' menu and then selecting 'New Text'. The sequences are formatted in such a way that the number '4' at the top of the sequences represents the number of sequences to be analyzed.
Save the alignment as a Phylip file by going to File, then 'Save sequences as', select Phylip and name the file as alignment.phy. Copy your alignment.phy file and save it to the folder where you can find the DNAdist program. There may seem to be no rhyme or reason to the ordering of these tools, and that is because ultimately the different combination of said tools depends to a large extent on the target or purpose of the user.
Batch automated annotation of bulk biological sequencing is one of the key applications of bioinformatics tools. For example, the (fictitious) transcription factor ZQ1 usually binds to the sequences AAAGTT, AAGGTT, or AAGATT. Scatter plot A scatter plot is a method of summarizing data that is often used in exploratory data analysis to illustrate the main characteristics of a data distribution in a convenient form.
True family members are then easily identified because they have all the fingerprint elements, while subfamily members can be identified if they only have part of the fingerprint. The alignment tries to match them end-to-end, although parts of the alignment aren't very convincing. Searching for homology and similarity Given a newly sequenced gene, there are two main approaches to predicting structure and function from the amino acid sequence.
The transfer of structure/function information to a potential homologous protein is straightforward when sequence similarity is high and extended in length, but assessment of the structural significance of sequence similarity can be difficult when sequence similarity is weak or limited to a short region. Some of the most common search parameters in bioinformatics tools include the stringency of an alignment search tool and the weights (penalties) set for mismatches and gaps. QTL; Quantitative Trait Loci The type of marker described by statistical association with quantitative variation in a particular phenotypic trait believed to be controlled by the cumulative effect of alleles at multiple loci.; QTLs are essentially a statistical construct that identifies a particular region of the genome as containing a gene (or genes) associated with the phenotype being measured.