18
ONLINE AND IN-STORE SHOPPING PREFERENCES AMONG BUSINESS AND ACCOUNTANCY STUDENTS OF A PRIVATE HIGHER EDUCATION INSTITUTION
Rodalyn E. Daylo, PS Charity E. Alibogha and Teresita E. Crucero
Melody Bautista, Marry Joy Bendiola, Kathleen Rose Fajarillo, Eunice Einjel Lustre and Angel Grace Villagomez
A BSTRACT
he purpose of this descriptive research is to determine the level of preference between online and in-store shopping among Business Administration students of a private higher education institution in Iloilo City for Academic Year 2022. The 339 study participants were randomly selected and categorized according to age, sex, degree program, and location. The data gathered using a duly validated and pilot-tested instrument developed by the researchers were analyzed using frequency count, percentage, mean, t-test, and one-way ANOVA at .05 level of significance. Majority of the business students are young adults, dominantly female with specialization in Business Administration, and mostly residents outside of Iloilo City. Online shopping was highly preferred in terms of product, promotion, price, and process, while in-store shopping was highly preferred in terms of product, price, place, people, and process. Found to be determinants of the online shopping preference are age and degree program. Finally, in- store shopping is still preferred over online shopping in terms of product, place, people and process, while online shopping is preferred for promotion and price.
Keywords: Online Shopping, In-store Shopping, Preferences, 6Ps Model, Business and Accountancy Students
I NTRODUCTION
Background of the Study
Shopping is necessary in life. People shop for their needs and wants, and to remove stress. In an article by Cleveland Clinic (2021), clinical psychologist Scott Bea said that shopping can help people feel better, and research suggests that shopping done in moderation actually has lots of psychological and therapeutic value. There is the psychological and emotional boost when adding items into
the cart or visiting a favorite boutique.
Brain-fueled happiness can also be achieved by just going window shopping or online browsing. Moreover, in the experiment done by Rick et al (2014) shopping restores one’s personal control over the environment and reduces residual sadness. Today, there are two modes of shopping, the online shopping or electronic shopping and the in-store shopping or traditional shopping.
T
19 Through the years and as technology
becomes more advanced, online shopping has continually developed. The earliest e- commerce platform that allows users to do online transaction processing between businesses and customers, and businesses and businesses (Donszem, 2020) was developed by Michael Aldrich.
With the pandemic, buying and selling online has become an essential part of many people’s lives. Online stores allow people to buy goods from the comfort of their homes without any help or pressure from a salesperson. Virtual marketplaces are platforms for a new and more convenient place for buying goods and services online. Whereas, in-store shopping started in 1700s (Meyer, 2021).
It is the traditional mode of buying and selling that requires one to leave home to go to the physical store to buy goods and services. In-store shopping enables people to see the actual product before completing the buying process. Aside from that, people can get the product right away.
With the existence of various online shopping applications in the Philippines, there is no doubt that the frequency of online shopping has risen dramatically. In fact, based on NielsenIQ, the number of households shopping online increased by 325% in 2020 (Llamas, 2021). The closure of all non-essential establishments and the restrictions enforcing people to stay at home and to practice social distancing because of Covid-10 pandemic have driven people to do online shopping (Rakuten Insight, 2021). Despite the restrictions, there are still many people who opt to do in-store shopping.
According to Raydiant (2021), some consumers prefer in-store shopping because they can view, touch, and even
interact with the product, the experience that the location provides, and the fact that there is no need to wait for delivery. About 80% of consumers will go to a store to satisfy their wants or needs (Pollak, 2018).
Previous research had recognized the factors that affect consumers' perceptions when deciding which medium of shopping they prefer. However, in the current situation of the world, where the Covid-19 virus has reshaped consumer buying behavior and completely changed how different industries operate, there is an insufficiency of studies, specifically, local studies, that compare both online and in- store shopping. There has been a local study about the comparison between online and physical channels (Dumangas et al., 2021), but it only investigated the level of satisfaction with both channels and did not compare which channel is preferred by customers.
The researchers, whose interest is in the field of business, wanted to gain knowledge on the customers’ preference between online and in-store shopping in the hope to discover relevant insights that will be helpful in making decisions for possible business ventures. In addition, a study on shopping preference of the customers can be beneficial to existing businesses and will also lead to new information about customer preference and behavior in shopping in the new normal, thus, this study was conducted.
Objectives
The purpose of this study was to determine the online and in-store shopping preferences among business and accountancy students of a private higher education institution for academic year 2021-2022. Specifically, it sought to:
20 1) describe the profile of the
participants when classified according to age, sex, degree program, and location;
2) determine the level of preference for online shopping among the participants in terms of product, promotion, price, place, people, and process when taken as a whole and when classified according to age, sex, degree program, and location;
3) determine the level of preference for in-store shopping among the participants in terms of product, promotion, price, place, people, and process when taken as a whole and when classified according to age, sex, degree program, and location;
4) determine if there are significant differences in the level of preference for online shopping among the participants in terms of product, promotion, price, place, people, and process when classified according to age, sex, degree program, and location;
5) determine if there are significant differences in the level of preference for in- store shopping among the participants in terms of product, promotion, price, place, people, and process when classified according to age, sex, degree program, and location; and
6) determine if there are significant differences in the level of preference for online shopping and level of preference for in-store shopping among the participants in terms of product, promotion, price, place, people, and process.
Hypothesis
Based on the above objectives, the researchers proposed the following hypotheses:
1) There are no significant differences in the level of preference for online shopping among the participants in terms of product, promotion, price, place, people, and process when classified according to age, sex, degree program, and location.
2) There are no significant differences in the level of preference for in-store shopping among the participants in terms of product, promotion, price, place, people, and process when classified according to age, sex, degree program, and location.
3) There are no significant differences in the level of preference for online shopping and level of preference for in- store shopping among the participants in terms of product, promotion, price, place, people, and process.
Theoretical Framework
In the conduct of this study, the Paul Samuelson’s revealed preference theory was the basic foundation. It assessed the preferences by determining which alternative is preferred by consumers and which are likely to work as desirable choices. Consumers’ preferences depend on what they acquire under different situations or circumstances, specifically under income and price conditions. The theory posits that if a consumer acquires goods, then that good is considered to be preferred or “revealed preferred” to any other goods. In addition, the theory advances the idea that the consumers are able to rate packages of goods depending on the satisfaction they gain from them. In other words, with the different combinations of goods, there are also different preferences among consumers (Roper & Zin, 2013). The consumers have distinct tastes over the various combinations of goods. This different preference of consumer varies among individuals depending on their likes, dislikes and their taste. They are affected by different personal characteristics and these are measured by the insight of the practicality and benefits of the products (Guleria 2015). The theory allows
21 businesses to understand more their target
audience and be able to craft products, services and company culture to influence buying habits.
Conceptual Framework
Since the study was not on consumer preference for goods and services but on the mode of shopping, instead of having alternative combinations of goods to rank, a combination of shopping features using the 6Ps of the marketing mix was conceptualized. According to the P6 Integrated Model for Customer Decision Making by Sun, Sun and Meredith (2012), the 6Ps consists of product, promotion, price, place, people, and process. Product has to do with the characteristics of an item that the sellers offer; price is the value that sellers pegged as the worth of the product that they offer; place is about the techniques used by the seller in making the product available to the customers;
promotion encompasses the strategies that the sellers used to attract customers;
people are the individuals who are directly engaged in delivering the product or service to the customers to include their ways in providing service during and after sales; and process is the series of steps that the customer may undergo when purchasing a product to include the return, exchange and refund policy, the security and privacy policy as well as the payment options. All these Ps are provided by both the online and in-store sellers for the shopping experience of the customers.
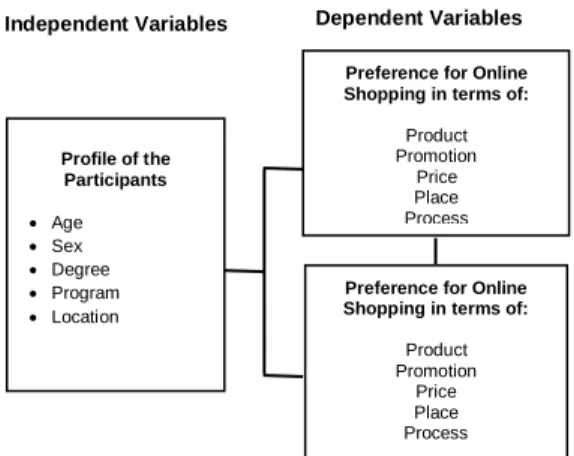
Integrating the 6Ps in the theory of consumer preference, a research paradigm shown in Figure 1 was developed to serve as a graphical representation of the interplay of the variables. The independent variables are
the age, sex, degree program, and location of the participants, while the dependent variables are the participants’ level of preference for online shopping, and level of preference for in-store shopping in terms of product, promotion, price, place, people and process.
Definition of Terms
For the purpose of clarity and common understanding of the important terms used, they were defined operationally.
Age. It is a categorical variable that classified the participants into three groups, namely, 18 to 21 years old, 22 to 25 years old, and 26 and above.
Degree program. It refers to the participants’ classification according to their course such as BS Accountancy, BS in Management Accounting, BS in Advertising, BS in Business Administration, and BS in Entrepreneurship.
Location. It is a categorical variable used to classify the participants based on their place of residence, either they are settlers within or outside Iloilo City.
Independent Variables Dependent Variables
Profile of the Participants
Age
Sex
Degree
Program
Location
Preference for Online Shopping in terms of:
Product Promotion
Price Place Process
Preference for Online Shopping in terms of:
Product Promotion
Price Place Process
Figure 1. Shows the research paradigm showing the perceived relationship among variables
considered in the study.
22 Preference for in-store shopping.
This refers to a person’s penchant for a mode of shopping that allows the customers to visit and purchase from a physical store measured in terms of product, promotion, price, place, people and process.
Preference for online shopping.
This refers to a person’s penchant for a mode of shopping that allows the customer to purchase through online stores measured in terms of product, promotion, price, place, people and process.
Sex. It refers to the physical differences between people according to their physiological attributes and was also used to classify the participants to either male or female.
Significance of the Study
This study adds to the existing business literature by providing research- based data and insights on the comparison between online shopping and in-store shopping preferences and adds to a better understanding of the 6Ps (product, price, place, promotion, people, and process) as the areas of preference among customers.
Specifically, the study beneficiaries are the sellers, managers, consumers/customers, investors, financial analysts, researchers, and future researchers. With this study, the sellers may gain insight to the shopping preferences of customers which they can use in reassessing or evaluating how they use the 6Ps to attract and retain customers. The managers can learn from the study the areas they need to improve in terms of the 6Ps for online and in-store shopping. The customers, through this study, can better understand their values and preference towards shopping, as well as, gain more knowledge about online and
in-store shopping. This study can aid investors in the selection of investment opportunities in online or in-store shops.
The financial analysts, through this study, may use the results of the study to help online and in-store companies make better business decisions based on customer shopping preference. The researchers, through this study, generated relevant knowledge on customer shopping preferences which can help them decide whether to venture to an online or in-store business in the future. Finally, the future researchers may gain insights from the results of the study which can be useful in their future investigations related to the topic at hand.
Scope and Limitations of the Study This study was conducted to determine the level of preference between online shopping and in-store shopping among Business and Accountancy students of a private higher education institution in Iloilo City for academic year 2021-2022. Participants of the study were the 339 out of 2,214 total enrolment of the College of Business and Accountancy across year levels and degree programs.
The participants were randomly selected and were profiled according to age, sex, degree program, and location.
A validated and reliability-tested rating scale developed by the researchers, converted into google form was used to gather data. The data gathering was done through online platform like e-mail and messenger. The data gathered from the participants were treated confidentially and were used as the primary source of information for this study. Data analysis was done with the use of statistical tools like frequency, percentage, mean,
23 independent samples t-test, and one-way
ANOVA at 5% level of significance.
R
EVIEW OFL
ITERATURE/S
TUDIESThere had been a rampant change in the way customers shop. Although there are still many people who buy in-store, customers found online shopping to be beneficial. Online shopping is useful for people who are busy to spend time shopping. In today’s generation, trade and commerce have expanded that online shopping has increased throughout the world. According to Vissers (2020), trade and commerce has been shifting to a rate that have never been seen before.
Whether one is starting an online business or upgrading and expanding an online store, the utmost goal is to assure that customers have the most entertaining, smooth and efficient experience possible.
Having fast internet speed, fully searchable good quality product, a platform designed to work in exactly the same way across devices, an easy checkout process, good delivery policies, an array of payment options, well founded product descriptions, good customer support, multichannel storefronts and convenience are the attributes that can be applied to attract customers to purchase
online repeatedly.
When physical shopping becomes tough, or even scary, customers are more inclined to shop online (McAdams, 2021).
Retailers have now taken the challenge of embracing emerging technologies which create connections with shoppers and provide a convenient customer experience. The advantages of online
shopping include absence of check-out queues, ability to shop anytime and anywhere, package delivery right at the customer’s doorstep, ability to store customer information and purchase history, availability of customer feedback and product reviews, timely receipt of discount and sale notifications and reminders. While there are a lot of advantages for online shopping, there are also some downsides to it. Occurrence of doubtful deals or deals that are different from the website’s description, limited seller-customer interactions, unsatisfactory customer service due to the use of chatbot or chat robot or difficulty in contacting sellers or customer service specialist when disputes and problems arise, placement of purchase to back order after checking out, inability to inspect a product thoroughly before purchase, incurrence of additional costs for returned products due to errors in size, model, fabric, color or quality, delayed delivery of products due to weather conditions, and expensive shipping fees.
According to Kastro (2020), companies that place an online option of their business strategies are set for the post Covid-19 era, and there are a lot of opportunities for businesses that are used to in-store selling. People’s lifestyles have changed in recent years. They are irritated by crowded shops and are less patient in queues. Online shopping is the preferable medium for shopping over the internet
24 because it allows customers to save time
and energy, and it provides them 24-hour access to products found online. It also permits them to reach out to various international brands at any time and have everything available on a single platform rather than visiting multiple locations.
Moreover, online shopping has become the most preferable medium because of the large discounts and special deals (Kaur, 2018; Dipti, 2019; Sunitha &
Gnanadhas, 2014).
Despite the fact that online shopping is booming because of convenience and wide variety of products it brings, issues such as security, product quality, and product delivery must be addressed accordingly (Kumar & Khurana, 2019).
Francia (2018, as cited in Joven et al., n.d.) argued that before making a purchase, Filipino customers prefer to view the items personally and are very conscious of the shipping fees and delivery time. They have more confidence when they see the items before payment, and being able to pick up the item immediately gives them peace of mind.
Covid-19 also made impacts on online and offline shopping. Consumers prefer online shopping for convenience, safety, and compliance to restrictions and lockdown policies (Matz, 2021; Jeb &
Choura, 2021). The constraints imposed by Covid-19 resulted to less entertainment in offline shopping which discouraged shopping or buying from physical stores.
These three behavioral patterns play crucial roles in motivating people to choose between online and physical channels.
The regular use of online shopping brings people to shift their criteria to achieve the goods and services they need. Buyers are often wiser because they try to regard the
prospects' opportunity costs they may experience if they purchased traditionally, including time, effort, and productivity (Legaspi et al., 2018).
Going back to the study of Kaur (2018), it further showed that youngsters who are online shoppers believe that offline shopping is more authentic and reliable than online shopping, yet they still purchase online. This is why Dipti (2019) added that regardless of the truth that the majority of participants voted for the online market, they are not entirely loyal to it because of some or all of the factors that prevent them from being utterly committed to the online market. These factors include security issues, the tangibility of the product, and that there are still trust issues with online shopping.
In-store shopping allows consumers to try and inspect the item, choose the right color and size, be able to know the origin of the product, and there is a salesperson who will guide in making the right purchase decision. People who do not have an internet connection can still purchase products by visiting stores for items since not everyone has access to the internet here in the Philippines and there are still people who have little knowledge in using gadgets. Consumers can have the product upon completion of the purchase process, and can return the product easily by going back to the store and process it at the customer service counter. Stores usually have a 7-day replacement policy, and discounts and freebies are also available during pay days or holidays.
On the other hand, there are disadvantage in-store shopping, first is that you may spend a lot of time in strolling around the store looking for what you want to buy and you are stressed since you want
25 to view everything and go to every shop
and may take your time to travel from one shop to another or from one section of department store to another. You might not remember the prices you have seen from the previous shop so you will not be able to compare, analyze and make a wise decision in purchasing a certain product.
Another disadvantage of in-store shopping is when you fit a certain product like a shirt, you need to wait for the available fitting room.
The study conducted by Muntaqheem and Raiker (2019) emphasized that with the advancement of technology, online shopping has recently grown in popularity, and people are gradually shifting to online shopping. However, they argued that the majority still prefer physical shopping since it allows them to feel and touch the product and it is deemed more credible, specifically when it comes to the mode of payment.
Furthermore, researchers have also found out that the male population prefers to shop more online rather than in person.
Kumar and Khurana (2019) and Kiran and Vishnuvandana (2019) supported the above-mentioned findings in their study wherein their participants indicated that physical or offline shopping is more favorable and satisfying. Through physical shopping, customers may directly inspect the quality and attributes of products, and experience hassle-free return policies. Also, a number of
participants do not engage in online shopping due to replicated attributes of the product, danger in using credit and debit cards for payments, risk to hackers and thefts, and problem with extra charges.
Synthesis
The Covid-19 pandemic has transformed the purchasing behavior of consumers due to physical distancing and stay-at-home orders, pushing the entire customer segment to purchase differently.
Most of the customers prefer to shop and buy online because it is easier, safe and hassle-free. Online stores make the lives of their customers easier and comfortable, however, customers are not totally loyal to online shopping because of issues in security, product quality, and product delivery. There remains a segment of the market that still prefer to visit stores for shopping where they can personally inspect products and interact with the store personnel. Research had shown that decisions on where to buy (online or offline) is affected by elements such as product, price, place (accessibility), among others. Shopping online or offline provides customers with advantages and disadvantages which can influence their shopping preferences. Understanding shopping preferences of customers can significantly help businesses to design strategies in order to thrive in a business environment that is rapidly changing.
M
ETHODOLGYResearch Design
This is a descriptive research which aimed to provide descriptions of the
preference between online and in-store shopping of the business and accountancy students of a private higher education
26 institution. It is the researchers’ intent to
gather quantitative information in order to have the said descriptions. According to Borges et al. (2017), a descriptive research aims to “give a precise depiction of observation of phenomena under study”
(p. 66), thus, a descriptive research design was deemed appropriate for this study.
Participants of the Study
The participants of the study were the 339 out of 2,214 students enrolled in the second semester of AY 2021-2022 of a private higher education institution in Iloilo City across four year levels. The sample size was determined using Slovin’s formula. In the selection of the participants, the enrolment list was used as a sampling frame with each student being assigned a specific number. The researchers then made use of an online randomizer to generate random numbers that were used to identify the participants of the study.
Data Gathering Instrument
To determine the level of preference between online shopping and in-store shopping among the participants, a validated and pilot-tested researcher- made questionnaire was utilized. The questionnaire has three parts. Part one contains items to profile the participants in terms of age, sex, degree program, and location. Part two and part three are four- point rating scales for online shopping preference and in-store shopping preference, respectively. Both have 28 identical items covering the 6Ps in marketing.
The validation of the instrument was done by three validators using the criteria of Good and Scates. After the validation
process, the instrument was tested for reliability with the following Cronbach alpha coefficients for the six subscales of product, promotion, price, place, people, and process are 0.81, 0.88, 0.82, 0.72, 0.87, and 0.79, respectively.
Data Gathering Procedure
Approval to conduct the study from the college dean was sought before the data gathering commenced with the online distribution (via e-mail or messenger) of the informed consent form and the research instrument to the selected participants. Thereafter, the responses were downloaded in google sheets and the file was checked for completeness before submission for data processing.
Ethical Considerations
This study addressed several ethical concerns. Chapters 1, 2, and 3 of the paper were subjected to plagiarism scan, specifically the Turnitin similarity check, to ensure that there was no plagiarism committed. Result of the test indicated a 1% passing percentage which is within the acceptable threshold set by the University.
Additionally, the paper was reviewed by the University's Research Ethics Committee to ensure that it respects all applicable ethical guidelines before the conduct of the study. The standard informed consent form was also utilized to secure the voluntary participation of the selected participants. Data gathered were treated with confidentiality.
Data Analysis
The data processing was done with the use of SPSS and the following statistical tests: a) frequency and percentage to profile of the participants; b)
27 mean to determine the level of preference
between online shopping and in-store shopping; c) independent samples t-test to determine if the differences in the level of preference between online shopping and in-store shopping of the participants are significant, and when they were grouped according to sex, and location; and one- way ANOVA to determine if the differences in the level of preferences when the
participants were grouped according to age and degree program.
In the analysis of the means, the scale used to describe the level of preference for online and in-store shopping of the participants is as follows: 3.26-4.00 (highly preferred); 2.51-3.25 (preferred); 1.76- 2.50 (less preferred); and 1.00-1.75 (least preferred). For the interpretation of the t- test and ANOVA results, the level of significance was set at .05
R
ESULTS ANDD
ISCUSSIONSProfile of the Participants
The results revealed that the majority (70.2%) of the participants are aged 18 to 21 years old; a little over a quarter (28.9%) were aged 22 to 25 years old, and the remaining 0.9% are 26 and above years old. Two out of five (18.6%) are male while the large majority (81.4%) are female. In terms of degree program, almost half (48.7%) of the participants come from BS
in Business Administration, followed by BS in Accountancy (32.2%), and BS in Management Accounting (15%), and the rest are distributed between BS in Advertising (2.7%), and BS in Entrepreneurship (1.5%). Lastly, nearly half (45.7%) of the participants are from Iloilo City, while the majority (54.3%) are from outside of Iloilo City.
Table 1
Profile of the Participants
Characteristics of the Participants n % Age
18 to 21 years 238 70.2
22 to 25 years 98 28.9
26 and above 3 0.9
Sex
Male 63 18.6
Female 276 81.4
Degree Program
BS in Accountancy 109 32.2
BS in Management Accounting 51 15.0
BS in Advertising 9 2.7
BS in Business Administration 165 48.7
BS in Entrepreneurship 5 1.5
Location
Within Iloilo City 155 45.7
Outside Iloilo City 184 54.3
TOTAL 339 100
28 Preference for Online Shopping and In-
Store Shopping
Online shopping is highly preferred in terms of product (M=3.32, SD=0.49), promotion (M=3.35, SD=0.53), price (M=3.42, SD=0.43), place (M=3.27, SD=0.55), and process (M=3.42, SD=0.49), and least preferred only in terms of people (M=3.19, SD=0.61). This means that business students highly desire online shopping when it comes to product, promotion, price, place, and process, but due to the high level of expectations of customers for social interactions, people in online shopping is rated lowest among the 6Ps. According to Olson (2022), customers have high expectations when it comes to customer service, thus, among the 6Ps, people has the lowest mean preference among the students.
For in-store shopping, the participants highly preferred it in terms of product (M=3.59, SD=0.45), price (M=3.31, SD=0.53), place (M=3.53, SD=0.53),
people (M=3.60, SD=0.53), and process (M=3.61, SD=0.47), but not in terms of promotion (M=3.19, SD=0.65). This implies that in-store shopping is highly desired for its product, price, place, people, and process, but not so much in terms of promotion. Many brands and sellers are struggling to have successful promotional campaigns for their product. According to the data from the Bureau of Labor Statistics (2021), approximately 20% of new businesses fail during the first two years of being open, 45% during the first five years, and 65% during the first ten years. These statistics have not changed much since the 1990s until now. One of the top six reasons why businesses fail is because of ineffective promotional strategies. They do not effectively promote their program to their clients and potential customers. They use the wrong message or marketing tools to reach their audience and the rewards or coupons and even the promotional events are not exciting enough.
Table 2
Level of Preference between Online Shopping and In-Store among Participants as a Whole 6Ps of
Preference
Online Shopping In-store Shopping
Mean SD Remarks Mean SD Remarks
Product 3.32 0.49 Highly Preferred 3.59 0.45 Highly Preferred Promotion 3.35 0.53 Highly Preferred 3.19 0.65 Preferred Price 3.42 0.43 Highly Preferred 3.31 0.53 Highly Preferred Place 3.27 0.55 Highly Preferred 3.53 0.53 Highly Preferred
People 3.19 0.61 Preferred 3.60 0.53 Highly Preferred
Process 3.42 0.49 Highly Preferred 3.61 0.47 Highly Preferred Scale: 1.00 – 1.75 Least Preferred 1.76 – 2.50 Less Preferred 2.51 – 3.25 Preferred 3.26 – 4.00 Highly Preferred
When the participants were categorized according to age, online shopping is highly preferred across age groups in terms of process but in terms of product, promotion, and price, only the
group of 26 years old and above preferred online shopping. In terms of place, only the 22 to 25 years old (M=3.38, SD=0.55) highly preferred online shopping.
Participants have a very strong desire to
29 shop online because they find products
online to be of good quality, affordable and they can easily make price comparisons to make better decisions in purchasing.
Online shopping promotions can reach them anywhere through online advertising, and monthly sales and discounts are very attractive. Transaction process is easy with a few taps of the fingers. Customers can receive the purchase in just a few days. On the other hand, they only prefer to shop online in terms of place and people because they have an ideal setting and they want to interact with the seller. In the study of Kibo (2019), 55% of millennials identified convenience as their main drive in shopping online while 51% of Gen Z identified price comparison as their main motivation to shop online.
On the contrary, in-store shopping is highly preferred across age groups in terms of product, place, people, and
process; and was only preferred in terms of promotion. This means that they have a high desire for the products sold in store.
They can fit and examine the product, have an assurance that price is reasonable, location of the store is accessible for them, and they highly desire customer service with a face-to-face interaction, and the purchase process allows them to have the product right after paying. All age groups prefer promotion, which means that they are still looking for more interesting promotion offers from in-store shopping.
According to the article of Skrovan (2017), both younger and older generations like to shop in-store for their needs or wants in life because they can try on the product and check if there is any defect just to secure that the quality is equal to its cost and also, they want to take home the product they bought right away after paying.
Table 3
Level of Preference between Online Shopping and In-store shopping when Participants are classified according to Age
6Ps of
Preference Age On-line Shopping In-Store Shopping
M SD Description M SD Description
Product 18 to 21 years 22 to 25 years 26 and above
3.31 3.37 2.67
0.49 0.48 0.42
Highly Preferred Highly Preferred
Preferred
3.58 3.61 3.27
0.46 0.40 0.31
Highly Preferred Highly Preferred Highly Preferred Promotion 18 to 21 years
22 to 25 years 26 and above
3.33 3.47 2.67
0.54 0.49 0.46
Highly Preferred Highly Preferred
Preferred
3.17 3.25 2.80
0.65 0.64 0.20
Preferred Preferred Preferred Price 18 to 21 years
22 to 25 years 26 and above
3.38 3.53 2.93
0.43 0.40 0.12
Highly Preferred Highly Preferred
Preferred
3.28 3.37 2.93
0.52 0.54 0.12
Highly Preferred Highly Preferred
Preferred Place 18 to 21 years
22 to 25 years 26 and above
3.22 3.38 3.11
0.54 0.55 0.51
Preferred Highly Preferred
Preferred
3.54 3.49 3.33
0.51 0.58 0.58
Highly Preferred Highly Preferred Highly Preferred People 18 to 21 years
22 to 25 years 26 and above
3.18 3.21 3.33
0.59 0.63 0.31
Preferred Preferred Highly Preferred
3.61 3.58 3.47
0.53 0.52 0.42
Highly Preferred Highly Preferred Highly Preferred Process 18 to 21 years
22 to 25 years 26 and above
3.40 3.48 3.33
0.48 0.51 0.31
Highly Preferred Highly Preferred Highly Preferred
3.63 3.58 3.40
0.45 0.53 0.53
Highly Preferred Highly Preferred Highly Preferred
30 When participants are classified
according to sex, their level of preference for both online and in-store shopping is presented in Table 4. The level of preference of male and female participants for online shopping in terms of the 6Ps showed consistent results. Online shopping is highly preferred by both groups in terms of product (M=3.36, 3.31), promotion (M=3.30, 3.38), price (M=3.38, 3.43), and process (M=3.43, 3.42). They also have the same level of preference for people, but in terms of place, the males (M=3.36) highly prefer online shopping while the females (M=3.25) only prefer it.
For in-store shopping, the results indicate that both the male and female group highly prefer to shop in-store when it comes to product, place, people and process. Both groups have a high desire to shop in-store where they can try and examine the product physically, they can enjoy strolling around the store while shopping, they can interact with the sales staff personally, and can take home what they bought after payment. While in terms of promotion, they only prefer in-store shopping. They find in-store shopping in
terms of promotion to be not highly preferable because of the limitations of unique promotion offers like monthly discounts. Lastly, in terms of price, male participants prefer in-store shopping while the females highly prefer in-store shopping. Generally, in-store shopping offers cheaper women's clothing, accessories, and other items compared to men’s items.
According to Maynard (2021), 88% of male and female choose to shop in-store as they can try out the product and take it home after payment. Also, in-store shopping can make a person feel better.
Tan (2021) found out in her study that 62%
of shoppers purchased something that brightened up their day and 28%
purchased for a celebration such as birthday and graduation as they can have time to unwind together with their loved ones while shopping in-store. According to Skrovan (2017), 70% of the consumers would rather speak to a human customer service representative than chatbots. This can be one of the reasons why the participants do not highly prefer online shopping in terms of people.
Table 4
Level of Preference between Online Shopping and In-store shopping among Participants when classified according to Sex
6Ps of
Preference Sex
Online Shopping In-store Shopping
M SD Description M SD Description
Product Male Female
3.36 3.31
0.48 0.49
Highly Preferred Highly Preferred
3.58 3.59
0.47 0.44
Highly Preferred Highly Preferred Promotion Male
Female
3.30 3.38
0.58 0.52
Highly Preferred Highly Preferred
3.13 3.21
0.68 0.64
Preferred Preferred
Price Male
Female
3.38 3.43
0.45 0.43
Highly Preferred Highly Preferred
3.24 3.32
0.50 0.53
Preferred Highly Preferred
Place Male
Female
3.36 3.25
0.52 0.55
Highly Preferred Preferred
3.43 3.55
0.59 0.52
Highly Preferred Highly Preferred
People Male
Female
3.09 3.21
0.70 0.58
Preferred Preferred
3.54 3.61
0.54 0.52
Highly Preferred Highly Preferred Process Male
Female
3.43 3.42
0.48 0.49
Highly Preferred Highly Preferred
3.57 3.62
0.45 0.48
Highly Preferred Highly Preferred Scale: 1.00 – 1.75 Least Preferred 1.76 – 2.50 Less Preferred 2.51 – 3.25 Preferred 3.26 – 4.00 Highly Preferred
31 Table 5 shows the level of preference
between online shopping and in-store shopping when participants are grouped by degree program. Results revealed that the BS in Management Accounting and BS in Business Administration students highly preferred online shopping in terms of all the 6Ps of preference. Meanwhile, BS in Accountancy students highly preferred the product, promotion, price, and process, but their level of preference for place and people is only preferred. For BS in Advertising students, online shopping in terms of product, promotion, and process
is highly preferred but in terms of price, place, and people their level of preference is only preferred. According to Baluch (2022), because of the new and growing technology, online shopping product, price, and process have become incredibly easy and convenient. Instead of speaking to just one or two sales associates in person, you can peruse product descriptions, recommendations of similar products, and reviews from other shoppers online that may help you make a more informed purchasing decision.
Table 5
Level of Preference between Online Shopping and In-store shopping among Participants when classified according to Degree Program
6Ps of
Preference Degree Program
Online Shopping In-store Shopping
M SD Description M SD Description
Product Accountancy
Management Accounting Advertising
Business Administration Entrepreneurship
3.30 3.28 3.42 3.34 3.16
0.45 0.62 0.63 0.48 0.43
Highly Preferred Highly Preferred Highly Preferred Highly Preferred
Preferred
3.59 3.52 3.69 3.60 3.80
0.40 0.48 0.43 0.47 0.28
Highly Preferred Highly Preferred Highly Preferred Highly Preferred Highly Preferred Promotion Accountancy
Management Accounting Advertising
Business Administration Entrepreneurship
3.35 3.39 3.38 3.37 3.00
0.52 0.55 0.52 0.54 0.42
Highly Preferred Highly Preferred Highly Preferred Highly Preferred
Preferred
3.13 3.10 3.18 3.25 3.52
0.69 0.61 0.49 0.63 0.67
Preferred Preferred Preferred Preferred Highly Preferred Price Accountancy
Management Accounting Advertising
Business Administration Entrepreneurship
3.42 3.48 3.24 3.42 3.08
0.42 0.46 0.45 0.42 0.50
Highly Preferred Highly Preferred
Preferred Highly Preferred
Preferred
3.24 3.30 3.20 3.26 3.32
0.54 0.63 0.53 0.49 0.44
Preferred Highly Preferred
Preferred Highly Preferred Highly Preferred Place Accountancy
Management Accounting Advertising
Business Administration Entrepreneurship
3.17 3.33 3.11 3.32 3.33
0.51 0.55 0.69 0.55 0.78
Preferred Highly Preferred
Preferred Highly Preferred Highly Preferred
3.50 3.49 3.70 3.53 3.80
0.54 0.59 0.39 0.51 0.45
Highly Preferred Highly Preferred Highly Preferred Highly Preferred Highly Preferred People Accountancy
Management Accounting Advertising
Business Administration Entrepreneurship
3.04 3.29 2.96 3.26 3.44
0.62 0.63 0.48 0.58 0.39
Preferred Highly Preferred
Preferred Highly Preferred Highly Preferred
3.61 3.56 3.62 3.60 3.80
0.56 0.51 0.54 0.52 0.28
Highly Preferred Highly Preferred Highly Preferred Highly Preferred Highly Preferred Process Accountancy
Management Accounting Advertising
Business Administration Entrepreneurship
3.37 3.46 3.42 3.45 3.40
0.49 0.50 0.51 0.48 0.20
Highly Preferred Highly Preferred Highly Preferred Highly Preferred Highly Preferred
3.57 3.60 3.73 3.63 3.80
0.49 0.52 0.36 0.46 0.28
Highly Preferred Highly Preferred Highly Preferred Highly Preferred Highly Preferred Scale: 1.00 – 1.75 Least Preferred 1.76 – 2.50 Less Preferred 2.51 – 3.25 Preferred 3.26 – 4.00 Highly Preferred
32 The BS in Accountancy, BS in
Management Accounting, BS in Advertising, BS in Business Administration students, highly preferred in-store shopping in terms of product, place, people and process; while the BS in Management Accounting and BS in Business Administration students highly prefer this shopping mode in terms of price, but the BS in Accountancy and BS in Advertising students only prefer to shop in-store in terms of price. Lastly, the BS in Entrepreneurship highly prefer the 6Ps of in-store shopping according to Berthiaume (2021), 33% of participants prefer to shop in-store since they like to view and touch the product, while 26% enjoy the overall shopping experience that a physical location provides as they can enjoy the ambiance while strolling around the store, and 13% like the immediacy that in-store shopping provides because they can take home the product right after they paid it.
When classified according to location, participants within and outside Iloilo City highly preferred online shopping in terms of product, promotion, price, and process;
and only preferred it in terms of people.
Meanwhile, in terms of place, participants outside Iloilo City highly preferred online shopping (M=3.30, SD=0.54), but not participants from within Iloilo City (M=3.23, SD=0.56). The results suggest that students from both within and outside of
Iloilo City highly desired online shopping in terms of product, promotion, price, and process. This mode of shopping not only offers a diverse range of products, but also provides attractive bargains and discounts.
Students in both locations can quickly compare prices and select the finest offer that matches their budget. The check-out process is also significantly faster because customers can easily purchase an item with only one click. These features of online shopping are particularly attractive to those who are residing outside Iloilo City. However, those who live in Iloilo City viewed the place preference not as strongly as compared to the other Ps.
Those who are living in Iloilo City can readily access physical stores in just a few rides, hence, it explains why they do not highly prefer online shopping in terms of place. Meanwhile, difficulties such as significant driving hours and lack of physical outlets that sell their sought-after products pushed students from outside Iloilo City to shop online instead. Lastly, as for people, students from both locations desire online shopping but not that high.
Despite the fact that online shopping is greatly favored because of its speed and convenience, their customer service performance such as slow seller response time and the absence of interactivity hinders from being highly desired in terms of people.
33 Table 6
Level of Preference between Online Shopping and In-store shopping among Participants when classified according to Location
6Ps of
Preference Location Online Shopping In-store Shopping
M SD Description M SD Description
Product Within Iloilo City Outside Iloilo City
3.28 3.35
0.52 0.48
Highly Preferred Highly Preferred
3.59 3.59
0.43 0.46
Highly Preferred Highly Preferred Promotion Within Iloilo City
Outside Iloilo City
3.36 3.37
0.50 0.56
Highly Preferred Highly Preferred
3.24 3.15
0.59 0.69
Preferred Preferred Price Within Iloilo City
Outside Iloilo City
3.37 3.46
0.45 0.40
Highly Preferred Highly Preferred
3.32 3.30
0.53 0.53
Highly Preferred Highly Preferred Place Within Iloilo City
Outside Iloilo City
3.23 3.30
0.56 0.54
Preferred Highly Preferred
3.54 3.52
0.53 0.54
Highly Preferred Highly Preferred People Within Iloilo City
Outside Iloilo City
3.22 3.16
0.60 0.61
Preferred Preferred
3.58 3.62
0.54 0.52
Highly Preferred Highly Preferred Process Within Iloilo City
Outside Iloilo City
3.39 3.45
0.51 0.47
Highly Preferred Highly Preferred
3.62 3.61
0.47 0.48
Highly Preferred Highly Preferred Scale: 1.00 – 1.75 Least Preferred 1.76 – 2.50 Less Preferred 2.51 – 3.25 Preferred 3.26 – 4.00 Highly Preferred
Based on the study of Kumar (2020), customers from rural and semi-urban areas prefer online stores than physical ones for a variety of reasons. The fact that it is time-saving, is the most important consideration, followed by the ease and flexibility when purchasing online. The discounts offered and the large selection of products are other important considerations that drive them as well.
Furthermore, Deshmukh and Chourasia (2020) found that one of the problems in making online purchases was the lack of personalized services, which was ranked second by rural customers and fourth by urban customers. Hence, it is critical to consistently satisfy consumers by delivering high-quality services and products at an affordable cost (Mascarenhas, 2018).
For in-store shopping, participants from both groups highly preferred it in terms of product, price, place, people, and process; and they only preferred it in terms of promotion. Based on the findings, participants from both locations have a high desire to shop in-store for product, price, place, people, and process, but they
only desire in-store shopping in terms of promotion. When given the option, 48% of people prefer to purchase in person at a physical store, according to a Raydiant study. So far in 2021, 47% of participants say they have spent more than 51% of their purchasing at physical locations.
Individuals who prefer in-person shopping love the experience, according to Raydiant's State of the In-Store Experience Report.
Differences in the Level of Preference between Online Shopping and In-store Shopping when Participants are grouped according to Age, Sex, Degree Program, and Location
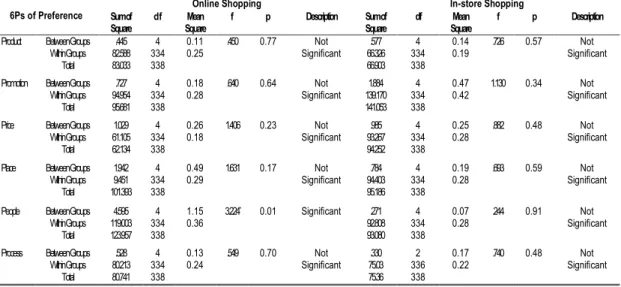
Based on age, the level of preference between online shopping and in-store shopping in respect to 6Ps of preference, are presented on Table 7. The findings showed that there are significant differences in the level of preference for online shopping in terms of product [F(2,336)=3.23, p=0.04], promotion [F(2,336)=4.92, p=0.01], price [F(2,336)=6.40, p=0.00], and place [F(2,336)=3.14, p=0.05] when participants
34 are grouped according to age. In contrast,
no significant difference exists between groups in terms of people [F(2,336)=0.22, p=0.80] and process [F(2,336)=0.89, p=0.04]. Hence, the hypothesis that there are no significant differences in the level of preference for online shopping when participants are classified according to age is not accepted in terms of product, promotion, price, and place but accepted in terms of people and process.
For in-store shopping, no significant differences existed between the means of the group in terms of product [F(2,336)
=0.93, p=0.39], promotion [F(2,336) =1.01, p=0.37], price [F(2,336) =1.74, p=0.18], place [F(2,336) =0.55, p=0.58], people [F(2,336)=0.25, p=0.78], and process [F(2,336)=0.74, p=0.48], thus, the null hypothesis is accepted. This shows that regardless of age, the level of preference for in-store shopping is the same.
The results for online shopping preference are consistent with the findings of Kibo (2019), in which they analyzed two generations of online shoppers. The shoppers were classified as Generation Z and Millennials, with ages ranging from 18 to 25 and 26 to 40, respectively. Quality and greater product variety are important factors when purchasing online for both age groups, but more so for Gen Z. The attributes that characterize Generation Z
include being practical and cautious. They are not easily convinced by marketing tactics unless family, friends, and social media influencers can vouch for the product's validity. Moreover, they are tech- savvy enough to evaluate whether or not that product provides the quality that GenZs seek (Institute for Business Value, 2018). Furthermore, results of the study between two generations emphasized that product discounts, one of the components that encourages shopper loyalty, obtained a larger proportion for Gen Z with 34.2%
against Millennials with only 27.9%. Price was also recognized by 51% of Gen Z as the most valuable online shopping benefit.
When making online purchases, coupons and product discounts are motivating elements for Gen Zs (Global Web Index, 2020). Although quality is one of the factors that persuade Gen Zs to purchase products online, they would also purchase things that are defined as “inexpensive” or
“cheap.” One of the most evident reasons why Gen Z is more likely to be attracted in purchasing things that are inexpensive or cheaper is that they are less financially stable than Millennials. However, that does not imply that they do not want expensive- looking or high-quality products. As a matter of fact, they are more likely than Millennials to say they prefer "excellent quality" items (YPulse, 2022).