Accepted and approved in partial fulfillment of the requirements for the degree of Bachelor of Science in Computer Science. 1 Graph of incidence and mortality rates of the five major cancer types worldwide in 2008 (GLOBOCAN). 17 4 The lung cancer survival prediction tool as seen on an iPhone 18 5 A screenshot of the PREDICT tool form.
49 Results buffer of the subset dataset random forest model for predicting four-year breast cancer survival.
Background of the Study
As mentioned above, patient medical records are an important source of information in this area, as they help health care providers to correlate current and previous occurrences of disease. Past studies have demonstrated its potential using medical records, with common examples being the diagnosis and prediction of disease recurrence using models generated from medical records. The study developed two sets of lung cancer predictive models—the first using more than 60 variables selected from preprocessing, and the second a smaller subset of just 13 variables determined by their predictive ability in the context of the dataset.
Both systems demonstrated the use of data mining in predictive medicine using historical medical records.
Statement of the Problem
An example is a table of breast cancer survival rates based on cancer stage, as seen in Tables 1 and 2 [4,7]; and/or. A 2009 study comparing the cancer survival of Filipinos (using data from PCS-MCR and DOH-RCR) with Filipino-Americans and Americans (SEER data) revealed that the survival rates of Filipinos are inferior to those of the other two . A lung cancer survival study was able to develop an online calculator that uses clinical data as input and survival rate as output [3].
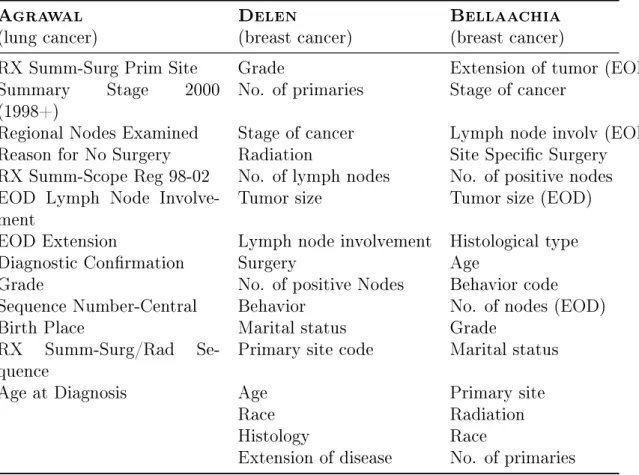
A study by Agrawal et al. provides a design framework for a prediction calculator for other cancers, and their method takes advantage of algorithms (or "classifiers") to find associations between patient medical records and survival outcomes.
Objectives of the Study
Significance of the Study
In the case of involved physicians and health care providers, they have the ability to modify the patient's current medication regimen based on predicted survival. These were individually collected from local registry offices and families of the person in the record [8]. Another study of the relationship between breast cancer incidence and geographic location in the United States resulted in no observable significance linking the two.
The length of sun exposure and the amount of synthesized vitamin D were also noted in the research [11].
Scope and Limitations
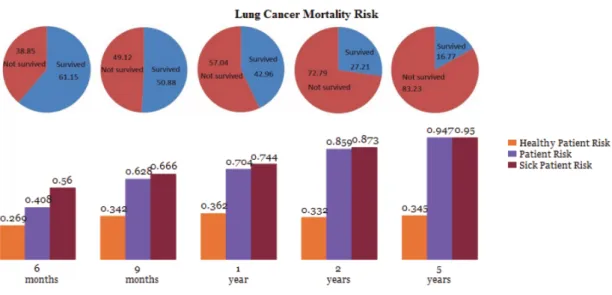
The variables used in modeling predictive survival depend on the output of the preprocessing phase. These correspond to the probability that a record has a class distribution of “1” or “alive”. i) The recorded data modeling results include only: “performance metrics” (e.g. accuracy, precision, etc.) per cross-validation run, a list of. the time executions of the program, and a general summary of the modeling similar to the “result buffer” of WEKA GUI. The first only records cross-validation runs, meaning that only ten performance metrics were obtained per data modeling. a) The input fields of the BOSOM calculator are directly dependent on the results of the attribute selection.
Only PDF files containing the provided data and results will be generated once the user clicks the “Save as PDF” or similar button. e) The application does not correct inconsistent data between the input variables.
Assumptions
Review of Related Literature 15
SEER data from 1973 to 2000 were preprocessed by modifying and removing data and variables based on the following criteria: if the survival time of a record did not exceed sixty months after diagnosis and was not fully updated during the same duration is then removed; variables unrelated to breast cancer were removed; 202,932 records and 17 variables were the result of complete preprocessing and these were used in the creation of three predictive models. Regarding the work of Delen et al., the accuracy discrepancy between the two searches was caused by the different SEER datasets, preprocessing methods, and data mining tools used [16].
To test the predictive accuracy of the model, they used 5,468 records from the West Midlands Cancer Intelligence Unit (WMCIU) breast cancer data set from the same time period.

Knowledge discovery in databases (KDD)
This could meet the requirements of software that will be used during the data mining process. Customer behavior is an indispensable feature of large companies such as supermarkets and social networking sites; data mining offers opportunities to improve profit and revenue strategies by finding correlations between customers and the products and services offered. Data mining of medical records will help define rules and patterns about how a patient's clinical data relates to his or her survival.
Interpreting and drawing conclusions from data mining results involves an analysis step.
Predictive modeling
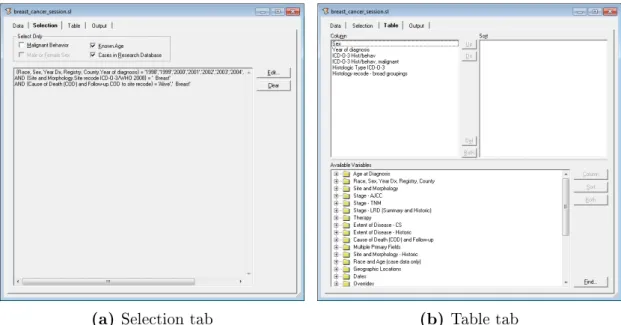
In general, the formula for profit measure is the difference between the information of the data set's cases and nodes or𝑔𝑎𝑖𝑛(𝑥) = 𝑖𝑛𝑓 𝑜(𝑇)−𝑖𝑛𝑓 𝑜𝑇). At the end of the next iterations, the misclassified classifiers are updated (most of the time increased) to be more prominent, thus leaning towards a better classification in the next [ 34 , 35 ]. To create the BOSOM Calculator, a selection of the top variables in the breast cancer dataset must first be done to reduce the number of variables to be analyzed.
To validate the predictive results of the classifiers and models, performance evaluation methods will be used for quantitative measurement.
Surveillance, Epidemiology, and End Results Program (SEER) . 36
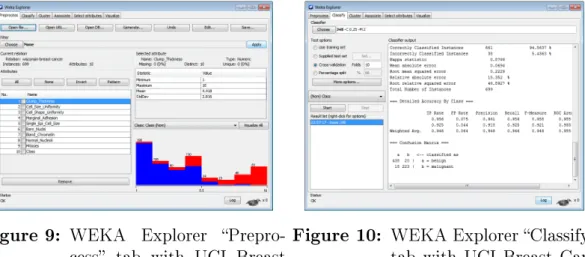
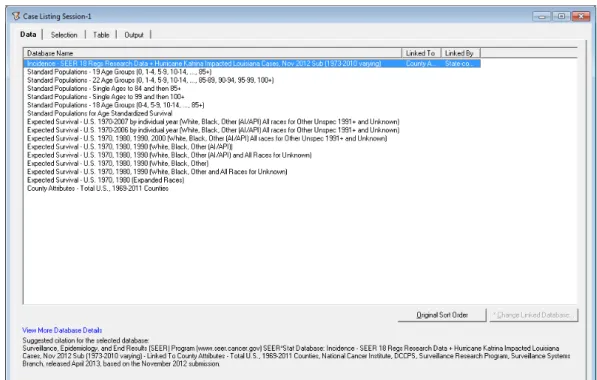
The “Data” tab selects the database, and as noted in the “SEER-18 Data” the study used the program's default recommendation. Finally, the result of the “Case Listing Session” is a “matrix,” as it is called in the system. To use the “Explorer” function, the data must first be loaded into the “Preprocessing” tab.
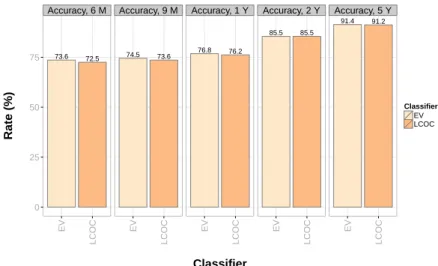
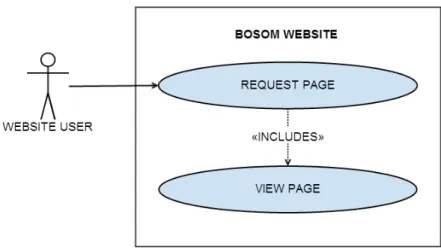
Accuracy, mean absolute error and root mean square error are some of the measures in the first part.
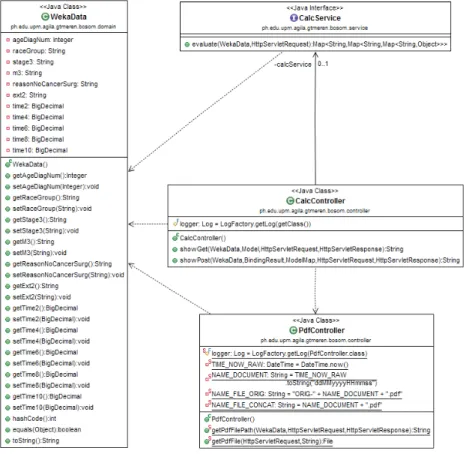
Model-View-Contoller framework
Design and Implementation 47
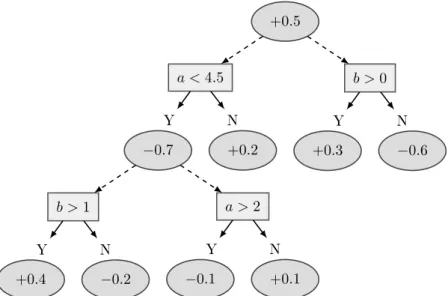
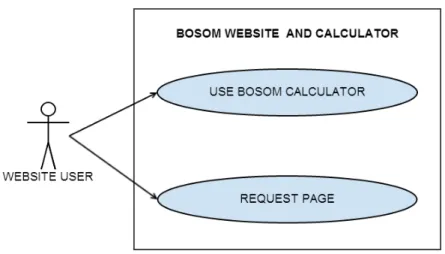
The corresponding web page context diagrams and the BOSOM Calculator are given in Figures 11 and 12. Users can visit static pages (or those pages where minimal interaction is required, such as the home page) and use the BOSOM Calculator to obtain the survival of their predicted. Input data to the BOSOM Calculator will only be persistent from submission until the result PDF file is created or until a user leaves the page.
The data is first sent to the main controller, which is responsible for calling the following processes: "BOSOM Calculator Service" is where the models calculate the prediction; next is the PDF generator to add the calculated predictions to the document; and finally the view is where the user interface of the results page is assembled.
Implementation
Pre-filtering was specified in the "Selection" tab; works by marking form checkboxes and entering filter commands into the intended form. This step was also implemented in LCOC to recognize the difference between value roles and possible predictive ability [3]. Source code 3 shows the function that determines the inclusion of these variables in the final data set.
The number of surviving data sets, complete at 83.93% and reliable at 87.34%, both dominated the composition in terms of vital status. In the data set, the emphasis on eight- and ten-year data caused additional population growth in the lower years. A custom program was developed with the WEKA API to suit study needs that were not implemented in the GUI version.
These are listed in the filter code block with their index number in the data. The cross-validation is run ten times to increase the representation of the entries in the ten-fold setting during classifier training. As indicated in the flowchart, the products of this part are: (1) a CSV of all classifiers' ten runs of cross-validation, (2) a text file containing the time taken for training to complete and (3) the WEKA model files.
Both the complete data set and the subset have these files generated for evaluation and use in the calculator (specifically the subgroup models). Between the training of full set and subset datasets, WEKA's attribute selection was used to identify the attributes that will be included in the subset.
Class diagrams
These are averaged (the ensemble voting technique) and set to the corresponding fields of the WekaData object. Again, the inferior representation of the later years in the data set is one of the. All visitors of the BOSOM application are also allowed to use the BOSOM Calculator.
This demonstrates the usefulness of the BOSOM calculator in the context of its variables and their predictions. Source Code 43: Results Buffer of a Subset Alternating Decision Tree Model for Predicting Two-Year Breast Cancer Survival. Source Code 44: Results Buffer of a Subset Dataset Alternating Decision Tree Model for Predicting Four-Year Breast Cancer Survival.
Source Code 45: Results Buffer of a Subset Alternating Decision Tree Model for Predicting Six-Year Breast Cancer Survival. Source Code 46: Results Buffer of a Subset Alternating Decision Tree Model for Predicting Eight-Year Breast Cancer Survival. Source Code 47: Results Buffer of a Subset Decision Tree Model for Predicting Ten-Year Breast Cancer Survival.
Source code 48: Random forest model results buffer of subset data for predicting two-year breast cancer survival. Source code 49: Random forest model score buffer of subset data for predicting breast cancer four-year survival. Source code 50: Random forest model output buffer of subset data for predicting six-year breast cancer survival.
Source code 51: Result buffer of the random forest model of the subset dataset for predicting eight-year breast cancer survival. Source code 52: Result buffer of the random forest model of the subset dataset for predicting 10-year survival of breast cancer.