INTRODUCTION
Background and Motivation
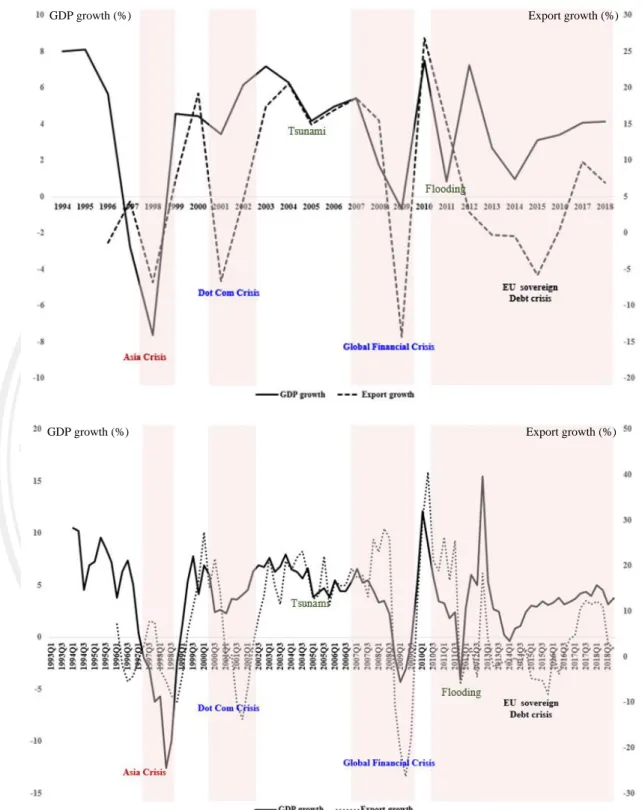
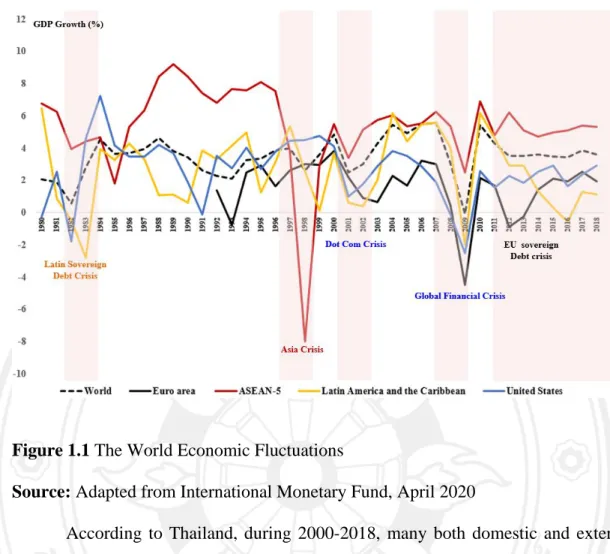
The crisis started in the United States from a stock market bubble and then spread to many countries around the world. According to Thailand, both domestic and external factors caused fluctuations in the Thai economy over many years.
Research Objectives
PLS-SEM is ideally suited for this task because it can construct CLIs via a measurement model, and evaluate the relationship between those CLIs from a structural model. Predicting the EC based on the connections of CLIs by PLS-SEM is brand new: as far as I know, no one in the field of EWS has used this method before.
Scope of the Study
Expected Benefits
Organization of the Dissertation
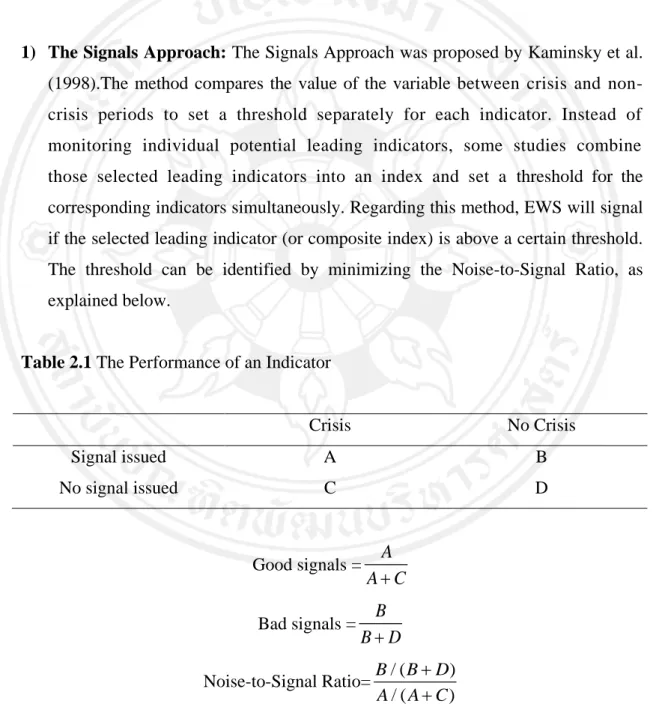
1998). The method compares the value of the variable between crisis and non-crisis periods to set a threshold separately for each indicator. They say that "a parsimonious approach to the theoretical specification is far more powerful than the broad application of a shotgun meaning." The structural model has a relationship like the following.
LITERATURE REVIEW
Early Warning System and Related Concepts
Relationship between Economic Sectors and their Proxies
Most of them are built from potential leading indicators to give the prediction of the economic crisis. Starting with the classic cycle or trend cycle is the fluctuation of the level of economic activities (Burns & Mitchell, 1946).
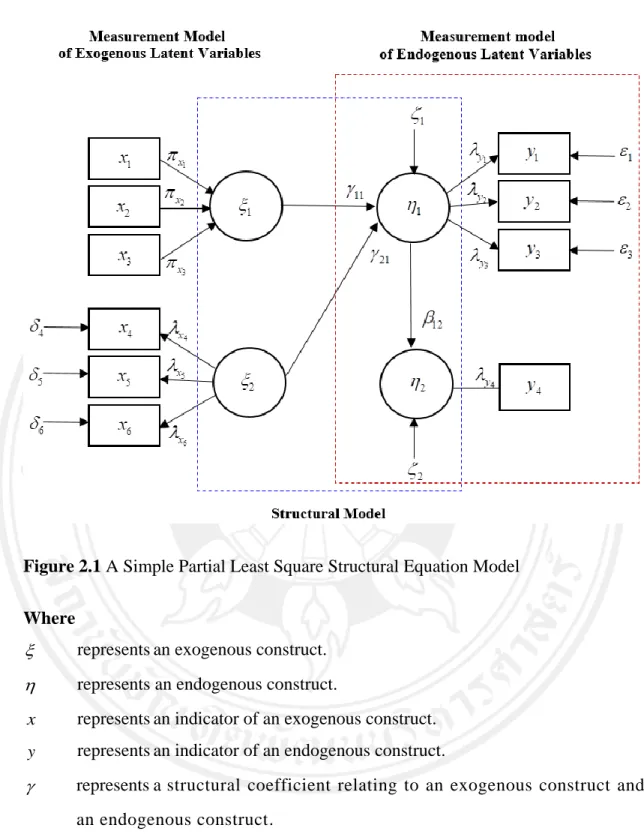
Partial Least Square Structural Equation Model (PLS-SEM)
- Measurement Model
- Structural Model
- Measurement Model Evaluation
- Structural Model Evaluation
Based on the literature review, the research identifies the benchmark indicator and CLI of the Thai economy. The research estimates a structural model that aims to assess the significance of the relationship between CLI and the ability of EWS to predict EC. It provides PLS-SEM results and a comparison of prediction performance between EWS with PLS-SEM and comparative models as the following topics.
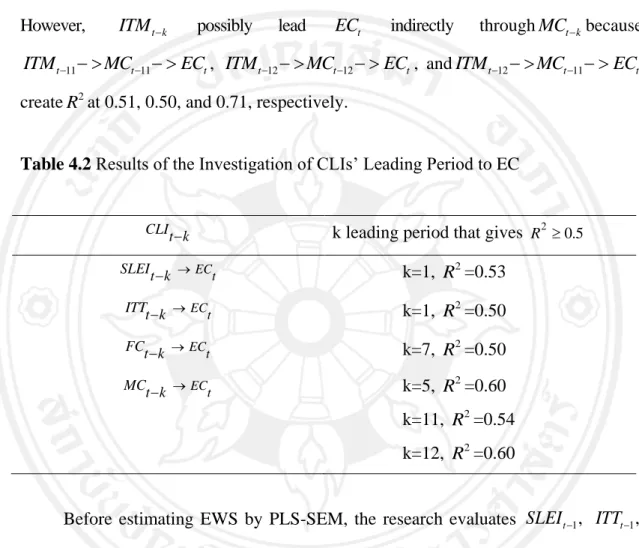
Note: R2 values are in circles and path weights/coefficients are in lines EWS Score: PLS-SEM score score. The research evaluates the ability of EWS from a structural model: prediction performance and significance of relationships between CLIs for EC prediction. Coefficient of determination (R2): R2 is a statistical value to assess the predictive power of a structural model.
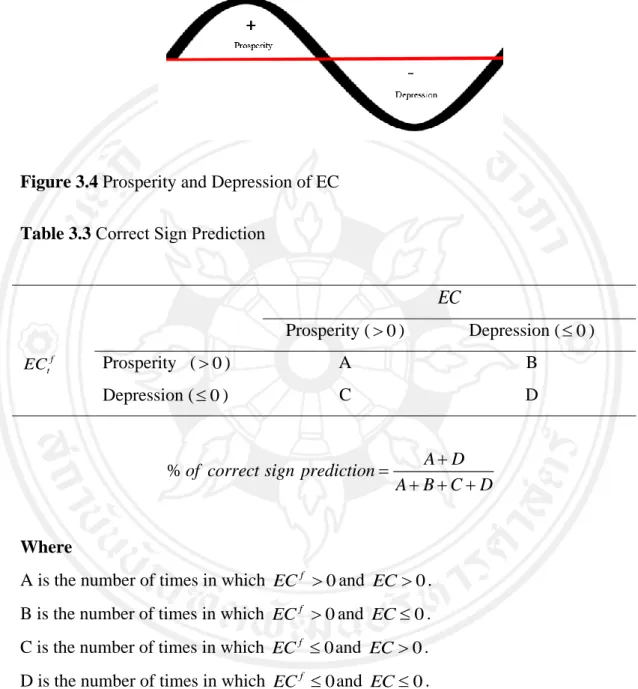
The research compares the forecasting performance of the EWS by PLS-SEM with the ARIMA model, which is a popular forecasting model, especially for short-term forecasting, by considering RMSE and the correct sign forecast. SLEI is the CLI that aims to give advance notice of the fluctuations of EC in the short term. The evidence from the results of the research shows that EWS by PLS-SEM outperforms the individual CLI for both the leading period and the prediction of performance.
RESEARCH METHOD
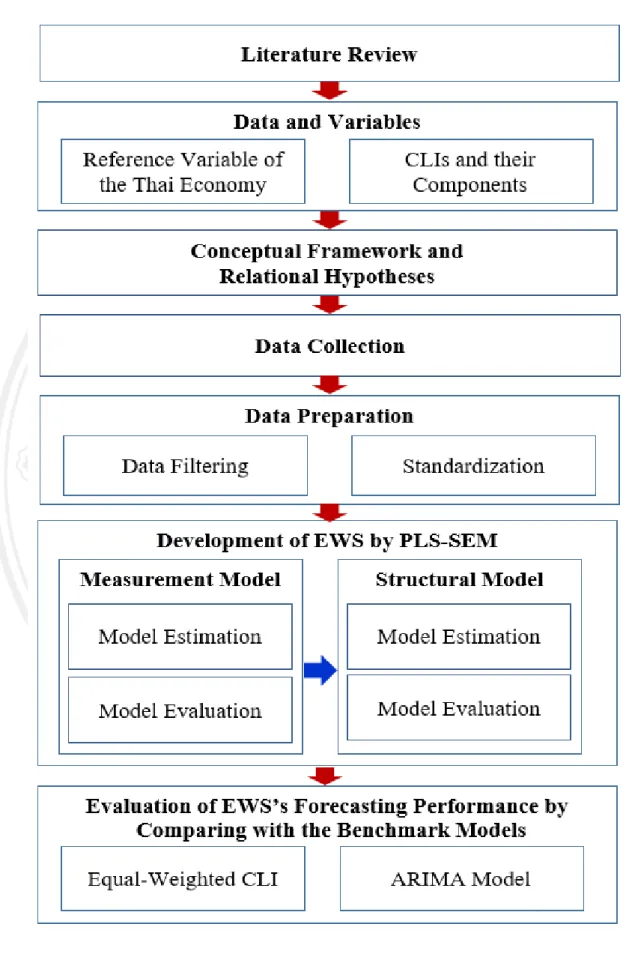
Research Methodology Framework
- Short-Term CLI
- Medium-Term CLI
- Long-Term CLI
The research aims to identify CLIs and develop EWS to predict EC in the short, medium and long term periods. To pursue the objectives, the research first reviews the literature regarding the CLIs that tend to lead EC and also the relationship between them to anchor the conceptual model. Consequently, the research estimates the relationship between these CLIs and prognosis of EC by PLS-SEM.
Finally, to ensure that the EWS by PLS-SEM is outstanding for predicting EC, the analysis compares the prediction performance between EWS by PLS-SEM and the benchmark models.
Conceptual Framework and Hypotheses
Data and Data Sources
Data Preparation
EWS by PLS-SEM
- Specification of the Measurement model
- Evaluation of the Measurement Model
- Specification of the Structural Model
- Evaluation of the Structural Model
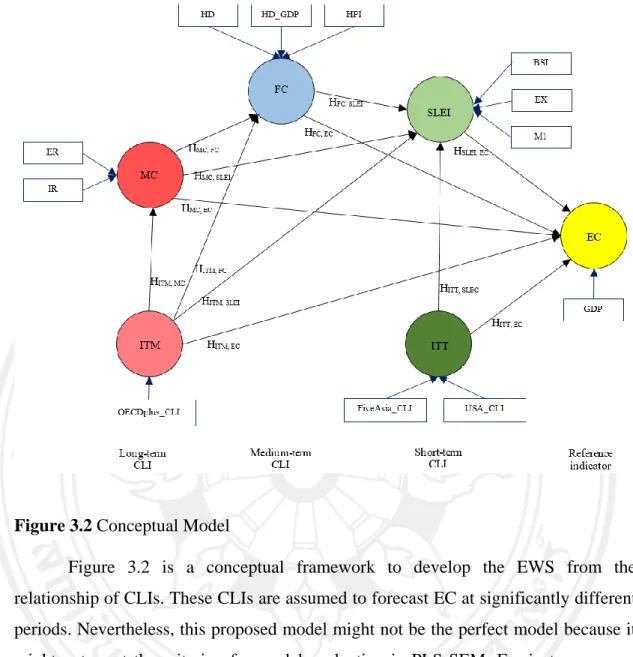
Financial Cycle (FC): FC aims to capture the instability of the financial sector (Grinderslev et al., 2017). After Freedman (1996); Memon and Jabeen (2018), the research constructs MC from the combination of the policy interest rate (IR) and the real effective exchange rate (ER). 2) International transmission via the International Monetary Policy Channel (ITM): ITM is the proxy for the effect from the global economy that transmits to Thailand via international monetary policy. The increase in financial instability will have a significant negative impact on EC with direct and/or indirect effects in the next 4-8 quarters. Hypothesis3 ITTEC (+): ITT is a short-term CLI which is pro- EC's cyclical behavior.
ITM International Transmission via the International Monetary Policy Channel is the proxy for the effect from the global economy that transmits to Thailand by the international monetary sector. The research assesses the quality of these CLIs to ensure that they can capture the domain of the significant construct. When considering the timing sequence of constructions, the long-term CLIs (ITM and MC) will happen first, so they should be on the left side of the structural model.
The research considers the collinearity between constructs, the statistical significance and relevance of the path coefficients, the coefficient of determination (R2) and the effect size (f2).
Evaluation of Forecasting Performance of EWS by PLS-SEM
- Construction of Equal-Weighted CLI
- Comparison of Forecasting Performance between EWS by PLS-
- Construction of the ARIMA model
- Comparison of Forecasting Performance between EWS by PLS-
The study also compares the forecasting performance of EWSs from PLS-SEM with the Autoregressive Integrated Moving Average (ARIMA) models. The research compares the forecasting performance of EWSs from PLS-SEM with the ARIMA models by considering the RMSE and the correct sign prediction. Regarding the EWS of PLS-SEM from Figure 4.7, the research evaluates PLS-SEM output, both the formative measurement models and the structural model (estimated from 64-11=53 observations).
EWS by PLS-SEM is estimated to predict EC in the short term (one quarter ahead) by EWS1, in the medium term (seven quarters ahead) by EWS7, and in the long term (eleven quarters ahead) by EWS11, as Figure 4.8. The study identifies CLIs and develops EWS by PLS-SEM to estimate the relationship between those CLIs to predict Thailand's EC. Second, the study compares the prediction performance of EWS by PLS-SEM with ARIMA model, a popular prediction model, especially for short-term forecasting, by considering RMSE and appropriate sign prediction.
The findings show that the ability of EWS by PLS-SEM to predict EC is remarkable.
RESEARCH RESULTS
Identification of Cyclical Pattern for Indicators
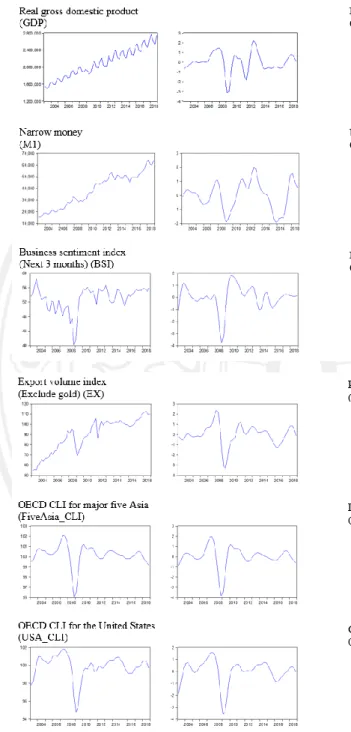
The research uses Real Gross Domestic Product (GDP) as a proxy for the Thai economy, which is the target variable that EWS aims to early signal or predict. The indicators from different economic sectors are aggregated to construct CLIs based on the literature review, to represent the real sector, the financial sector, the monetary sector and the global sector. According to the proposed model in Figure 3.2 of Chapter 3, the analysis requires at least 50 observations to meet the sample requirement for PLS-SEM: the 10-time rules of Barclay et al.
Following the OECD CLI procedure, the study first filters out the unnecessary components for all indicators to keep only the cyclical pattern of X12 and Double Hodrick-Prescott, and then standardizes them.
Development of EWS by PLS-SEM
- Assessment of the CLIs in EWS: Evaluation of the Formative
- Assessment of the Relationship between CLIs: Evaluation of the
Comparison of Forecasting Performance between EWS by PLS-SEM and the
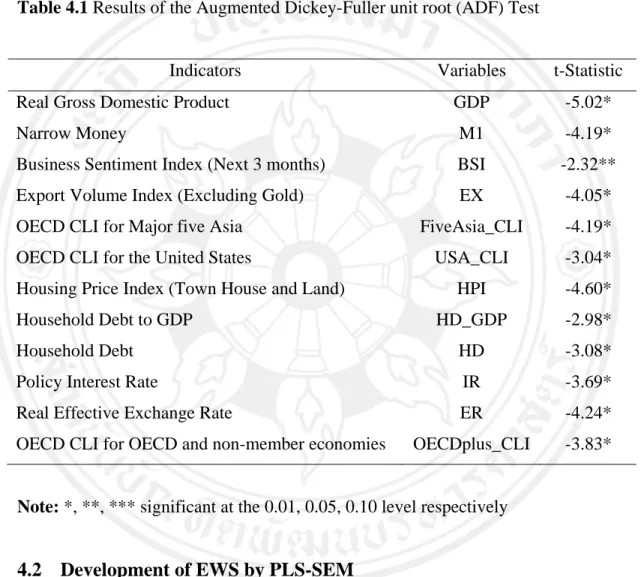
Additionally, the Augmented Dickey-Fuller Unit Root (ADF) test results confirm that these filtered data do not have a unit root that would cause a spurious relationship in PLS-SEM analysis based on Ordinary Least Square (OLS) estimation (Table 4.1). The research first assesses convergent validity to confirm that each CLI can capture the entire construct domain through redundancy analysis. The research ensures that these CLIs can accelerate the EC signal by evaluating convergent validity, indicator collinearity in the CLI, and statistical significance and relevance of formative indicators.
According to Table 4.7, most of the indicators are significant, which means that they are relatively important for the construct. Thus, the analysis takes into account the coefficient of determination ( ) R2 , the size of the effect (f2), the collinearity between the constructs and the statistical significance and relevance of the path coefficients. The survey consists of Narrow money (M1), Business Sentiment Index (next three months) (BSI) and Export Volume Index (excluding gold) (EX), which are parts of the Short Leading Economic components used by the Bank of Thailand. (n.d.).
The research constructs MC from the combination of the policy interest rate (IR) and the effective real exchange rate (ER) following Freedman (1996); (Memon. & Jabeen, 2018). The evidence from the out-of-sample forecasting accuracy is clear that the EWSs from PLS-SEM outperform the benchmark models for all short-term, medium-term and long-term periods. Using financial indicators to predict turning points in the business cycle: The case of the leading economic index for the United States.
CONCLUSIONS, DISCUSSIONS, AND RECOMMENDATIONS
Conclusions
PLS-SEM is suitable for this task because it can construct CLIs through a measurement model, and evaluate the relationship between those CLIs from a structural model. Moreover, it can estimate a complex model with all data distribution and with a small sample size. First, the research applies real gross domestic product as the proxy of the Thai economy, which is the target variable that EWSs want to indicate early.
Indicators from various economic sectors are collected to produce the CLI, representing the real sector, the financial sector, the monetary sector and the global sector. Before starting the estimation process, unnecessary components such as seasonality and trend factors are filtered out of the data so that the data will contain only cyclical patterns. The research constructs the CLI from formative measurement models: short-term economic index (SLEI), financial cycle (FC), monetary position (MC) and international transmission through channels of trade (ITT), while the research determines international transmission through the International Monetary Policy Channel (ITM) as a single-item construct.
Short-term CLIs include SLEI and ITT, while FC is the medium-term CLI, and long-term CLIs consist of MC and ITM.
Discussions
Recommendations
The research considers using the economies of the United States and the Big Five ASIA countries (namely China, India, Indonesia, Japan and Korea) as components of ITT because they are the most important partners for Thai exports. With regard to FC, which aims to capture financial sector instability (Grinderslev et al., 2017), the research constructs FC based on housing price index (townhouse and land) (HPI), household debt to GDP (HD_GDP) and household debt. (HD) Borio et al. Finally, ITM is the proxy for the international effect on Thailand of the international monetary policy channel.
While the finding of Sethapramote (2015) supports the positive relationship between ITT and EC, Thailand is one of the countries that has significant income from exports; therefore, the economic fluctuations of Thailand's major export partner countries may affect its economy. The other outstanding feature of EWS by PLS-SEM is that it can explain the relationship between economic sectors to EC. EWS through PLS-SEM can show EC the relationship between economic sectors which are the monetary sector, the financial sector and the global sector.
Therefore, I recommend that the government and the public sector apply EWS from PLS-SEM to help them make their strategic planning for short, medium and long term plans.