I would also like to express my appreciation to Ajarn Vasan Siraprapasiri for providing valuable knowledge, which effectively contributed largely to the completion of my thematic paper. I would like to thank my friends and classmates for their kind advice, cooperation and friendship.
LIST OF ABBREVIATIONS
LIST OF ABBREVIATIONS (cont.)
VALUATION
Highlights
We also expect the company to continuously deliver profits to its shareholders by investing in expanding its own products and seeking new trading partners. The company will invest at least 80 million in its warehouse, factory and machinery to increase the competitiveness of private label products.
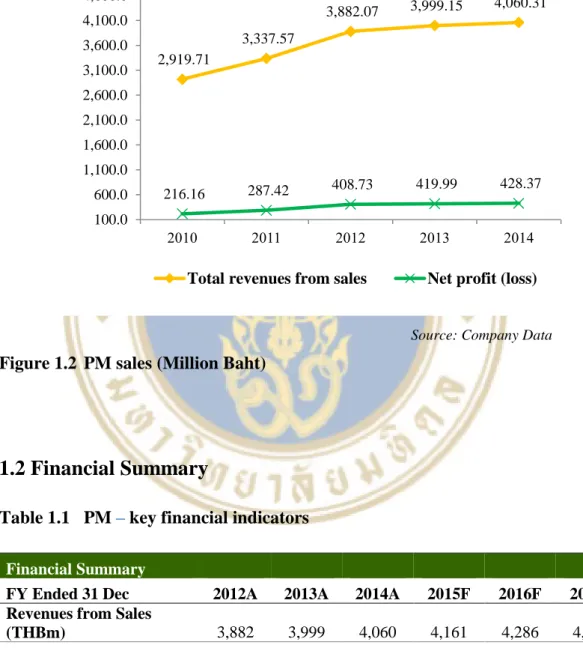
Financial Summary
Furthermore, the company has a solid balance sheet with zero short-term debt, low long-term debt, high retained earnings, and a high return on equity.
Business Description
- Company profile
- Company strategies
- Distributed products
Premier Canning Industry Co., Ltd. a subsidiary of the company) manufactures sauces and prepared sauce under the brand name "King's Kitchen" or abbreviated. A Plus Supply Co., Ltd., manufacturer under the brand name "A Bonne", including lotion, soap, spa salt and bath salt.
Macro-Economic Analysis
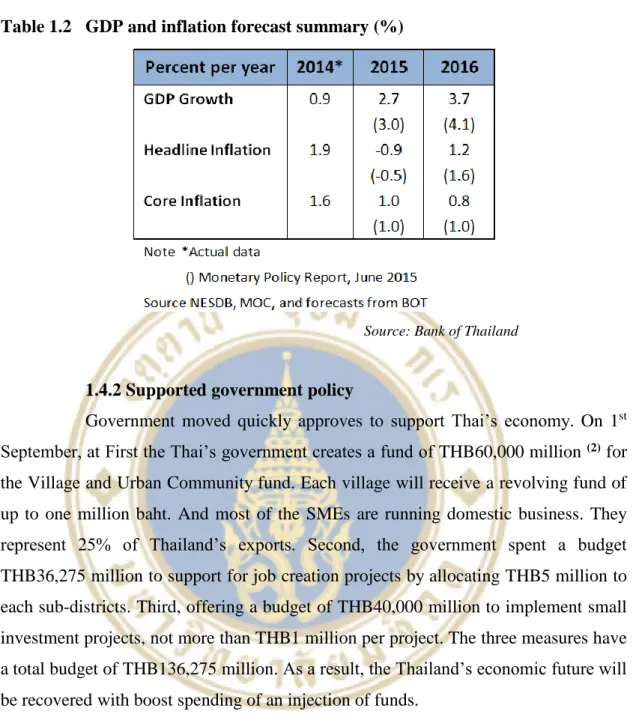
- Projected Thai economy
- Supported government policy
- ASEAN economic community
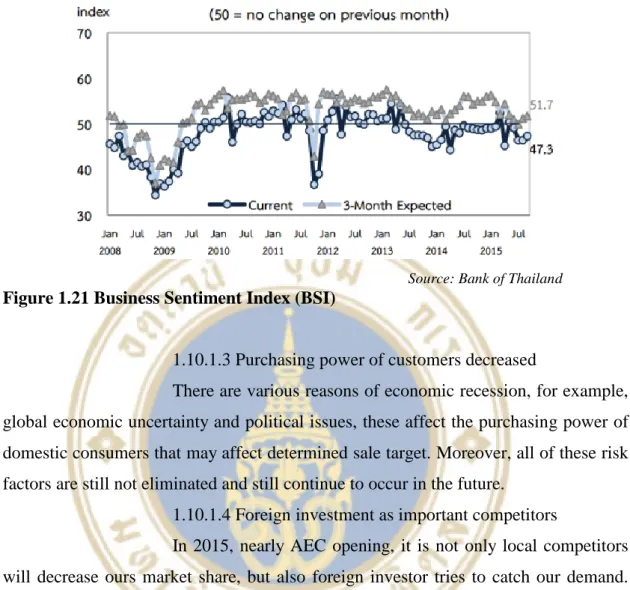
- Outlook for 2015 the export volume
- Consumer confidence index
- Regional cargo transport hub
Then the growth of the various regional economies and its rising middle class speak volumes for the future, as Thai companies can take advantage of expansion opportunities. The mainly due to five key factors consists of the slowdown in key trading partners' economies.
Industry Analysis
- Domestic food consumption
- Convenience food segment
- Thailand position as “The kitchen of the world”
- Global demand for canned tuna
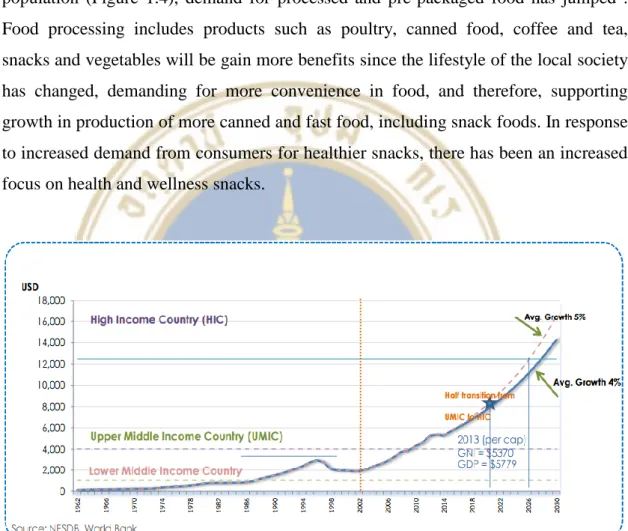
With Thailand's growing middle class comprising nearly 55% (8) of the population (Figure 1.4), demand for processed and prepackaged foods has soared. In the first quarter of the year, the import of canned tuna in most traditionally developed markets was lower than in the same period of 2014.
Competition Analysis
- Porter five’s force analysis
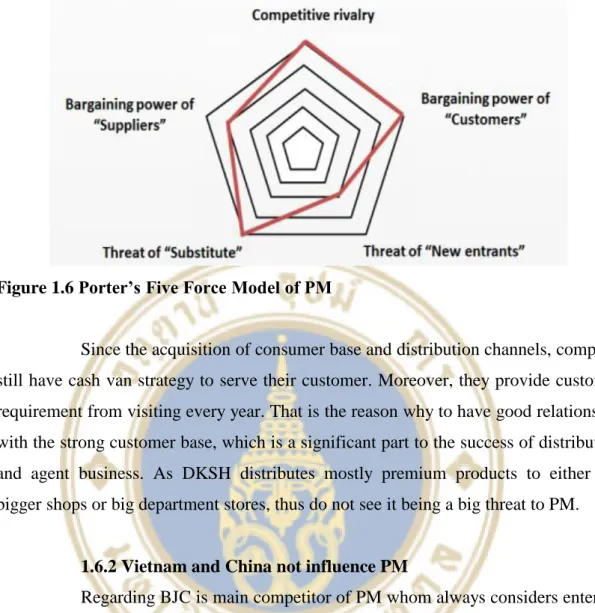
- Vietnam and China not influence PM
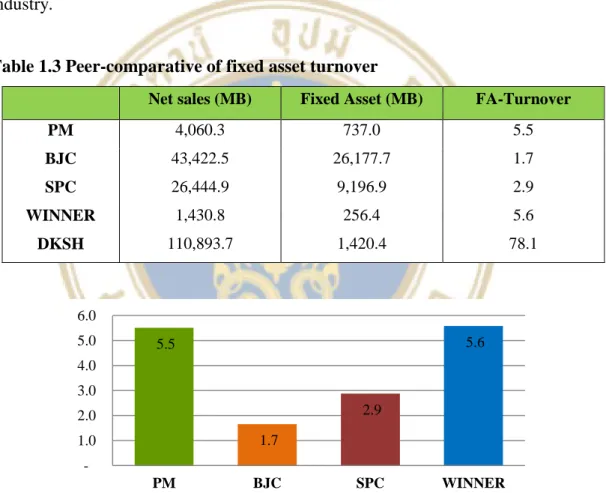
- Fixed asset turnover of peer companies
This is why a good relationship with the strong customer base is an important part of the success of distribution and agent business. As for BJC is the main competitor of PM always considering to go to other countries either to reduce cost production or to win more market share like DKSH. BJC uses cost competitively on Economies of Scale in production and high facility utilization rate which is their odd point.
In addition, they are still building strong ASEAN brands in the global market, especially in Vietnam, while PM does not have a tuna export brand. Regarding the fixed asset turnover of each company, as shown in (Table 1.3) (Figure 1.7), BJC and SPC had a lower amount of fixed asset turnover due to the high amount of fixed assets. The reason PM has high fixed asset turnover is because the company has 3 subsidiaries, they can share fixed assets with each other to run the business.
However, it cannot represent FA's turnover well due to the non-listed company and various sub-deals and stake. From a listed company, PM is a company with a good range to generate sales efficiently with its fixed assets, same as WINNER.
Investment Summary
- House brand will become the main sales contributors
- Allocate budget for new products introduction
- Expansion to social enterprise business
- Sustain profitability and attractive dividend yield
However, PM expects the snack industry to grow by 5% this year and "Taro" is the main product expected to grow above 7%. Therefore, in the long term, PM plans to focus more on its house brand products instead of distributing products from trading partners. The PM plans to invest at least THB 80 million in upgrading factories and machinery to support an increase in production.
This year, the company will introduce more than 30 new products and products with new flavors to the market in the same way as the previous year. This company will then conduct business of investment in social enterprise business and business of manufacturing, marketing, product development and distribution of products from social enterprise business. In the first phase, the company will invest 36 million THB or 50% of the total shares in Green Net SE Co., Ltd., the producer and seller of organic coffee and other agricultural products that are environmentally friendly.
Despite economic slowdown and political instability, the company was still able to grow and maintain constant margins. Moreover, the company has highly attractive dividend policy that pays out at least 50% to its shareholders.
Valuation
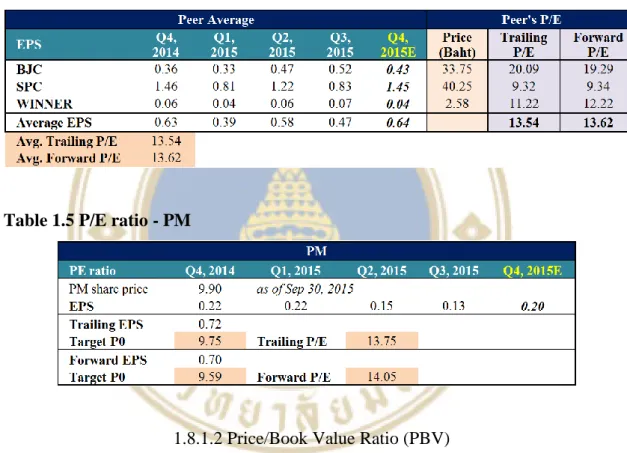
- Relative valuation approaches .1 Price/Earnings Ratio (PE)
- EV/EBITDA
- Relative Valuation approach conclusion
The ratio between price and book value is a valuation ratio that compares a share's price per share. share (market value) with its book value (equity). PM's forward P/BV is equal to 3.26 times, it is also higher than the average forward P/BV around 1.47 times. Overall, as we see from trailing and forward P/BV ratios, the target price should be between 5.43 and 5.67 baht per share.
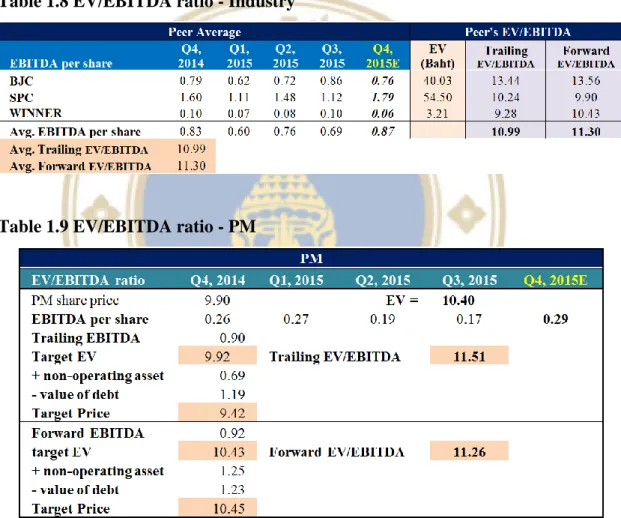
The trailing EV/EBITDA is the sum of four current EBITDA of PM from 4Q42014 to 3Q2015 and divided by the number of share. For the evaluation of target price which includes non-current asset to EV subtract the value of debt. The evaluated target price by adding non-current asset to EV and subtracting with value of debt.
According to the calculation, PM's share price is currently overvalued compared to the target price of trailing EBITDA, while it is undervalued compared to future EBITDA. However, as a result, earnings ratios consisting of PE, PBV and EV/EBITDA showed higher than average.
Financial Statement Analysis
- Financial statement summary (Size analysis) .1 Income statement
- Common size analysis
- Trend analysis
- Financial ratios - return analysis
- Financial ratios – risk analysis
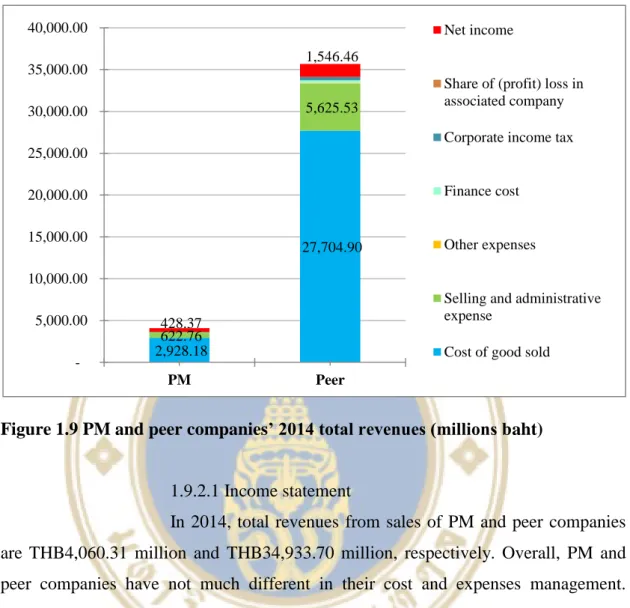
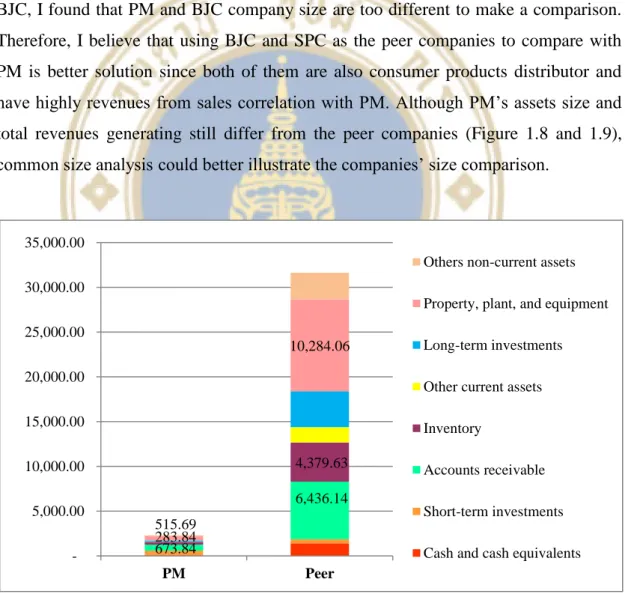
Although PM's asset size and total revenue generating still differ from the peer companies (Figures 1.8 and 1.9), general size analysis can better illustrate the companies' size comparison. As a result, the CAGR of net profit over the past five years of peer companies was only 1.1% (Figure 1.12). Nevertheless, total shareholders' equity increased at a CAGR of 8.3% due to increase in retained earnings (Figure 1.14).
Based on the financial ratio in terms of returns, we would like to worry about the profitability of ROA and ROE (Figure 1.15) and the return of each profitability margin (Figure 1.16) by comparing PM companies and similar companies that BJC, SPC and WINNER as competitors over the past five years, from 2010 to 2014. According to Figure 1.15, PM's return on equity was significantly higher than that of its peers (about 16.54%), as PM's return on equity in 2014 was 33.2% due to the dramatic increase in PM's EBIT. To measure liquidity risk, it can use the current and quick ratios (Figure 1.17), including the cash conversion cycle (Figure 1.18), by comparing PM and peers over the past five years, from 2010 to 2014.
As we see in the graph that the quick ratio was lower than 1 and the current ratio equal to 1 (Figure 1.17). Compared to the CCC of peers, it had a higher cash cycle, the average CCC of peers was about 53 days which is higher than PM about 31 days (Figure 1.18). For the average D/E ratio of peer companies it is equal to 1.1 times and it seems that it will continue to increase due to the dramatic increase in liabilities while the total capital was only slightly increased (Figure 1.19).
The most significant factor that increased this ratio was thus EBIT, which increased significantly over five years until the average to 84.3 times for peer companies around 11.3 times (Figure 1.20).
Investment Risks and Downside Possibilities
- Macro-economic risks
- Market and competition risks
- Operational risks
- Sensitivity analysis
Since PM and its subsidiaries earn approximately 25% of total revenue from exports, fluctuations in exchange rates will affect the company's revenue. Therefore, we perform a sensitivity analysis on the impact on the target price in relation to changing the final growth rate and the cost of capital, which are direct factors that affect the final value (Table 1.10). The cost of capital would change based on a change in capital structure or a change in the cost of funds.
The terminal growth rate has a positive relationship with the target price, while the cost of capital has a negative relationship with the price. The more Thailand's economy recovers, the higher the company's price target will be. Moreover, the higher cost of capital will lower the company's price target.
The green area represents the condition that makes target price greater than 12.00 Baht, the price of DCF model. The yellow area represents the condition that makes stock still undervalued and target price does not exceed the price of DCF model.
DATA
Business Overview
- PM history
- PM group structure
- PM’s corporate governance policy
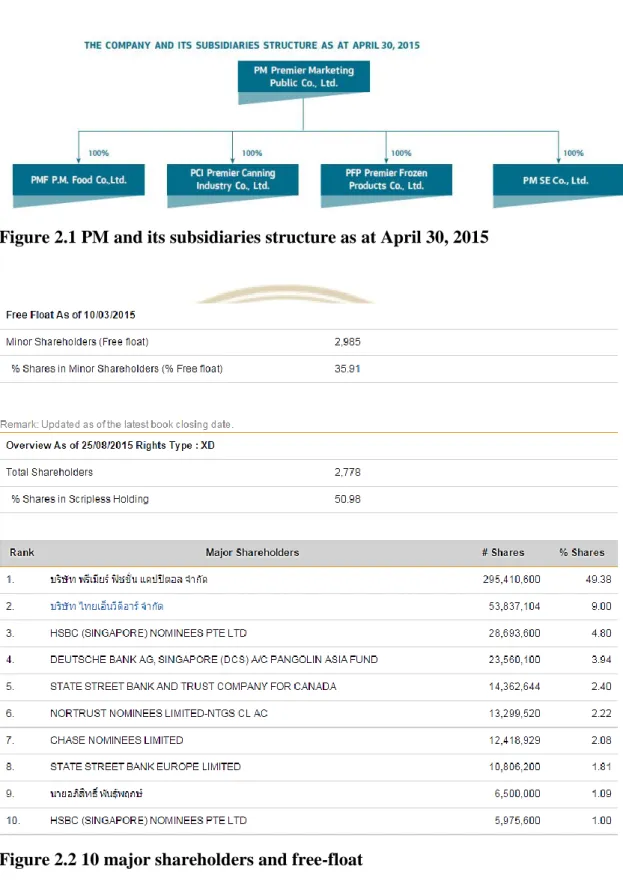
In other parts of its operations, as at 30 April 2015, the Company acquired 100 percent of the registered capital of 4 subsidiaries, which operate related businesses as follows (Figure 2.1). PMF's products are sold locally and overseas and the Company has been appointed as its sole distributor for the local market. The manufacturer and sells tuna-related products, which are bagged and canned ready-to-eat tuna and bagged and canned tuna pet food under the customer's brand.
All of our products are exported to overseas markets in Asia, Europe and the Middle East. The Company was established on April 10, 2015 with the objective of investing in social enterprise businesses and building on the core values of the Company and the Premier Group of Companies on sustainability in society. It believes that good corporate governance and management under the framework of good ethics, transparency, accountability and fairness to all relevant parties will help promote sustainable and sustainable growth of the Company and help increase the trust of shareholders, investors and all related parties.
Business Analysis
- SWOT analysis
- Porter’s five-force analysis
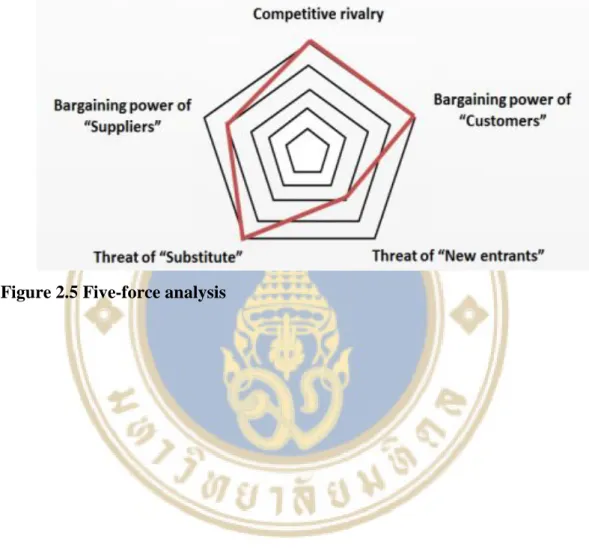
For the food and beverage industry, many competitors are doing business to intensively be the market leader. Regarding my analysis, I consider the threat of potential new entrants at the medium level, the threat of supplier bargaining power at the top level, the threat of substitute products and services, the threat of bargaining power of buyers, and the threat of rivalry between existing competitors in very high level. (Figure 2.5). The distribution business is not very difficult to enter, but it needed high initial investment in terms of vehicle distribution and road expertise distribution.
They may choose other distribution channels not available from PM, such as air transportation by another distributor or rail freight services offered by the government at a lower cost. Since the main sources of raw materials are from a quality supplier, in addition, the raw materials are natural resources; the company faces fluctuating raw material prices and quantities. If the price of raw materials increases or if raw materials are scarce, the company must still purchase these natural raw materials.
In addition, the house brand products that the company sells in the market are categorized as the convenience food, especially snacks. Since there are so many snacks sold in the market, consumers have a very high power to choose whatever they want.
Financial Statements
- Actual and projected income statements
- Actual and projected balance sheet statements (assets)
- Actual and projected balance sheet statements (liabilities and shareholder’s equity)
- Actual and projected statements of Cash Flows