The relationship between governance, openness and a country's economic performance has been a topic of considerable interest not only among scholars but also among policy makers in all countries around the world. I would also like to express my thanks and appreciation to all members of the commission, Assistant Professor Dr.
INTRODUCTION
- Statement of the Problem
- Significance of the Research
- Research Questions
- Research Objectives
- Scope of the Research
- Definitions
- Governance
- Openness
- Economic Performance
- Expected Benefits of the Research
- Limitations of the Research
- Limitations of the Data
- Limitations of Methodology
The focus of this research is the relationship between governance, openness and economic performance in selected developing countries in Asia and sub-Saharan Africa. This research contributes to the existing knowledge regarding the relationship between governance, openness and economic performance in four ways.
LITERATURE REVIEW AND CONCEPTUAL FRAMEWORK
Theories of Political Institutional
- Political Institutional Theory
- Neo-institutionalism Theory
- New Institutional Theory
Furthermore, neo-institutionalism gives an emphasis on the institutions that define the behavior of the actors in front of their social media. Davis (2009) elaborated that “the influence of the new institutional theory pioneered by North was.
Theories of Openness
- Comparative Advantage Theory
- Factor Endowment Trade Theory
- Neoclassical Trade Theory
- Compensation Theory
- Convergence Theory
- The New Trade Theory
However, the impact of openness on social stability appears to be in the opposite direction. These types of compensation can be given in several forms; the most common is in the form of redistribution through a larger public sector.
Theories of Economic Performance
- Neoclassical Growth Theory
- Endogenous Growth Theory
On the contrary, the 'new' theory explicitly takes these costs into account, in the form proposed by Samuelson (1954): iceberg costs (part of the product 'melts' during transport). There are therefore reasons for constructing a theory of relative rise and fall that is not based on any of the existing, mainstream theories.
Governance
- Measures of Governance
- Empirical Evidence between Governance and Economic Performance Several empirical studies have been conducted in the 1990s, which focused on
Most importantly, they were tested in the first phase of this project and found acceptable in 16 countries representing 51% of the world's population. In connection with this, one of the three initiatives, which is mostly advanced, is the WGI.

Openness
Economic Performance
- Economic Growth as an Indicator of Economic Performance
- Other Indicators of Economic Performance .1 National Poverty Rates
Since GDP is equal to national income, the value of GDP per capita is the income of a representative individual. Because of the difference in population between countries, GDP per capita is considered a more useful measure than GDP for determining living standards.
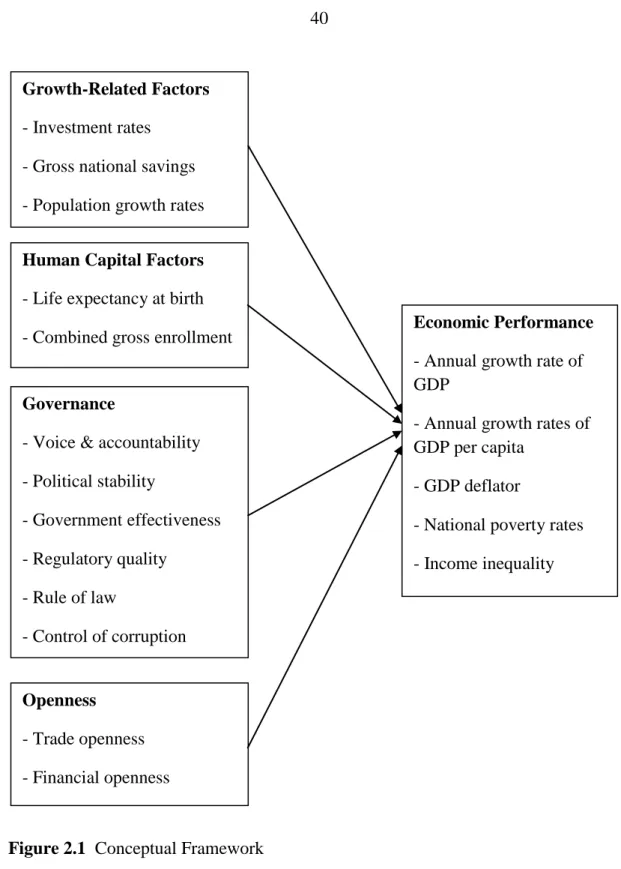
Conceptual Framework
- Hypotheses
H7-2: Trade openness has a positive effect on annual growth rates in GDP per inhabitant. H8-2: Financial openness has a positive effect on annual growth rates in GDP per inhabitant.
RESEARCH METHODOLOGY
- Sample Selection
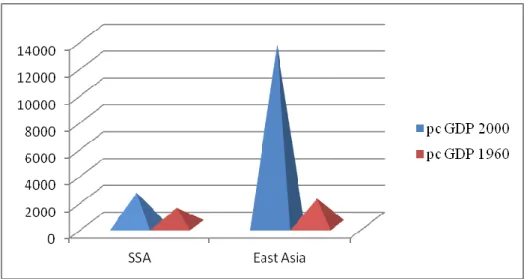
- Some Data about EA and SSA Economic Growth
- Data Collection
- Validity
- Data Analysis
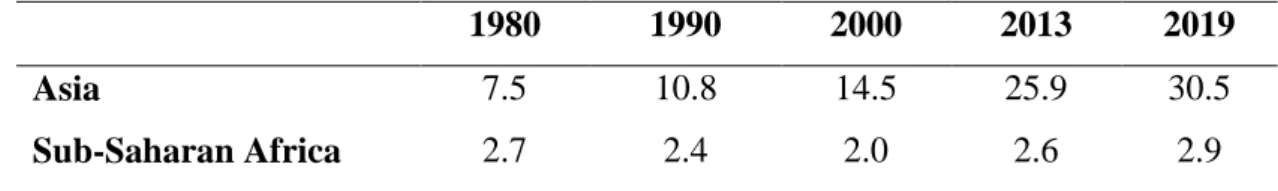
It is interesting to compare the history of Asia and the SSA economy in terms of factors influencing economic performance. This variable is measured as the percentage of the population living below the national poverty line. This variable captures perceptions of the extent to which a country's citizens are able to participate in choosing their government, as well as freedom of expression, freedom of association, and a free media.
This variable captures perceptions of the likelihood that the government will be destabilized or overthrown by unconstitutional or violent means, including political ones. This variable captures perceptions of the extent to which public power is exercised for private gain, including both petty and large forms of. Net outflow of foreign direct investment is the value of direct outward investment made by residents of the reporting economy to external economies.
After data collection, cross-country and time-series analysis of the effect of governance and openness on economic performance were used in data analysis.
OVERVIEW OF ASIA AND SUB-SAHARAN AFRICA
- Overview of Governance
- Overview of Openness
- Overview of Economic Performance
- Comparison of the Descriptive Statistics between Asia and Sub- Saharan Africa
As a result, countries' economic development policy and its implementation effectively support investment and growth. Some of the major economic results in Asia can be explained by year as follows. One of the factors that caused the economy to grow tremendously was the population (Wikimedia, 2015).
Therefore, "Asia became one of the largest sources of automobiles, machinery, audio equipment and other electronic equipment" (Wikimedia, 2015). In 2001, almost all Asian and global economies were affected by the 9/11 attacks, with Indonesia and Japan the hardest hit. This section provides descriptive statistics and a discussion of the data used to test the hypotheses in this research.
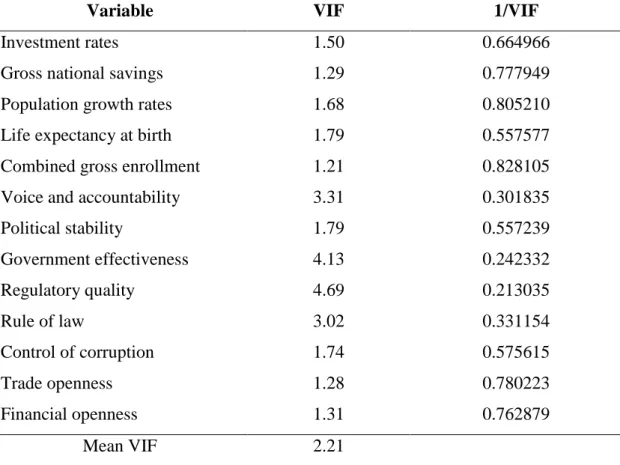
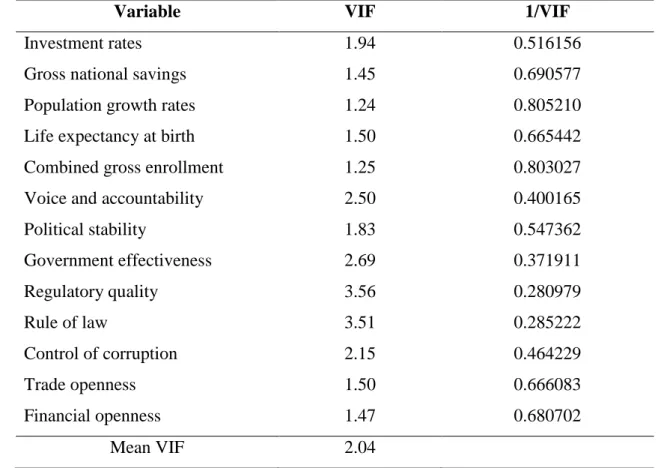
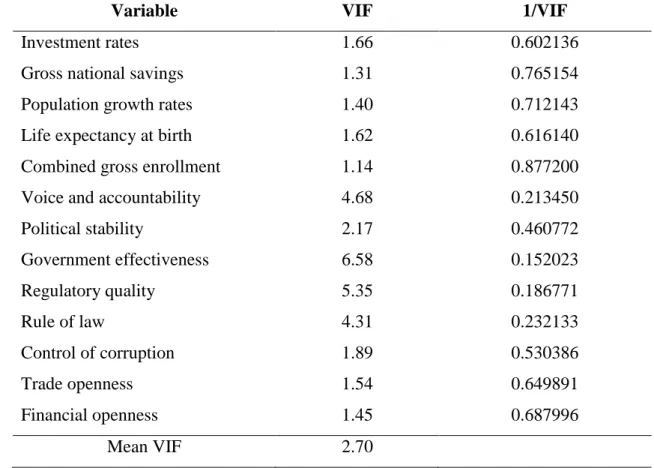
A summary of the statistics for data from Asia and SSA is shown in Table 4.2 and Table 4.3 respectively.
DESCRIPTIVE STATISTICS AND DATA ANALYSIS: RELATIONSHIP BETWEEN GOVERNANCE, OPENNESS, AND ECONOMIC
PERFORMANCE IN DEVELOPING COUNTRIES
Descriptive Statistics
Data Analysis
- The Relationship between Governance, Openness, and Annual Growth Rates of GDP
- The Relationship between Governance, Openness, and Annual Growth Rates of GDP Per Capita
- The Relationship between Governance, Openness, and GDP Deflator
- The Relationship between Governance, Openness, and National Poverty Rates
- The Relationship between Governance, Openness, and Income Inequality
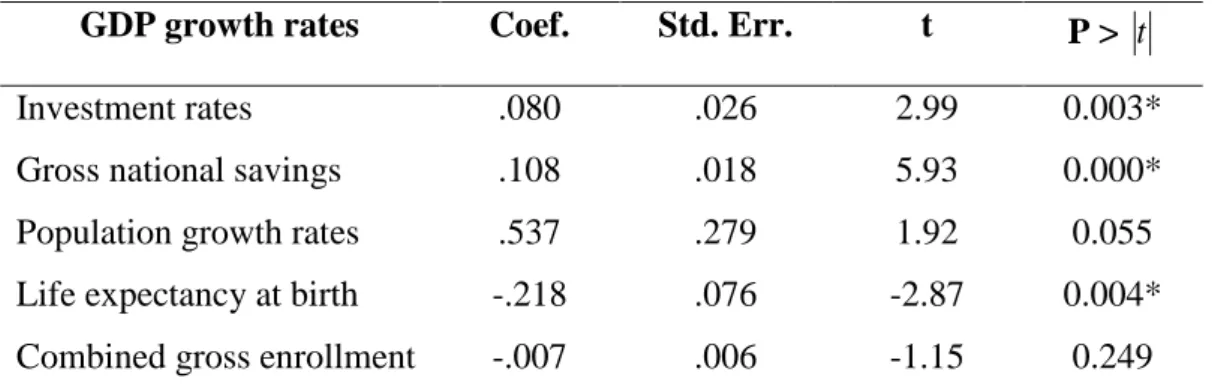
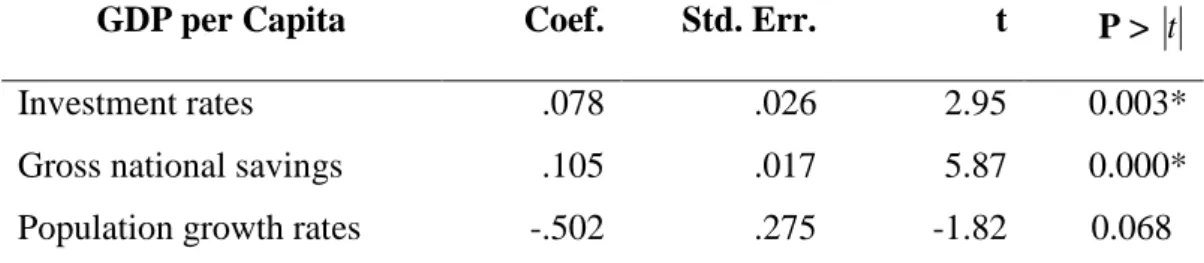
The results in table 5.3 show multiple regression analysis of the significant predictor variables and annual GDP growth rates. On the other hand, regulatory quality and life expectancy at birth had a negative relationship with annual GDP growth rates with a regression coefficient of 7.12 and 0.218, respectively. The results in table 5.5 show multiple regression analysis of the significant predictor variables and annual growth rates for GDP per inhabitant.
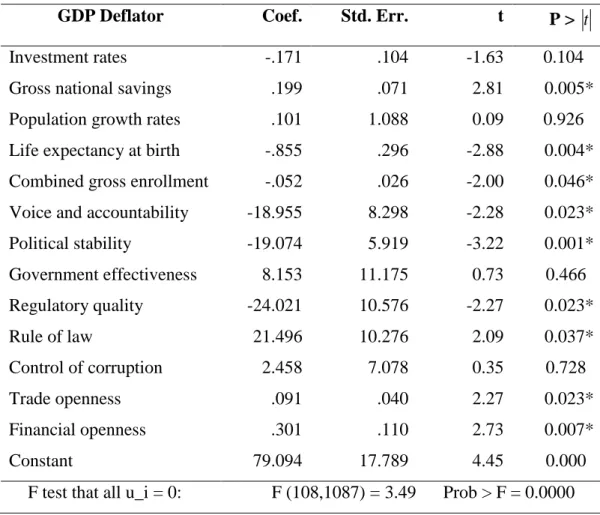
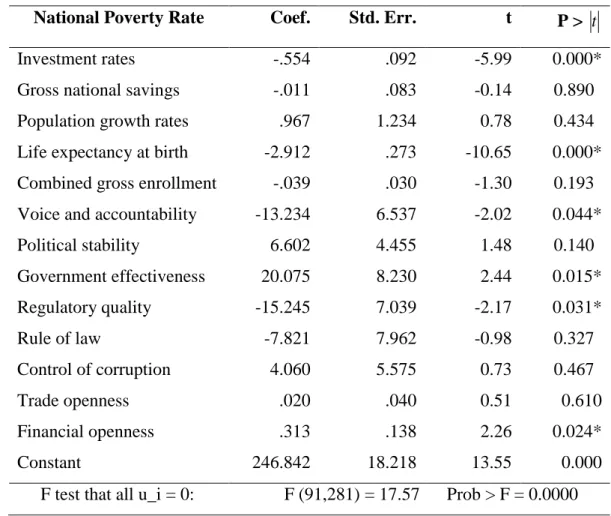
According to the results of the regression coefficient of the predictor variables, it was found that the effectiveness of the government had the greatest positive relationship with the annual growth rates of GDP per capita at the 0.05 level of significance. The results in Table 5.7 show the multiple regression analysis of the significant predictor variables and the GDP deflator. The results in Table 5.9 show the multiple regression analysis of the significant predictor variables and the national poverty rate.
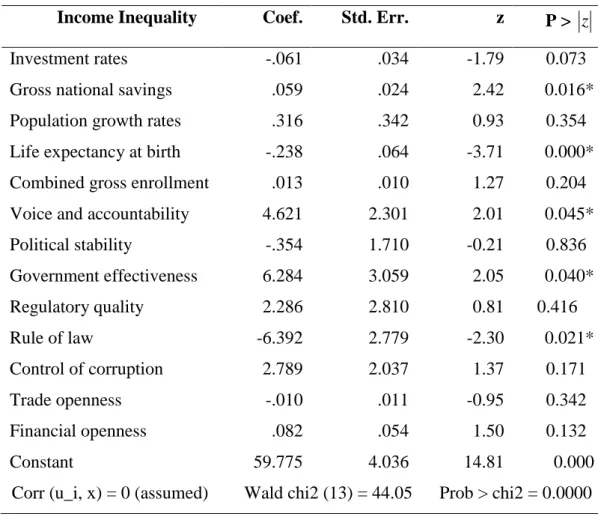
The results in Table 5.11 show the multiple regression analysis of the significant predictor variables and income inequality.
Hypothesis Results
Gross National Savings Population Growth Rates Life Expectancy at Birth Combined Gross Enrollments Voice and Responsibility Political Stability.

DATA ANALYSIS: RELATIONSHIP BETWEEN GOVERNANCE, OPENNESS, AND ECONOMIC PERFORMANCE IN ASIA
- The Relationship between Governance, Openness, and Annual Growth Rates of GDP
- The Relationship between Governance, Openness and Annual Growth Rates of GDP per Capita
- The Relationship between Governance, Openness, and GDP Deflator
- The Relationship between Governance, Openness, and National Poverty Rates
- The Relationship between Governance, Openness, and Income Inequality
- Hypotheses Results
The results in Table 6.2 show the multiple regression analysis of significant predictor variables and annual GDP growth rates. According to the results of the regression coefficient of the predictor variables, it was found that voice and responsiveness had the greatest positive relationship with GDP growth rates at the 0.05 level of significance. The results in Table 6.4 show the multiple regression analysis of the significant predictor variables and the annual growth rates of GDP per capita.
According to the results of the regression coefficient for the predictor variables, it was found that voice and accountability had the greatest positive correlation with annual GDP growth rates per inhabitant at the 0.05 significance level. The results in Table 6.6 show multiple regression analysis of the significant predictor variables and GDP deflator. The result in table 6.8 shows multiple regression analysis of the significant predictor variables and national poverty rates.
The results in table 6.10 show multiple regression analysis of the significant predictor variables and income inequality.
DATA ANALYSIS: RELATIONSHIP BETWEEN GOVERNANCE, OPENNESS, AND ECONOMIC PERFORMANCE IN
SUB-SAHARAN AFRICA
- The Relationship between Governance, Openness and Annual Growth Rates of GDP
- The Relationship between Governance, Openness, and Annual Growth Rates of GDP per Capita
- The Relationship between Governance, Openness, and GDP Deflator
- The Relationship between Governance, Openness, and National Poverty Rates
- The Relationship between Governance, Openness, and Income Inequality
- Hypothesis Results
The results in Table 7.2 show the multiple regression analysis of the significant predictor variables and annual GDP growth rates. According to the regression coefficient results of the predictor variables, it was found that government effectiveness had the largest positive relationship with GDP growth rates at the 0.05 significance level. The results in Table 7.4 show the multiple regression analysis of the significant predictor variables and the annual growth rates of GDP per capita.
The results in Table 7.6 show the multiple regression analysis of the significant predictor variables and GDP deflator. The results in Table 6.10 show the multiple regression analysis of the significant predictor variables and national poverty rates. The results in Table 7.10 show the multiple regression analysis of the significant predictor variables and income inequality.
The relationship between governance, openness and economic performance in sub-Saharan Africa is shown in Table 7.11.
DISCUSSION OF RESULTS
- The Relationship between Governance, Openness, and Annual Growth Rates of GDP
- The Relationship between Governance, Openness, and Annual Growth Rates of GDP per Capita
- The Relationship between Governance, Openness, and GDP Deflator The findings of this research showed that regulatory quality had a significant
- The Relationship between Governance, Openness, and National Poverty Rates
- The Relationship between Governance, Openness, and Income Inequality
The findings showed that the higher the voice and accountability and effectiveness of the government, the greater the annual GDP growth rates. The findings showed that the higher the regulatory quality, the lower the GDP deflator. This means that the technical design of regulatory instruments has an impact on economic growth.
For sub-Saharan Africa, the rule of law had the largest relationship with the GDP deflator. The finding indicated that the higher the rule of law, the greater the GDP deflator. The findings of this research showed that regulatory quality had a significant and negative relationship with the national poverty rates in Asia; in other words, regulatory quality can reduce poverty.
However, the relationship as positive; in other words, corruption control and voice and accountability can increase income inequality.

- The Relationship between Governance, Openness, and Annual Growth Rates of GDP
- The Relationship between Governance, Openness, and Annual Growth Rates of GDP per capita
- The Relationship between Governance, Openness, and National Poverty Rates
- The Relationship between Governance, Openness, and Income Inequality
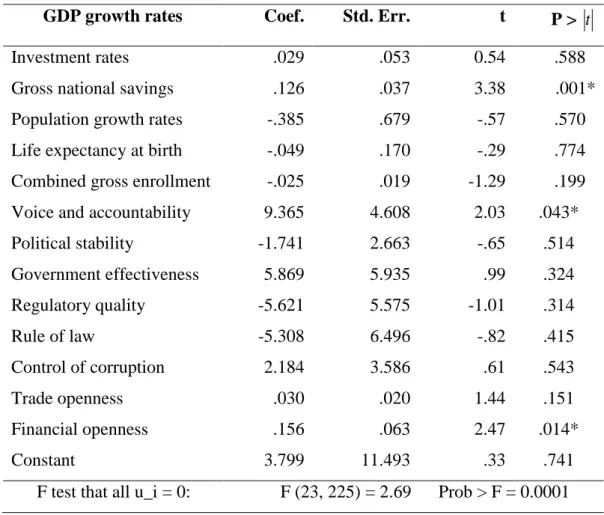
When gross national saving increases by 1 percent, annual GDP growth rates will increase by 0.126 percent. When voting and accountability increase by 1 percent, annual GDP growth rates will grow by 9.365 percent. Furthermore, when financial openness increases by 1 percent, annual GDP growth rates will increase by 0.156 percent.
When voice and accountability increase by 1 percent, annual GDP growth rates will increase by 5,838 percent. When gross national savings increase by 1 percent, annual per capita GDP growth rates will increase by .124 percent. When voice and accountability increase by 1 percent, annual GDP growth rates will increase by 9.257 percent.
If gross national savings increases by 1 percent, annual GDP per capita growth will increase by 0.041 percent.

CONCLUSIONS
- Major Findings
- Policy Implications
- Theoretical Contributions
- Suggestions for Further Research
Governance factors that had a negative relationship with national poverty rates were regulatory quality, voice, and accountability. In the case of Asia, the governance factor that had a positive relationship with annual GDP growth rate and annual GDP per capita growth rate was voice and accountability. The openness factor that had a positive relationship with annual GDP growth rate and annual GDP per capita growth rate was financial openness.
The trade openness factor was unexpectedly related to national poverty rates, implying that it is. On the other hand, regulatory quality was unexpectedly related to annual GDP growth rates and annual GDP per capita growth rates. The openness factor that was positively related to annual GDP growth rate and annual GDP per capita growth rate was trade openness.
The governance factor that had a positive relationship with the GDP deflator was the rule of law.
BIBLIOGRAPHY
Institutions, Governance and Economic Development in Africa: A Review Workshop on 'Transforming Structures: Security, Institutions and Regional Integration Mechanisms'. Retrieved June 12, 2013, from http://www.odi.org/publications/3135-making-sense- governance-need-involving-local-stakeholders. Retrieved August 21, 2013, from http://www.thejakartapost .com/news the-rule-law-and-national-development .html#sthash.NrhNEf1P.dpuf.
The Power to Create Wealth: A Systems-Based Theory of the Rise and Fall of Great Powers in the 20th Century.
APPENDICES
APPENDIX A
APPENDIX B
APPENDIX C