Title Analysis of volatile components from post-harvest treatment and optimization of extractive solvent on leaf quality of Premna serratifolia L. Many thanks are due to the laboratory scientists and technicians of the Faculty of Pharmacy, Silpakorn University, Thailand.
INTRODUCTION
Statement and significance of the problem
However, there were no validated analytical methods to standardize and optimize the extraction solvent on the quality of P leaves. The appropriate percentage of ethanol solvent was optimized to obtain a good herbal extract of P leaves.
Aims and objectives
The main iridoid glycoside was isolated from the leaves of this plant and identified by spectroscopic methods.
LITERATURE REVIEW
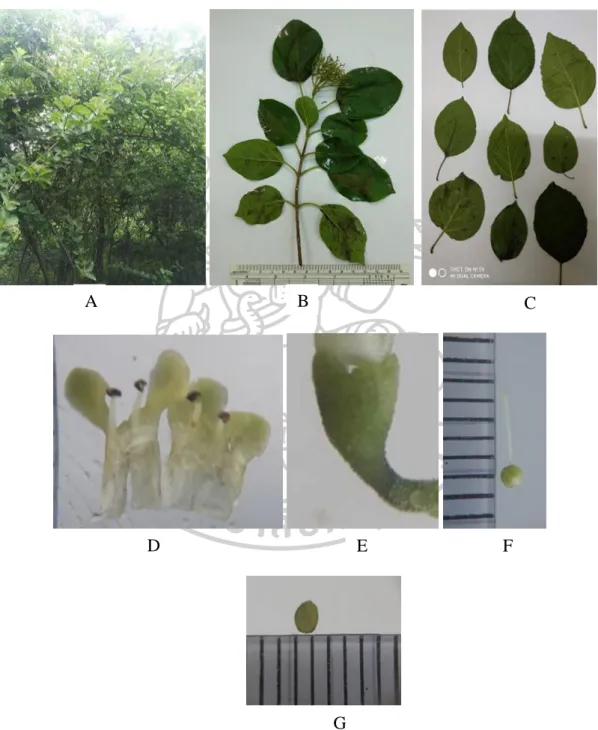
Plant morphological characters
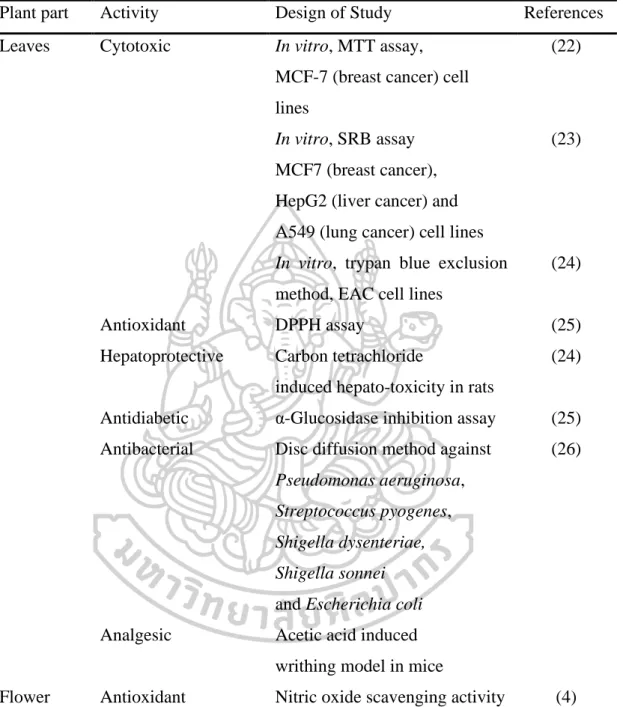
The bioactivity of P. serratifolia
HepG2 (liver cancer) and A549 (lung cancer) cell lines In vitro, trypan blue exclusion method, EAC cell lines.
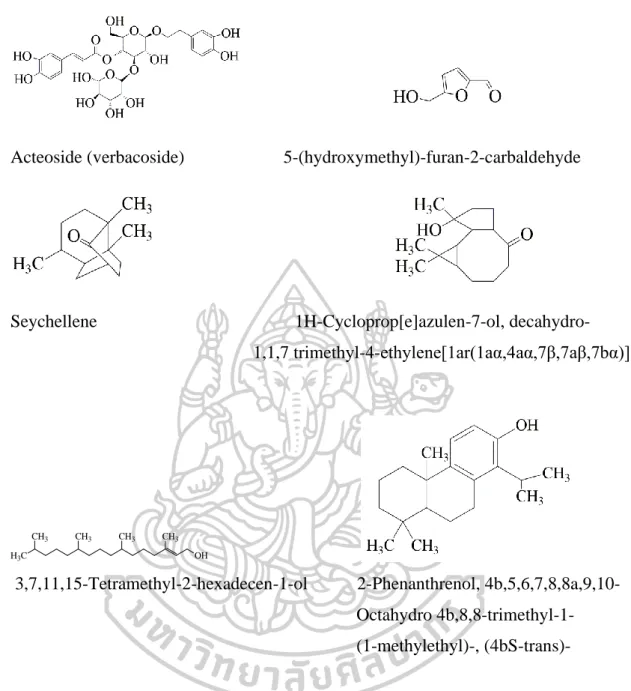
Phytochemical constituents of P. serratifolia
Iridoids and biosynthesis of iridoids
Chromatography
Gas chromatography
- Elution
- Retention time (tR)
- Capacity factor
- Height equivalent to a theoretical plate (HEPT)
- Resolution
- Mass spectrometry
- Gas Chromatography-Mass Spectrometry (GC-MS)
A molecular ion is fragmented into small fragments with different mass-to-charge ratios in a mass spectrometer and can be used to identify a compound. GC-MS is a gas chromatography coupled to a mass spectrometer and is widely used in medicinal chemistry, pharmaceutical analysis, and pharmaceutical biotechnology.
Planar chromatography
- High Performance Thin Layer Chromatography (HPTLC)
Densitometry
The instrument is an integrated computer-controlled unit that leads to highly reproducible and accurate results (1% standard deviation). The technology is based on a preset wavelength of electromagnetic radiation (typically UV/visible from 190-800 nm) that either travels at a predetermined speed through the chromatographic zones or, while the beam remains stationary, the TLC/HPTLC layer is moved under the control of a motorized base plate. The instrument can be pre-programmed to scan at a variety of wavelengths and automatically scan all chromatographic traces on the developed layer.
Chromatograms resulting from scanning the developed traces are very similar to those obtained by HPLC and usually show a series of peaks with baseline resolution where the zones are well separated. The purity of the chromatographic zone can also be evaluated by taking full spectra at the beginning, peak and end of the peak. If the spectra are identical, the peak is considered to be of high purity (45).
Method validation
- Calibration curve and range
- Accuracy
- Specificity
- Precision
- Limit of detection and limit of quantification
- Robustness
The minimum specified range for the determination of a drug substance or a finished (drug) product is 80 to 120 percent of the test concentration. Accuracy is the assessment of how close the result value is to the actual value. Assessment of accuracy should take place after determining the specificity/selectivity, determining the linear range and determining the accuracy of the method.
The precision under the same operating conditions over a short time interval is referred to as repeatability (intra-day precision). A minimum of nine determinations covering the specified range of the procedure must be used to assess repeatability (ie three concentrations and three replicates of each concentration, or the use of at least six determinations at 100% of the test concentrations). The precision of an analytical procedure is usually expressed as the variance, standard deviation, or coefficient of variation for a series of measurements.
The lowest amount of analyte in a sample that can be reliably detected and classified, but not necessarily quantified, under the defined experimental conditions of the analytical method is known as the limit of detection (LOD). The limit of quantification (LOQ) is the lowest amount of analyte in a sample that can be quantified with adequate accuracy and precision under the experimental conditions specified for the analytical method. Stability is the evaluation of the performance of the method that can change the chromatographic parameter.
MATERIALS AND METHODS
- Determination of post-harvest effects on quality of fresh, dried and fermented
- Plant materials
- Preparation of plant materials
- Preparation of the volatile oils
- GC-MS analysis
- Identification of chemical compounds of the volatile oils
- Determination of total phenolic content and antioxidant activity
- Isolation and identification of chemical constituents of the leaves of P
- Preparation of plant materials
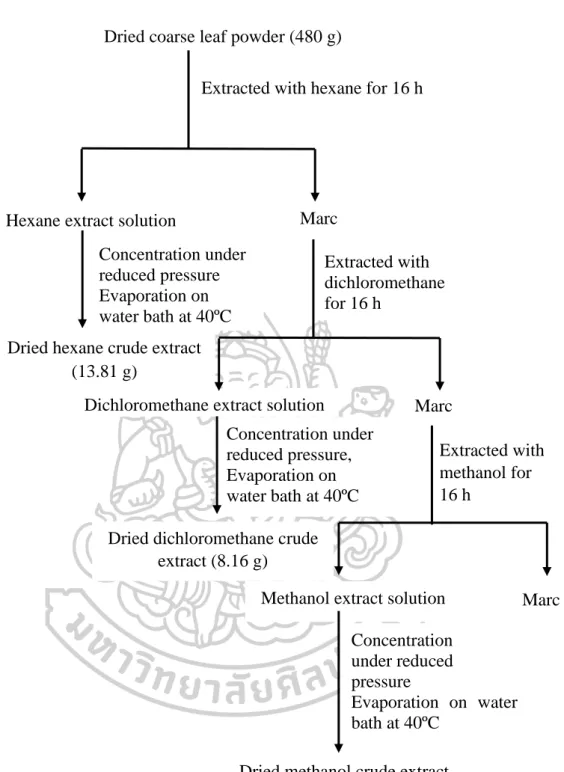
- Extraction
- Phytochemical screening tests
- Chromatographic procedure
- Isolation of premnaodoroside A
- Isolation of D -glucose and D -fructose
- Identification of the isolated compounds
- Characterization of the isolated compounds
- Purity of premnaodoroside A
- Development and validation of TLC-densitometric method
- Preparation of standard stock solution and calibration curve
- Sample preparation
- Chromatographic conditions
- Densitometric parameter
- Method validation
- Optimizing solvent extraction of dried leaves of P. serratifolia
- Plant materials
- Sample preparation
- Determination of the content of premnaodoroside A
- Determination of total phenolic content
- Determination of antioxidant activity
- Statistical analysis
After incubation for 60 min, the absorbance of the sample was measured at 517 nm using a spectrophotometer (Hitachi U-2000 spectrophotometer, Tokyo, Japan). Regression was constructed between % clearance activity and sample concentration, and used to calculate IC50. The appearance of purple-red color in the interphase indicated the presence of sugar.
Sample loading: The sample was dissolved in 10 ml of eluent and gently introduced into the top of the column with a pipette. Sample loading: The sample was dissolved in 10 ml of eluent and it was carefully introduced into the top of the column with a pipette. Detection: Collected fractions were detected using TLC technique. The working solution (mg/ml) was prepared by appropriate dilution of the standard solution with ethanol.
The AUC of spiked samples was then determined and calculated for the amount of the standard with. The LOD and LOQ were calculated based on the standard deviation (SD) of the y-intercept and the slope of (S) of the calibration curve. The voucher specimen is deposited in the herbarium of the Department of Pharmacognosy, Silpakorn University, Thailand.
RESULTS AND DISCUSSION
Determination of post-harvest effects on quality of fresh, dried and fermented
- Identification of chemical constituents of fresh, dried and fermented leaf
- Comparison of fresh, dry, and fermented leaf volatile oils by using DB-5
- Determination of total phenolic content and antioxidant activity
- Determination of total phenolic content
- Determination of antioxidant activity
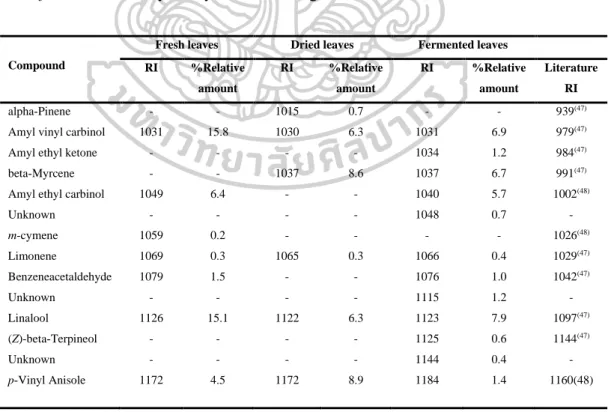
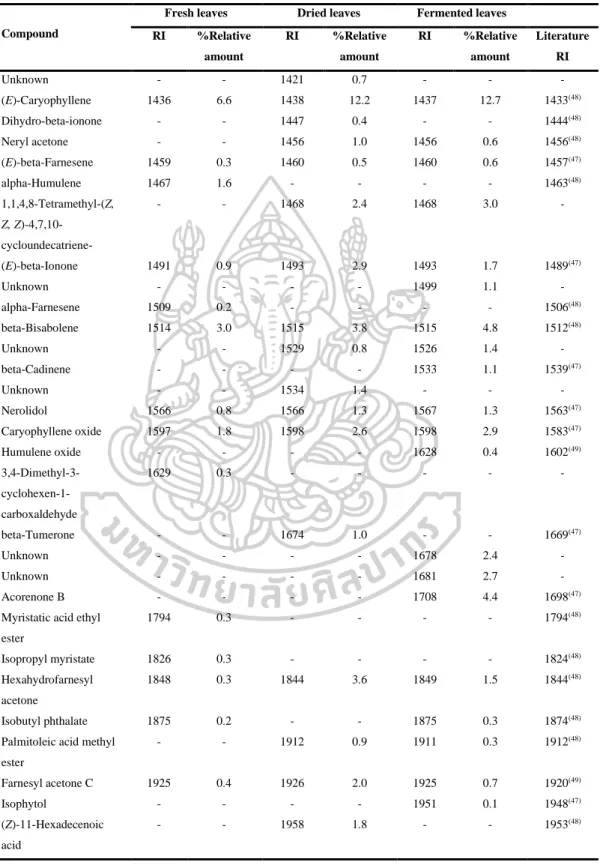
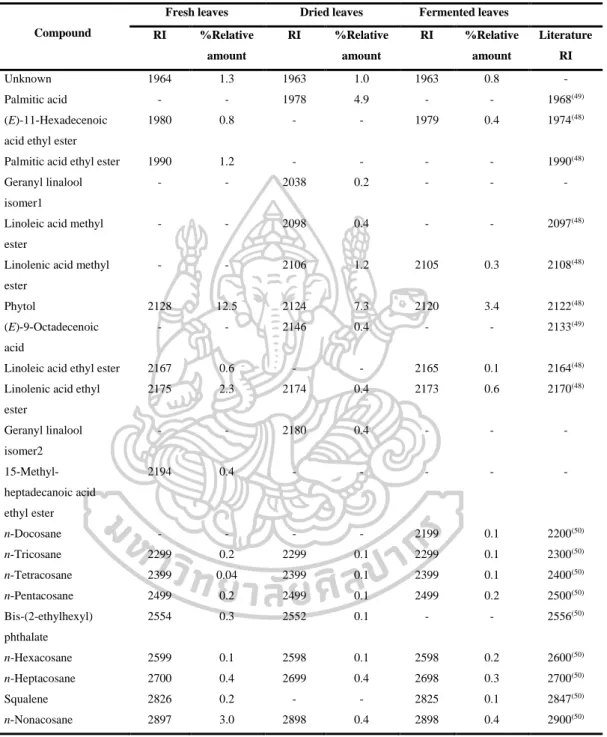
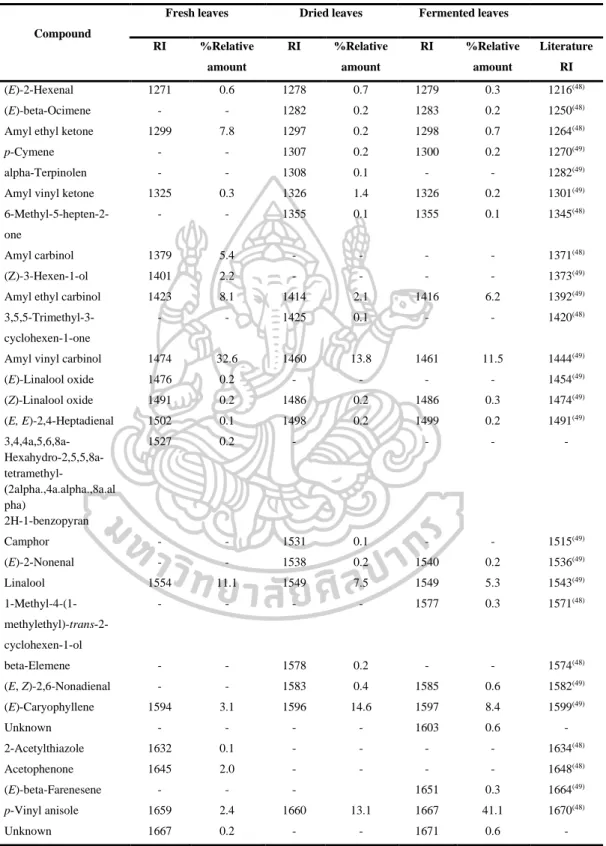
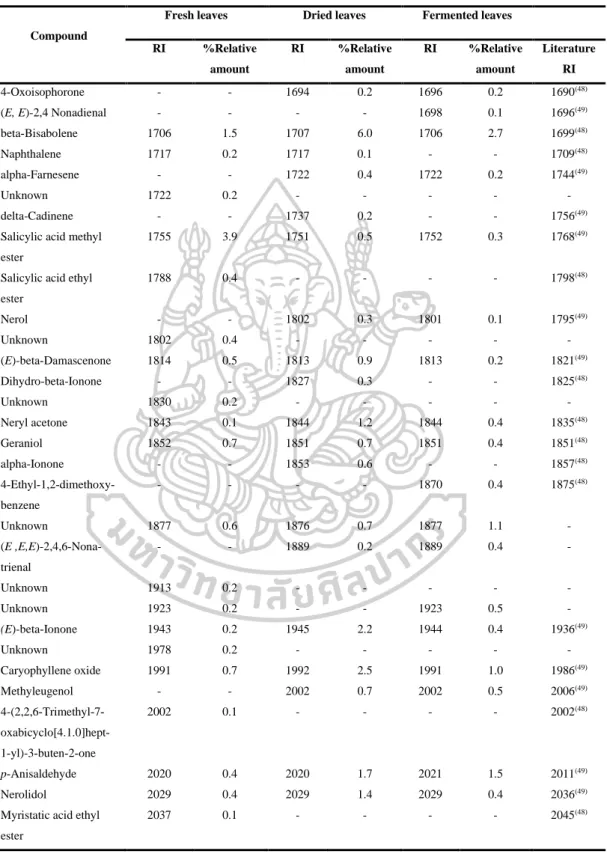
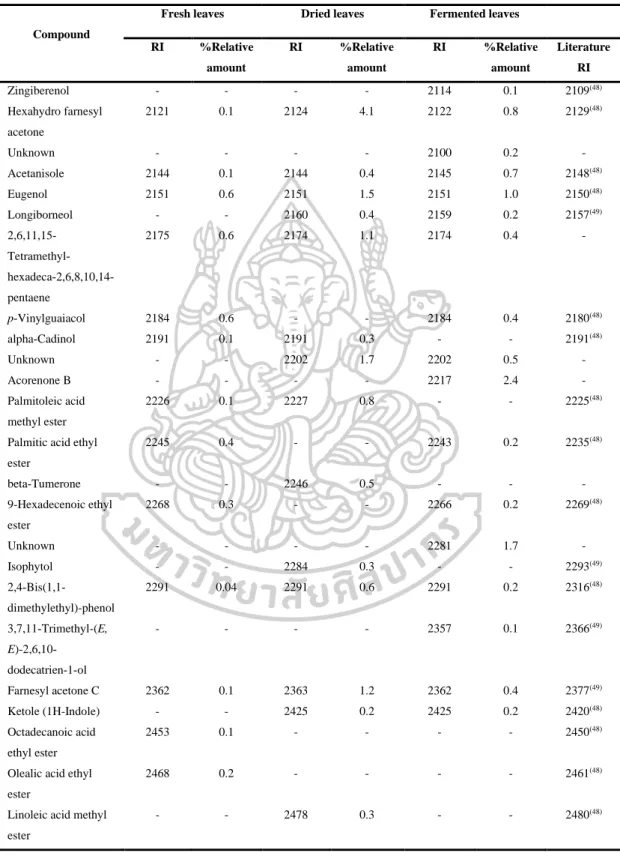
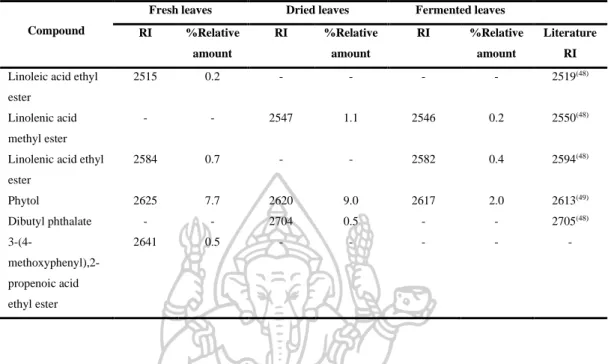
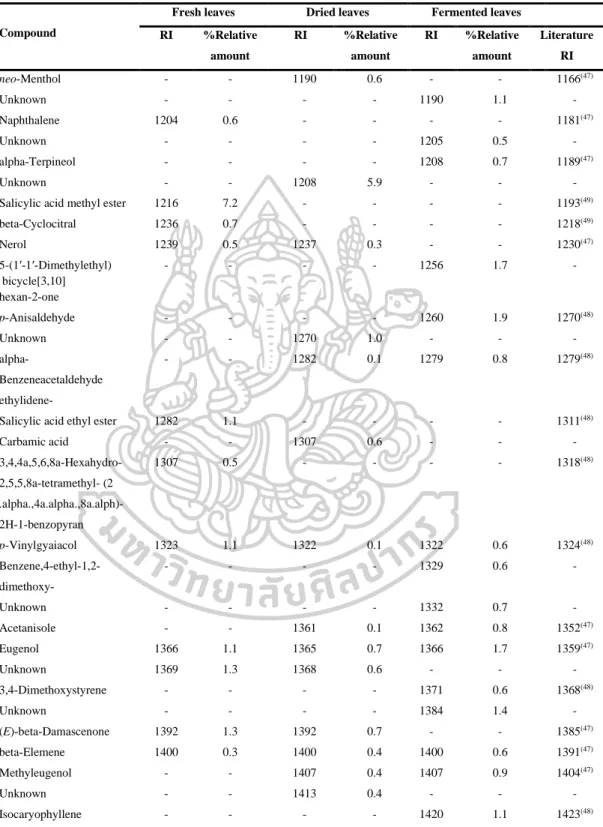
However, the volatile oils of dried leaves contained the highest amount of terpenoids (47.6% in DB-5, 44.7% in Carbowax 20M), but the volatile oils of fermented leaves contained the lowest amount of apocarotenoids and fatty acids in both columns. On the other hand, the highest amounts of phenolic acids (46.2% in Carbowax 20M) appeared in volatile oils of fermented leaves and the lowest amount in volatile oils of fresh leaves (10.9% in Carbowax 20M). Moreover, the results mentioned above indicated that the main constituents of volatile oils of fresh, dried and fermented leaves were amyl vinyl carbinol, linalool, (E) caryophyllene and p-vinyl anisole.
According to the results, different percentages of non-polar, moderately polar and polar compounds in fresh, dried and fermented volatile oils were detected in DB-5 and Carbowax 20M columns. In addition, it was interesting to note that the relative amounts of some compounds in the volatile oils from fresh leaves changed significantly after drying and fermentation. It is important to note that some compounds disappeared and some new compounds were detected in the dried and fermented volatile oils of the leaves (Figure 16).
The relative amounts of apocarotenoids in the fresh leaf volatile oils were (4.9% in DB-5 and 1.7% in Carbowax 20M). After drying and fermentation, the amount of apocarotenoids was increased and it was much higher in the dried leaf volatile oils (11.9% in DB-5 and 12.1% in Carbowax 20M) than in the fermented leaf volatile oils (5.7 % in DB-5 and 2.8% in Carbowax 20M). In addition, three significantly increasing compounds, beta-ionone, hexahydrofarnesylacetone and farnesylacetone C, were detected in dried and fermented leaf volatile oils.
Isolation and identification of chemical constituents of the leaves of P
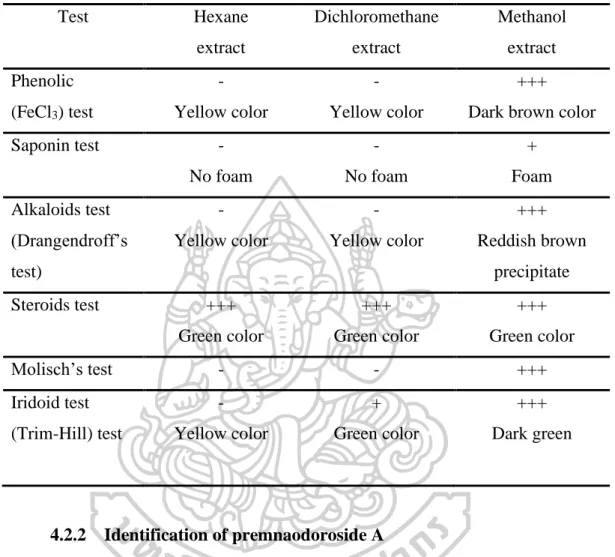
- Phytochemical screening tests
- Identification of premnaodoroside A
- Identification of D -glucose and D -fructose
- Purity of premnaodoroside A
The compound gave a positive result to Trim-Hill reagent, it was possible to be iridoids. The signal from anomeric protons was observed at δ 4.68, indicating the presence of glucose units (Figure 36). The mixture of D-glucose and D-fructose (330 mg) was isolated from methanol extract (18 g) of the leaves of P.
The TLC chromatogram showed a light green spot at the same Rf 0.32 as the standard glucose and a dark green spot at the same Rf 0.33 as the standard fructose (Figure 20). Hydroxy functional groups of glucose and fructose were confirmed by IR bands at 3360.8 and 1055.8 cm-1 of O-H stretch and C-O stretch, respectively (Figure 42). The overall spectrum of 1H-NMR was complicated and could not be assigned, but 13C-NMR spectra produced the characteristic peaks for the identification of the compound (Figure 48).
13C-NMR spectra showed the chemical shift of the carbon signals at δ 92.04 and 95.86 ppm, revealing the presence of the anomeric carbon atoms of α-D-glucose and β-D-glucose, respectively. The carbon signals of β-D-fructopyranose and β-D-fructofuranose were more intense than those of α-D-fructofuranose and the 13C of glucose was not much less intense than fructose. Likewise, the major tautomers of glucose at 27 C were α-D-glucopyranose, β-D-glucopyranose, whereas the minor tautomers were α-D-glucopyranose and β-D-glucopyranose.
Development and validation of TLC-densitometric method
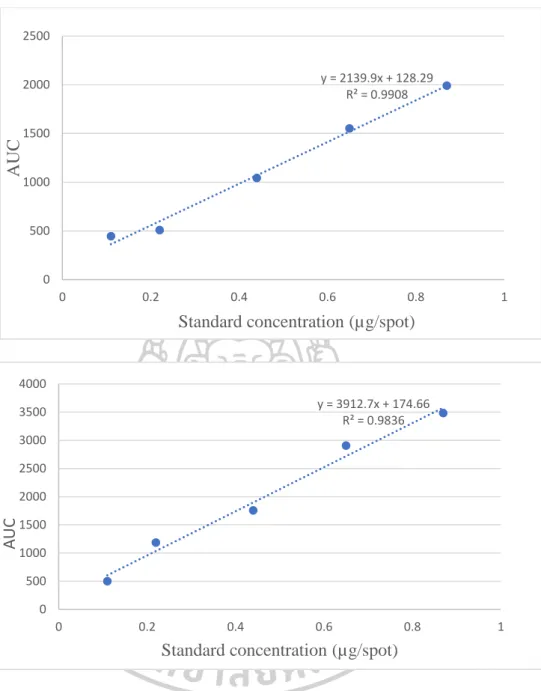
- Calibration curve
- Peak identity and peak purity
- Precision and accuracy
- Recovery
- Limit of detection (LOD) and limit of quantitation (LOQ)
- Robustness
The specificity of the developed method was tested by quantifying the peak identity and peak purity. Peak identity between peaks of premnaodoroside A in the extracts and standard was determined by comparing the spectra in the range 450-700 nm (Figure 52) and they gave good correlation (Table 19). The spectrum of premnaodoroside A is standard with that of extracts, which showed a fairly good correlation of more than 0.96.
The correlation of the considered spectra of the peak at the beginning (S) and the peak (M), (r (S, M)) and the correlation of the considered spectra of the peak (M) and the peak at the end (E) (r (M) , E)) were calculated with CAMAG CATS software. No interfering peak was observed in the densitogram of the standard and extracts, which indicated the specificity of the result (Figure 24 and Table 19). The accuracy of the method was in the range of 99-100%. The results are shown in Table 20.
From the data suggested that the robustness of this method depended on the detection time of the chromatogram after derivatization. After validation according to the ICH guidelines, the method was found to be reliable and suitable for the quantification of premnaodoroside A. However, the color of the compound on TLC faded with time after derivatization and it should be of great concern.
Optimizing solvent extraction of dried leaves of P. serratifolia
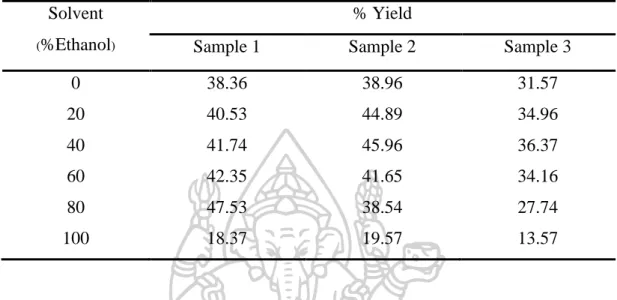
- Yield of the extracts
- Determination of the contents of premnaodoroside A
- Determination of total phenolic content and antioxidant activity
The result pattern of the three samples was the same as shown in Figure 25. The content of premnadoroside A in the 0% ethanol extract was the lowest and would increase with increasing percentage of ethanol solvent. However, this study indicated that to develop a high quality extract, the concentration of the premnaodoroside A was the highest in 100% ethanolic extract, but its yield was the lowest (Table 24).
Its extraction yield was 2.5 times lower than that of the highest yield of 80% ethanol from sample 1, and 40% ethanol extracts from samples 2 and 3. To determine the percentage of the use of ethanol solvents, extraction amounts of premnaodoroside A, total phenolic compounds optimize and antioxidants of plant material were calculated from yields of the extract and the content of these compounds in the extracts (Figure 28). According to the calculation from Tables, the results of premnaodoroside A content, total phenolic and antioxidant activity of all samples were in the same way.
Overall, results revealed that quality and quantity of the extract should be considered to facilitate the pharmaceutical production of the process. Regarding the quality of the extract, 100% ethanol provided the highest amount of premnaodoroside A, total phenolic content and antioxidant activity, but it had the lowest amount of extraction yield. In terms of the amount of extract, 80% ethanol extract provided the higher extraction yield and % extraction amount.
CONCLUSION
The developed TLC densitometry method was used to determine the content of premnaodoroside A. Evaluation of anti-inflammatory and immunomodulatory effects of Premna integrifolia extracts and assay-guided isolation of a COX-2/5-LOX dual inhibitor. Evaluation of in vitro antioxidant activity of stem bark and stem wood of Premna serratifolia Lin., (Verbenaceae).
Chemical composition and antioxidant activity of essential oil and organic extracts of Premna integrifolia linn.