His encouragement and guidance helped me gain new knowledge about Honeybee's leadership and corporate sustainability, which gave me a broader perspective of working under pressure so that I could gain excellent experiences in this thematic article. EXPLORING THE RELATIONSHIP BETWEEN MANAGEMENT PRACTICES AND BUSINESS SUSTAINABILITY IN THAILAND'S ICE INDUSTRY. The purpose of this study is adopted by Avery and Bergsteiner's 23 sustainable leadership practices to explore the relationships between management practices and business sustainability in the ice cream industry in Thailand.
Although this is an important issue, few approaches to corporate sustainability have been studied in the Thai context. This study has already adopted Avery and Bergsteiner's concept of sustainable management, which has been supported by previous studies as an appropriate approach to corporate sustainability in Thailand. The study examines business practices in the ice cream industry to determine if there is a match between sustainable management practices and those of the company in question.
To determine the fit, the literature on sustainable leadership in Thailand is discussed in Chapter 2. In the meantime, it can create a new strategy for companies to sustain in crisis, by monitoring the sustainability of companies, which is a guide to the progress of any undertaking. Aras and Crowther, 2008). Furthermore, corporate sustainability makes it possible to create long-term value for stakeholders by preserving opportunities and managing risks arising from economic, environmental and social developments.
Performance outcomes that are the top of a pyramid that includes five performance outcomes that create sustainable leadership.
RESEARCH METHODOLOGY
Methodology
Long-term or short-term perspective. It favors the long term over the short term. Dominated by short-term profits and growth 9. Culture is weak except for a focus on short-term results that may or may not be shared. According to previous studies (Avery & Bergsteiner, 2011, Kantabutra, 2012, Kantabutra & Avery, 2013 and Kantabutra & Saratun, 2013), honey bee management is adopted as a framework for data collection and analysis as shown in Table 3.1.1.
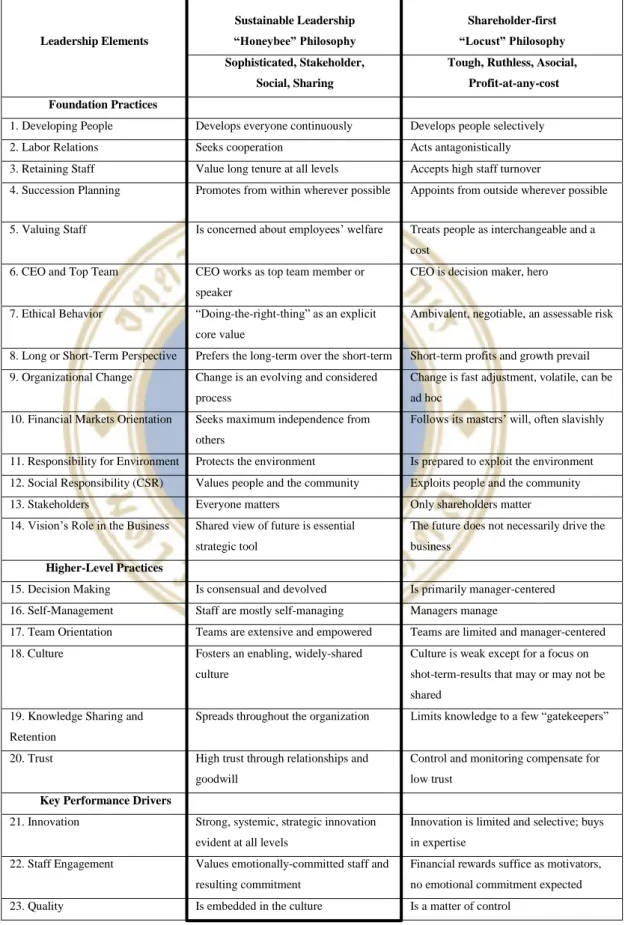
Regarding the Honeybee Leadership Framework, this is a research table used to estimate Thailand's ice cream industry in each element of the Honeybee Leadership Grids. Besides, the Honeybee practice consists of three categories; basic practices, higher level practices, and key performance factors. Primarily, the foundation practice consists of developing people, retaining workforce, retaining staff, succession planning, valuing staff, CEO and top team, ethical behavior, long-term or short-term perspective, organizational change, orientation to the financial markets, environmental responsibility, social responsibility (CSR), stakeholders and the role of vision in the company.
Next, higher-level practices provide decision-making, team orientation, culture, knowledge sharing and retention, and trust.
Hypotheses
H2.1 Brand and reputation H2.2 Customer satisfaction H2.3 Financial performance H2.4 Long-term shareholder value H2.5 Long-term stakeholder value. H3.1 Brand and reputation H3.2 Customer satisfaction H3.3 Financial performance H3.4 Long-term shareholder value H3.5 Long-term stakeholder value. H9.1 Brand and reputation H9.2 Customer satisfaction H9.3 Financial performance H9.4 Long-term shareholder value H9.5 Long-term stakeholder value.
H11.1 Brand and reputation H11.2 Customer satisfaction H11.3 Financial performance H11.4 Long-term shareholder value H11.5 Long-term stakeholder value. H12.1 Brand and reputation H12.2 Customer satisfaction H12.3 Financial performance H12.4 Long-term shareholder value H12.5 Long-term stakeholder value. H13.1 Brand and reputation H13.2 Customer satisfaction H13.3 Financial performance H13.4 Long-term shareholder value H13.5 Long-term stakeholder value.
H14.1 Brand and reputation H14.2 Customer satisfaction H14.3 Financial performance H14.4 Long-term shareholder value H14.5 Long-term stakeholder value. H15.1 Brand and reputation H15.2 Customer satisfaction H15.3 Financial performance H15.4 Long-term shareholder value H15.5 Long-term stakeholder value. H16.1 Brand and reputation H16.2 Customer satisfaction H16.3 Financial performance H16.4 Long-term shareholder value H16.5 Long-term stakeholder value.
H17.1 Brand and reputation H17.2 Customer satisfaction H17.3 Financial performance H17.4 Long-term shareholder value H17.5 Long-term stakeholder value. H18.1 Brand and reputation H18.2 Customer satisfaction H18.3 Financial performance H18.4 Long-term shareholder value H18.5 Long-term stakeholder value. H20.1 Brand and reputation H20.2 Customer satisfaction H20.3 Financial performance H20.4 Long-term shareholder value H20.5 Long-term stakeholder value.
H21.1 Brand and reputation H21.2 Customer satisfaction H21.3 Financial performance H21.4 Long-term shareholder value H21.5 Long-term stakeholder value. H22.1 Brand and reputation H22.2 Customer satisfaction H22.3 Financial performance H22.4 Long-term shareholder value H22.5 Long-term stakeholder value. H23.1 Brand and reputation H23.2 Customer satisfaction H23.3 Financial performance H23.4 Long-term shareholder value H23.5 Long-term stakeholder value.
FINDINGS DISCUSSION
Descriptive Statistic
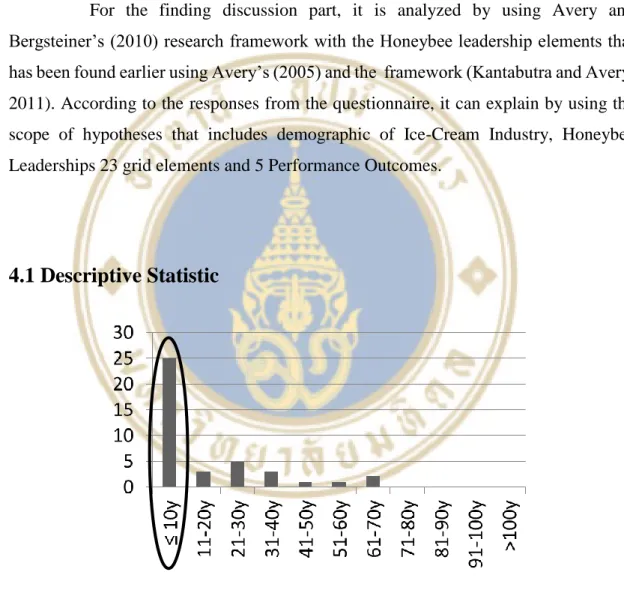
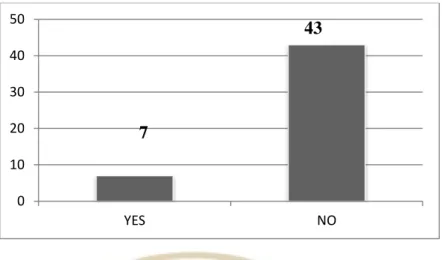
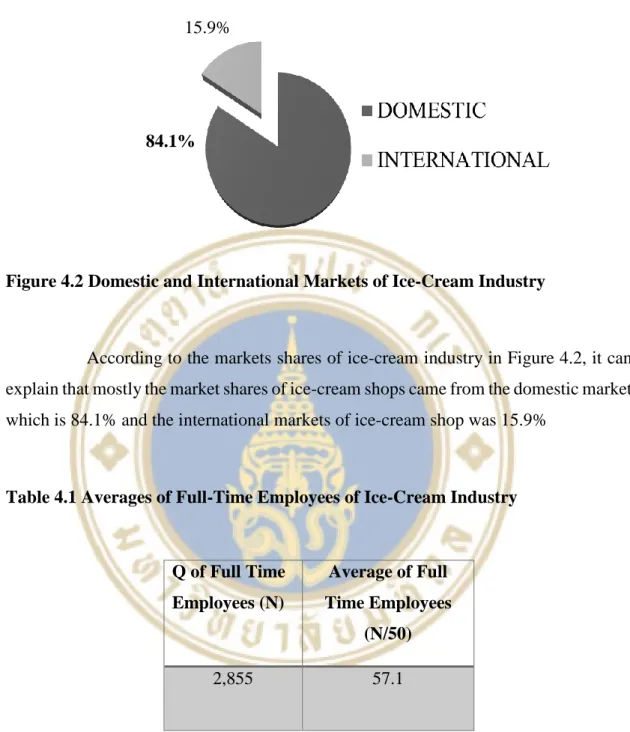
According to the market shares of the ice cream industry in Figure 4.2, we can explain that mostly the market shares of ice cream shops came from the domestic market, which is 84.1%, and the international markets of ice cream shops are 15.9%. According to the average of full-time employees in the ice cream industry in Figure 4.3, it can be related that the average of full-time employees in the ice cream industry was about 57%. According to the quantities of ice cream shops listed in the SET index in Figure 4.4, we can conclude that the quantity of the ice cream industry listed in the SET index was only 7 shops.
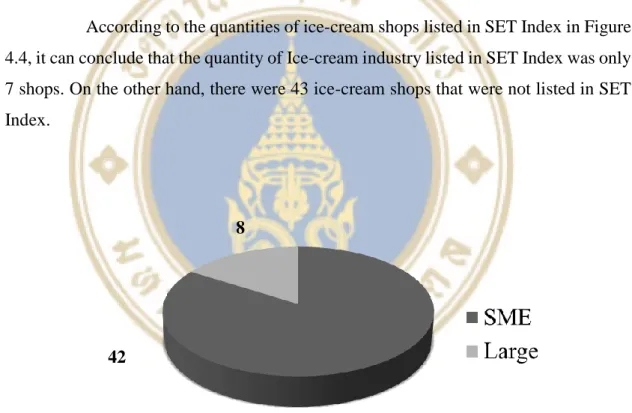
On the other hand, there were 43 ice cream parlors that were not included in the SET index. According to the size of the ice cream shops in the industry in Figure 4.5, it can be explained that most of the size of the ice cream industry was SME, namely 42 shops, and the large size of the ice cream shops was about 8 shops.
Hypotheses Test
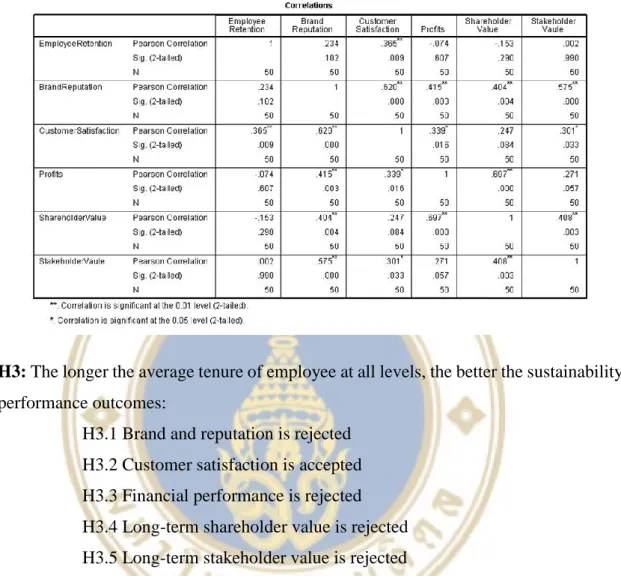
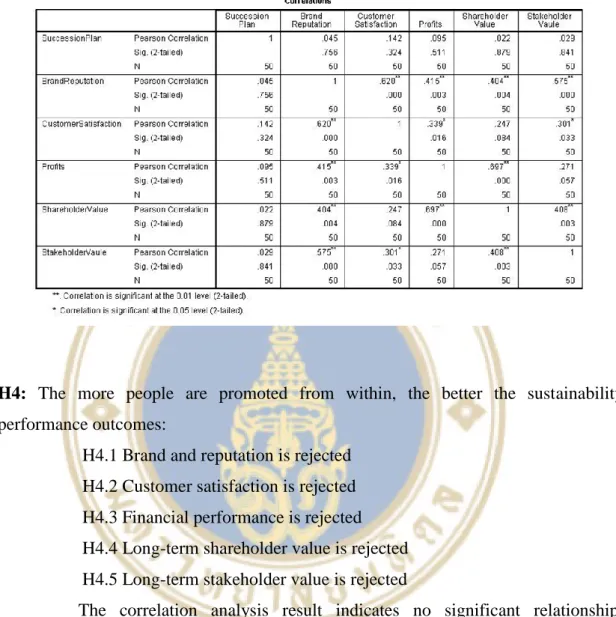
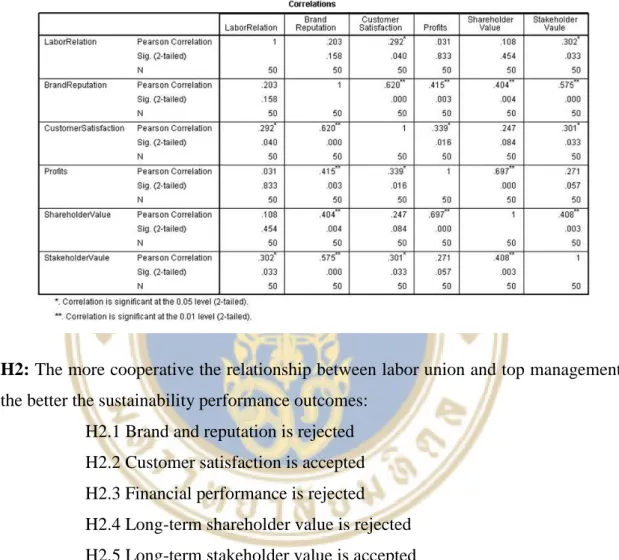
H2.1 Brand and reputation are rejected H2.2 Customer satisfaction is accepted H2.3 Financial performance is rejected H2.4 Long-term shareholder value is rejected H2.5 Long-term stakeholder value is accepted. H3.1 Brand and reputation are rejected H3.2 Customer satisfaction is accepted H3.3 Financial performance is rejected H3.4 Long-term shareholder value is rejected H3.5 Long-term stakeholder value is rejected. H4.1 Brand and reputation are rejected H4.2 Customer satisfaction is rejected H4.3 Financial performance is rejected H4.4 Long-term shareholder value is rejected H4.5 Long-term shareholder value is rejected.
H5.1 Brand and reputation are rejected H5.2 Customer satisfaction is rejected H5.3 Financial performance is rejected H5.4 Long-term shareholder value is rejected H5.5 Long-term stakeholder value is rejected. H7.1 Brand and reputation are rejected H7.2 Customer satisfaction is accepted H7.3 Financial performance is rejected H7.4 Long-term shareholder value is rejected H7.5 Long-term stakeholder value is rejected. H8.1 Brand and reputation are rejected H8.2 Customer satisfaction is rejected H8.3 Financial performance is rejected H8.4 Long-term shareholder value is rejected H8.5 Long-term stakeholder value is rejected.
H9.1 Brand and reputation are accepted H9.2 Customer satisfaction is accepted H9.3 Financial performance is rejected H9.4 Long-term shareholder value is accepted H9.5 Long-term stakeholder value is rejected. H11.1 Brand and reputation are rejected H11.2 Customer satisfaction is accepted H11.3 Financial performance is accepted H11.4 Long-term shareholder value is rejected H11.5 Long-term stakeholder value is rejected. H12.1 Brand and reputation are rejected H12.2 Customer satisfaction is rejected H12.3 Financial performance is rejected H12.4 Long-term shareholder value is rejected.
H13.1 Brand and reputation are rejected H13.2 Customer satisfaction is accepted H13.3 Financial performance is rejected H13.4 Long-term shareholder value is rejected H13.5 Long-term stakeholder value is rejected. H15.1 Brand and reputation are rejected H15.2 Customer satisfaction is rejected H15.3 Financial performance is rejected H15.4 Long-term shareholder value is rejected H15.5 Long-term stakeholder value is rejected. H16.1 Brand and reputation are rejected H16.2 Customer satisfaction is rejected H16.3 Financial performance is rejected H16.4 Long-term shareholder value is rejected H16.5 Long-term stakeholder value is rejected.
H17.1 Brand and reputation are rejected H17.2 Customer satisfaction is rejected H17.3 Financial performance is rejected H17.4 Long-term shareholder value is rejected H17.5 Long-term stakeholder value is rejected. H18.1 Brand and reputation are accepted H18.2 Customer satisfaction is accepted H18.3 Financial performance is rejected H18.4 Long-term shareholder value is rejected H18.5 Long-term stakeholder value is rejected. H19.1 Brand and reputation are rejected H19.2 Customer satisfaction is accepted H19.3 Financial performance is rejected H19.4 Long-term shareholder value is rejected H19.5 Long-term stakeholder value is rejected.
H22.1 Rejected brand and reputation H22.2 Rejected customer satisfaction H22.3 Rejected financial performance H22.4 Rejected long-term shareholder value H22.5 Rejected long-term stakeholder value. H23.1 Brand and reputation accepted H23.2 Customer satisfaction accepted H23.3 Financial performance rejected H23.4 Long-term shareholder value rejected H23.5 Stakeholder long-term value rejected.
RECOMMENDATIONS AND CONCLUSION
RECOMMENDATIONS
CONCLUSION
Sooksan Kantabutra, 2011, "Sustainability Management in a Health Care Provider in Thailand", International Journal of Health Care Quality Assurance, Vol. 21, no. 1, pp. 67-80. Sooksan Kantabutra, 201), "Sweet Success Beyond the Triple Bottom Line: Honeybee Practices Lead to Sustainable Leadership at Thailand's True Corp", Global Business and Organizational Excellence, pp.22-39. Sooksan Kantabutra and Molraudee Saratun, 2013, "Sustainability Management: Bee Practices at Thailand's Oldest University", International Journal of Educational Management, Vol.
APPENDICES