i
รายงานวิจัยฉบับสมบูรณ์
Exploring of Residents’ Perceptions on the Impacts of Sporting Events การศึกษาการรับรู้ของผู้อยู่อาศัยต่อผลกระทบของการจัดงานแข่งขันกีฬา
โดย
รองศาสตราจารย์ ดร.นพมาศ สุวชาติ
คณะบริหารธุรกิจและการบัญชี
มหาวิทยาลัยขอนแก่น
พ.ศ. 2561
i
Title of research: Exploring of Residents’ Perceptions on the Impacts of Sporting Events ชื่อโครงการวิจัย : การศึกษาการรับรู้ของผู้อยู่อาศัยต่อผลกระทบของการจัดงานแข่งขันกีฬา
ผู้รับผิดชอบโครงการ รศ.ดร.นพมาศ สุวชาติ (หัวหน้าโครงการ)
คณะบริหารธุรกิจและการบัญชี มหาวิทยาลัยขอนแก่น หน่วยงาน คณะบริหารธุรกิจและการบัญชี มหาวิทยาลัยขอนแก่น
123 ถนนมิตรภาพ ต าในเมือง อ าเภอเมือง จังหวัดขอนแก่น 40002 โทรศัพท์ 043 202401 โทรสาร 043 202402
ประเภทการวิจัย การวิจัยพื้นฐาน (Basic Research)
การวิจัยเชิงพรรณนา (Descriptive research) การวิจัยเชิงคุณภาพ (Qualitative research)
ii ABSTRACT
The purpose of this research was to focus on measuring sporting events performance against positive and negative impacts. In this study, perceptions were measured through a two-page self-completed questionnaire written in Thai, administered to a sample of 400 residents of the district of Bangkapi (population 67,931 members) in Bangkok, Thailand. Resident questionnaires were distributed within 2 months, August – October 2017. The questionnaire comprised 27 questions. The first part aimed to identify awareness of event being staged. The second part contained 2 Open ended questions designed to find out how sporting event effect community, positive and negative impacts, with 8 items measure of residents’ perceptions of impact. These items related to personal quality of life, quality of life of community, sense of community and community pride. The final part included questions relate to involvement characteristics of respondents; attend sporting events in year 2017 or previous years, level of interest in event, type of involvement in event by respondent or household member, distance from house, and socio-demographic data. Once collected, all data were entered into SPSS version 15.0 for further analysis. Descriptive statistics were used to describe the subjects and the perceived impacts of sporting events. Because of qualitative approach, the findings were described the central position of a frequency distribution for a group of data by mode. Mode is the number that occurs most often in a set of numbers. The results presented by descriptive with percentage in the form of tables, and text. We found both positive and negative impacts of sporting events performance on the community. The findings were identified as seven main positive impacts and six main negative impacts. These impacts related to economic, social and environmental of the community. The directions for future sporting events research on environmental studies:
impact and evaluation studies including: sustainability and greening of sporting events such as reducing garbage. More research on consequences of sporting events effect local culture community.
Keywords: Sporting, Event, Impact, Social, Economic, Environmental
iii PREFACE
This research presents the impacts of sporting events. It aims to investigate perceptions of people who live around The Rajamangala National Stadium regarding sporting events impact on the community. The purpose of this research is to focus on measuring sporting events performance against positive and negative impacts The Rajamangala National Stadium is the national stadium of Thailand and the home stadium for the Thailand national football team. It is part of the Hua Mak Sports Complex, and is located in Hua Mak Subdistrict, Bang Kapi, Bangkok. This research, conducted and supported by Faculty of Business Administration and Accountancy, Khon Kaen University.
Grateful acknowledgement is here made to those who helped this researcher gather data for this project. This work would not have reached its present form without their invaluable help.
Associate Professor Noppamash Suvachart (D.B.A.) January, 2018
iv
ACKNOWLEDGMENTS
Grateful acknowledgement is here made to Faculty of Business Administration and Accountancy, Khon Kaen University. This work would not have reached its present form without their supports.
v
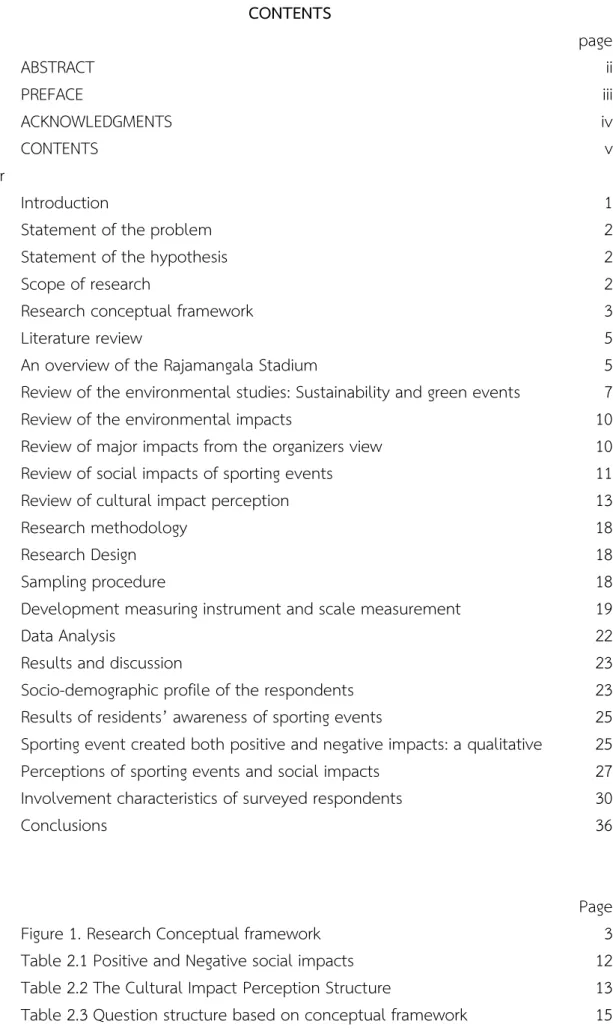
CONTENTS
page
ABSTRACT ii
PREFACE iii
ACKNOWLEDGMENTS iv
CONTENTS v
chapter
1 Introduction 1
Statement of the problem 2
Statement of the hypothesis 2
Scope of research 2
Research conceptual framework 3
2 Literature review 5
An overview of the Rajamangala Stadium 5
Review of the environmental studies: Sustainability and green events 7
Review of the environmental impacts 10
Review of major impacts from the organizers view 10
Review of social impacts of sporting events 11
Review of cultural impact perception 13
3 Research methodology 18
Research Design 18
Sampling procedure 18
Development measuring instrument and scale measurement 19
Data Analysis 22
4 Results and discussion 23
Socio-demographic profile of the respondents 23
Results of residents’ awareness of sporting events 25 Sporting event created both positive and negative impacts: a qualitative approach 25 Perceptions of sporting events and social impacts 27 Involvement characteristics of surveyed respondents 30
5 Conclusions 36
Page
Figure 1. Research Conceptual framework 3
Table 2.1 Positive and Negative social impacts 12
Table 2.2 The Cultural Impact Perception Structure 13 Table 2.3 Question structure based on conceptual framework 15
vi
Table 3.1 Social Survey Instrument Items 20
Table 4.1 Frequency Distribution Based on Age 24
Table 4.2 Frequency Distribution Based on Gender 25
Table 4.3 Frequency Distribution Based on Awareness of sport event news
25 Table 4.4 Frequency Distribution Based on personal quality of life 27 Table 4.5 Frequency Distribution Based on personal quality of life
impact level
27 Table 4.6 Frequency Distribution Based on quality of life of community 28 Table 4.7 Frequency Distribution Based on quality of life of community
impact level
28 Table 4.8 Frequency Distribution Based on sense of community 29 Table 4.9 Frequency Distribution Based on sense of community impact
level
29 Table 4.10 Frequency Distribution Based on community pride 30 Table 4.11 Frequency Distribution Based on community pride impact
level
30 Table 4.12 Involvement characteristics of surveyed respondents 32
Table 5.1 Positive and Negative social impacts 37
1 Chapter 1 INTRODUCTION
There is growing realization that present material consumption and waste generation levels are persevering a various impact on the environment, a situation that scientists dread might explain term for people’s ultimate survival. Scientists discuss that the ecological footprint of people through resource harvesting and waste generation far exceeds the carrying capacity of the world (Wackernagel and Rees, 1996). Increasing populations and a consistent escalate in the use of fossil fuels have effected in substantial rise in greenhouse gases that are responsible for global warming. A general consensus is thus emerging that conventional approaches to economic development are likely to diminish the ability of current and future generations to meet their social, economic, and environmental needs. One of the reasons why so little has been done to stop climate change is that everyone makes an exception for themselves. We can all agree, for example, there are too many cars on the roads, while insisting that we cannot possibly leave ours at home. The same problem applies to businesses: the people who run them might agree that collective action urgently needs to be taken, but unfortunately their sector is just too important and its requirements too demanding. This seems to be the prevailing ethos at the moment in sport. Some sports are simply incompatible with any likely solution to the problem. The most obvious example is motor racing. There is a direct relationship between and engine’s performance and the amount of greenhouse gases it produces: the faster the car, the quicker it cooks the planet. At the moment, there is no foreseeable means by which a racing car’s emissions can be brought down by 90 per cent within the necessary time frame. Biodiesel currently causes more harm to people and the environment than good, as it pushes up food prices and encourages the felling of tropical forests. One day – perhaps in 20 or 30 years – racing cars might run on hydrogen or electricity. Unfortunately, that’s too late: the major cuts have to be made right now. We may think that football is spontaneously harmless cause major environmental effects, but it is major crowd pullers. As a result, mainstreaming sustainability issues into their sporting events has become a major issue of environmental concern. Because of sporting event is set in the physical environment and is bound to have effects on it and be affected by it. The roots of global environmental issues are to be found in local environmental conditions and in this context the interaction of the sporting communities with the environment within which its activities are performed needs to be analyzed. There is a two-way relationship between sporting event and environment. Consequently, it can be assumed that sporting events will generate different type of impacts, and probably not only those effects related to the
2
theme or type of event. For example, a business event may generate not only economic impacts, but also social and cultural impacts.
Statement of the Problem
The impact of environment on sporting event is more palpable and direct which influences the scheduling of certain sporting events according to the suitability of the climate and the physical environment of the particular place. Global Warming has an unmistakable potential of having a long-term negative impact on sports in general and winter sports in particular. However, the focus of this research is on the social, economic, and environmental aspect. Based on the importance and problems mentioned above.
The research project aims to investigate perceptions of people who live around The Rajamangala National Stadium regarding sporting events impact on the community. The Rajamangala National Stadium is the national stadium of Thailand and the home stadium for the Thailand national football team. It is part of the Hua Mak Sports Complex, and is located in Hua Mak Subdistrict, Bang Kapi, Bangkok.
Statement of the Hypothesis
There are impacts of sporting events performance on the community. It may be positive or negative impacts, including relate to economic, social and environmental of the community.
Scope of Research Content scope
The scope of content focused on measuring sporting events performance against positive and negative impacts, including economic, social and environmental aspects.
Population scope
Researcher explored and collected data from people who live around The Rajamangala National Stadium, Huamark, Bangkapi District, Bangkok.
Research area
Huamark, Bangkapi District, Bangkok
The scope of research were in the fields of Hospitality and Event Management as in the following :
Sustainable Event Management
Event Planning and Management
Hospitality and Customer Satisfaction
3
Hospitality Management
Marketing and Service Quality Management Research Conceptual framework
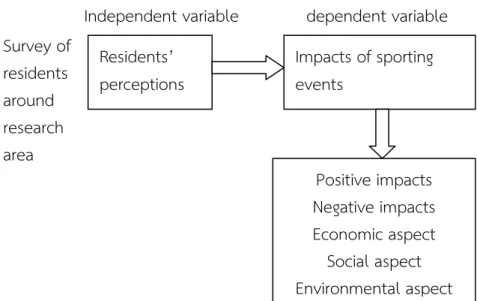
This research project has framed the research concept as follows:
Independent variable dependent variable
Figure 1. Research Conceptual framework
Benefits are expected to receive
The aim of this research is to develop a comprehensive broad-based assessment of events. Rather than being in the form of a sustainability assessment, however, a social, economic, environmental approach is proposed, which allows for the development of a framework that incorporates the economic, social and environmental impacts of events.
In order for this to be achieved, a set of event specific indicators needs to be developed, which can be integrated into an holistic framework so that an overall measure of the impact of an event can be established. This will facilitate the development of standardized measures for the evaluation of events, and, additionally, allow comparisons to be made on the performance of a range of different special events. In addition, it will encourage events to be managed in a more sustainable manner and bring event evaluation in line with current business practice.
Survey of residents around research area
Residents’
perceptions
Impacts of sporting events
Positive impacts Negative impacts Economic aspect
Social aspect Environmental aspect
4
Chapter 2 LITERATURE REVIEW
The researcher reviewed the relevant literature for operating this research project as following;
1. An overview of the Rajamangala Stadium (Wikipedia, Access on May 1, 2017)
The Rajamangala National Stadium (Thai: ราชมังคลากีฬาสถาน; RTGS: Ratchamangkhala Kila Sathan, is the national stadium of Thailand and the home stadium for the Thailand national football team. It is part of the Hua Mak Sports Complex, and is located in Hua Mak Subdistrict, Bang Kapi, Bangkok. It officially opened in 1998.
It was first used for the 1998 Asian Games in 1998 and 1999 ASEAN University Games in 1999. Since then, it has been used for many international matches and football tournaments. Most notably, for the 2007 AFC Asian Cup. Thai club sides have also used the stadium when playing in continental cup competitions. Krung Thai Bank FC (now Bangkok Glass FC) used it for AFC Champions League matches, and PEA FC and Chonburi FC have recently used it in the AFC Cup. Aside from football, it has been used for athletics, pop concerts and political rallies.
Rajamangala Stadium was designed by the Faculty of Architecture at Chulalongkorn University. The main material used in construction was concrete and therefore, though the stadium is impressive and imposing, it could never be described as beautiful. However, it is undoubtedly dramatic. The stands rise and fall like a giant, exaggerated version of Huddersfield's Galpharm Stadium. At each end are quite narrow tiers of seats but the tiers rise and rise as they move round the sides until they peak level with the half-way line. From an aesthetic point of view, the stadium is best viewed from a distance, preferably from the air, where the elliptical shape of the side tribunes seems particularly pronounced.
5
The aforementioned side tribunes are designated 'East' and 'West'. 'East' is the uncovered popular side; 'West' is the covered side where the more expensive seats are.
The two ends are designated 'North' and 'South'. 'North' is the more popular of the two.
It's where the more vocal and colourful elements of the Thai support congregate.
The capacity of the stadium is 65,000. When the stadium first opened the capacity was 80,000. But plastic seats were installed on the North, South and East sides, where previously there had been bare concrete steps, in readiness for the 2007 AFC Asian Cup.
The stadium is not served by public transport which has always been a source of frustration for fans. No Bangkok Skytrains, subway-trains or normal over ground trains stop anywhere near the stadium (unlike at the Suphachalasai Stadium, which is served by the Skytrain - National Stadium Station). However, there are buses and taxis which pass fairly close to the stadium. But in 2010 Suvarnabhumi Airport Link was completed which means that the stadium is served by the City Line at - Ramkhamhaeng Station.
The stadium hosted the 2012 Race of Champions.
On 24 November 2013, a crowd estimated at 100,000 joined the rally around Bangkok's Democracy Monument in an anti-government protest, according to the Democrat Party, as pro-government red shirts gathered at Rajamangala Sports Stadium.
Other stadiums in Bangkok include the Thai Army Sports Stadium, the Thai- Japanese Stadium and Chulalongkorn University Stadium.
Rajamangala National Stadium ราชมังคลากีฬาสถาน
Full name Rajamangala National Stadium Location Bang Kapi, Bangkok, Thailand Coordinates 13°45′20″N 100°37′20″E Public transit ARL Ramkhamhaeng Station
MRT Rajamangala Stadium (from 2020) Owner Sports Authority of Thailand (SAT) Operator Sports Authority of Thailand (SAT)
Capacity 49,722 (all seated)
6
Surface Grass
Construction
Opened 1998[1]
Architect Faculty of Architecture, Chulalongkorn University Tenants
Thailand national football team (1998–present) 1998 Asian Games
1999 ASEAN University Games 2007 Summer Universiade
2. Review of the environmental studies: Sustainability and green events
Events and the environment began to receive some interest from researchers, such as Sherwood (2007). Sherwood interested in sustainable development agenda. The sustainable development is underpinned by the recognition that there are limits to the capacity of the earth to cope with unimpeded economic growth. Businesses, due to their power and reach, are seen as major users of natural, human and financial capital resources. Granted a societal license to operate, businesses are under increasing pressure from a diverse range of internal and external stakeholders, who expect a higher level of accountability and transparency in regard to economic, social and environmental performance measurement. In response, businesses have incorporated practices such as eco-efficiency and corporate social responsibility, and an increasing number are now moving towards a more holistic evaluation of their triple bottom line (TBL) performance.
In contrast, the special events industry has continued to rely on traditional economic measures of performance. There has been tremendous growth in the number of special events being staged in tourism destinations. Events have been used strategically to bring
‘new’ money into regions, promote economic development and to showcase destinations to potential visitors. As a result of these economic imperatives, the evaluation of events has predominantly been undertaken from a narrow economic perspective. This approach, however, fails to account for the impact of the event on the host community as well as the impact on the natural environment such as water and energy use and waste generation. Since the 1980’s, event researchers have called for a broad-based evaluation model that incorporates economic, social and environmental measures. Recently, a number of these researchers have suggested that a TBL approach has merit as a potential framework. What has been lacking, however, is a set of standardized measures that would underpin a broad-based evaluation model. Therefore, the aim of this research is to develop a set of standardized TBL indicators, which would
7
enable a parsimonious TBL evaluation model to be established. A seven-step indicator development process was used to underpin this research, based on a number of collaborative projects that developed indicators to measure sustainable Abstract A TBL Evaluation of the Impact of Special Events v development. Within this framework, there were a number of research stages. Initially, a comprehensive analysis of 224 academic event evaluation publications and 85 actual event impact assessments was undertaken.
The aim was to understand what impacts have been used in event evaluations from academic and practical perspectives. From these 309 sources, a list of the 20 key impacts was derived. The second stage of the research was a three-round, modified Web-based Delphi survey of event experts. The aim was to use the opinions of the event experts to develop a pool of indicators to measure the key impacts. A total of 24 indicators was proposed by the experts to measure the impacts. A conceptual model was developed, which detailed the event drivers, the event inputs, the event outcomes, and the TBL indicators. The model also included a TBL evaluation, which included overall measures for the economic, social and environmental impacts. A number of possible models were discussed, which enable a number of TBL indicators to be integrated to allow an overall event ‘score’ to be achieved. After a subset of the indicators was selected, the third stage of the study involved the conduct of two special event case studies. The objective of this stage was to operationalise the indicators in order to test their appropriateness for inclusion in a TBL evaluation model. The case studies used intercept surveys of event attendees, competitors and exhibitors to gather economic data, mail-out surveys of local residents to gauge the social impacts and the collection of a range of environmental data from event venues and attendees. Whilst the economic and social data were readily captured via the surveys, not all environmental data were available, mainly due to the regional setting of one of the events, where there was limited capacity for capturing data.
Following this, the fourth major stage of the research involved consultations with a small number of project stakeholders in order to obtain feedback on the indicators used and the results of one of the case studies. In general, the stakeholders were supportive of both the direction of the research and the use of the TBL indicators to evaluate the impact of events.
A TBL evaluation will broaden the evaluation criteria for events and bring the events industry in line with the wider business community. There is a growing recognition in the tourism literature that, particularly with transportation, the tourism industry is a major contributor to greenhouse gas emissions. Therefore, inclusion of environmental measures will provide a clearer picture of the environmental footprint of an event.
Moreover, inclusion of the measures of the impact of events on the quality of life of the host community may provide information that assists event organizers to retain the license to stage an event, which is granted by the event stakeholders. A further benefit of
8
a TBL evaluation is that it will enable a comparison to be made of a range of different events, which will aid tourism organizations and event stakeholders in the decision- making process about which events merit support. As a result, it will be possible to manage events in a more sustainable manner. Whilst this study contributed to the development of a TBL evaluation, further research is required to integrate the indicators into a framework that can provide an overall ‘score’ for an event, which can then be compared with other events.
Harris and Huyskens (2002) published paper that manipulate with the environmental impacts of events. They focused on negative impacts of events and attampted to introduce some balance into this area by addressing the roles events can potentially play in progressing broader community goals associated with environmentally sustainable development. Specifically, this paper begined by examining the relationship between events and ecological sustainability, highlighting the key role of the Olympic Movement in this regard. Then moved on to identify key forces that were acting to lead events down this path. Following on from this discussion the issue of how public events had responded to the challenge of ecological sustainability were be addressed. This paper concluded by arguing that events had little choice but to increasing move towards the adoption of more environmentally gentle practices, and that a number were already leading the way in this regard.
Concomitantly, there have been a growing number of studies investigating the impact of events on the physical attributes of a host destination and in particular, the greening of events (Getz, 2009) and associated issues pertaining to the adoption of environmentally friendly practices, and the management processes necessary to accomplish reduction of waste and of the event’s overall ecological footprint. The increasing dominance of this view encouraged the development of the triple bottom line approach to event evaluation (Fredline et al., 2001: Sherwood, 2007) and, it is within this context that research focusing on event sustainability has gained traction (Hede, 2007) 3. Review of the environmental impacts
Guizzardi, Andrea; Mariani, Marcello; Prayag, Girish, (2017) examined residents’
perceptions of environmental impacts and certification for the Milan World Expo 2015 as well as their overall attitude toward the mega-event. They found that residents perceived the the Expo will have minimal negative and positive environmental impacts. A minority of residents were aware of the environmental certification of the event. The less agreeable residents were with the perceived negative environmental impacts of the event, the more agreeable they were that a certification of event sustainability should limit the damage to the natural environment. Residents’ perceptions of the certification were positively related to their overall attitude toward the event.
9
4. Review of major impacts from the organizers view
Philip Xie and Andy Sinwald (2016) investigated the perceived impact of special events hosted by Parks and Recreation Departments’ event organizers along the shore of Lake Erie in the state of Ohio, USA. They used qualitative data collected from an in-depth interview process. The purpose of their research focus the major impacts and how to the organizers measure and event’s success. They found that the special events creating a positive experience and encouraging community involvement, bringing the community together, producing economic benefits for local businesses, and creating socializing and educational opportunities for visitors were the foremost impacts anticipated by interviewed event organizers. Specifically, the special events providing a positive experience, and creating community cohesion. There were a few limitations; the study presented a relatively small sample, their findings might relate to the institutions located along Lake Erie where parks and recreation had long been viewed as an integral part of community life. Their research represented a first attempt to complement the quantitative data in the former research with a qualitative study. Through in-depth interviews,
5. Review of social impacts of sporting events
Higham (1999), Fredline (2005), Preuss and Solberg (2006), Ohmann et al. (2006), and Bull and lovell (2007) have all identified social impacts that might occur as resultants of sporting events. Higham did not present any positive social impacts of sport events, recommending they were mostly negative. Different from all other authors recognized positive social impacts in addition to the negative impacts. Incidentally, Fredline (2005), Ohmann et al. (2006), and Bull and Lovell (2007) explored sense of community as a positive impact, while poor fan behavior (Fredline, 2005; Higham, 1999; Ohmann et al., 2006) and crime (Ohmann et al., 2006; Preuss and Solbeg, 2006) were viewed as negative impacts. In terms of categories of events and sites investigated in these researchs, Higham (1999) discussed mega-events, Ohmann et al. (2006) considered a mega-event (FIFA World cup) in a large city (Munich, Germany, population 1.28 million), Bull and Lovell (2007) studied one leg of mega-event (Tour de France) in a small city (Canterbury, England, UK, population 150,000), Preuss and Solberg (2006) contrasted secondary data on five different events (Olympics, FIFA World Cup, EURO, Rugby World Championship, and Nordic World Ski Championships), Whilst Fredline (2005) reviewed residents’
perceptions at three different events (Australian Formula One Grand Prix, Australian Open Tennis Tournament, and Rugby World Cup).
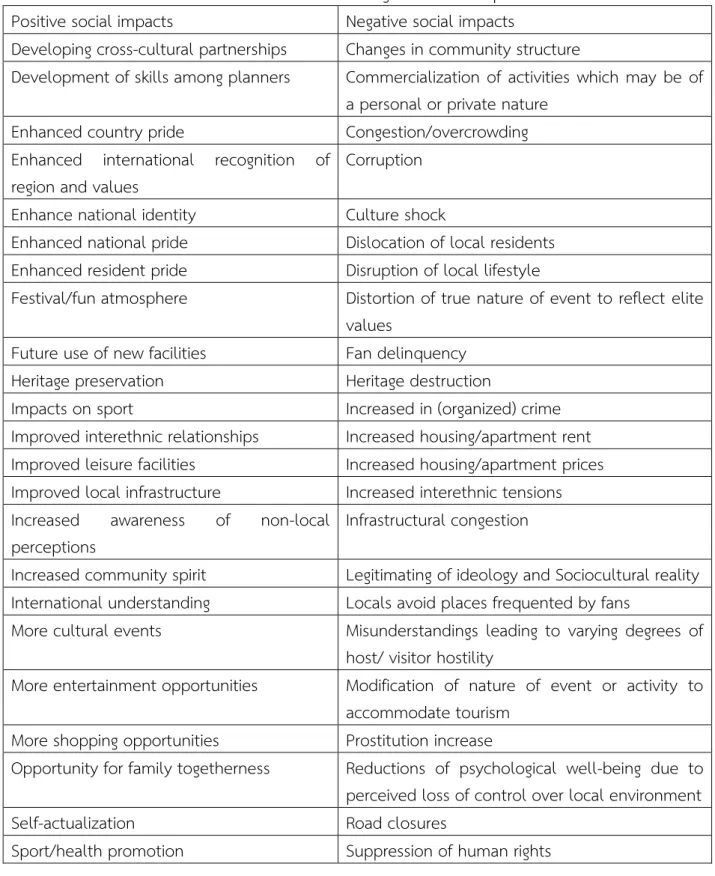
Higham (1999), Fredline (2005), Preuss and Solberg (2006), Ohmann et al. (2006), and Bull and lovell (2007) have all identified social impacts that might occur as resultants of sporting events, and these are summarized in Table 2.1.
10
Table 2.1 Positive and Negative social impacts Positive social impacts Negative social impacts
Developing cross-cultural partnerships Changes in community structure
Development of skills among planners Commercialization of activities which may be of a personal or private nature
Enhanced country pride Congestion/overcrowding Enhanced international recognition of
region and values
Corruption Enhance national identity Culture shock
Enhanced national pride Dislocation of local residents Enhanced resident pride Disruption of local lifestyle
Festival/fun atmosphere Distortion of true nature of event to reflect elite values
Future use of new facilities Fan delinquency Heritage preservation Heritage destruction
Impacts on sport Increased in (organized) crime
Improved interethnic relationships Increased housing/apartment rent Improved leisure facilities Increased housing/apartment prices Improved local infrastructure Increased interethnic tensions Increased awareness of non-local
perceptions
Infrastructural congestion
Increased community spirit Legitimating of ideology and Sociocultural reality International understanding Locals avoid places frequented by fans
More cultural events Misunderstandings leading to varying degrees of host/ visitor hostility
More entertainment opportunities Modification of nature of event or activity to accommodate tourism
More shopping opportunities Prostitution increase
Opportunity for family togetherness Reductions of psychological well-being due to perceived loss of control over local environment
Self-actualization Road closures
Sport/health promotion Suppression of human rights
11
Strengthening of local values and traditions Tendency toward defensive attitudes concerning host region
Unique/interesting event Unused facilities
Use of event to legitimate unpopular decisions 6. Review of cultural impact perception
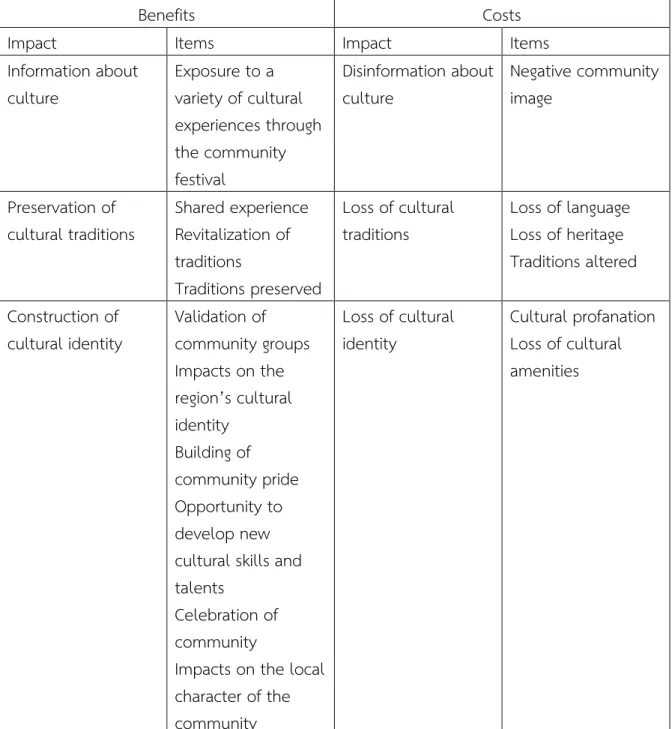
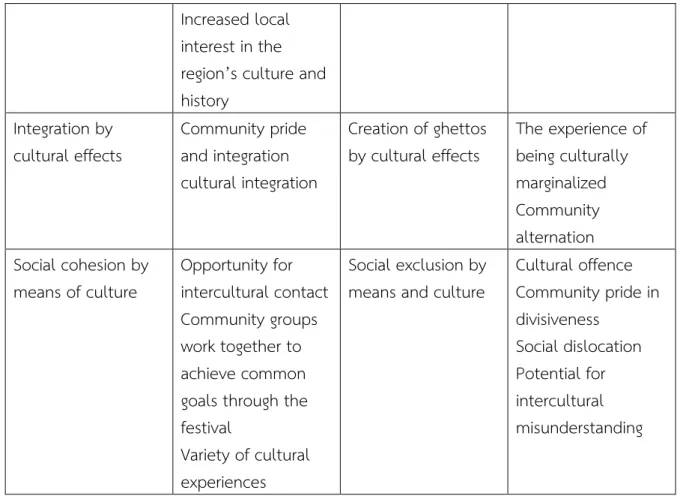
Alba Colombo (2017) explained his tool used for measuring and analysed cultural impacts generated by events. He presented the five impacts, Cultural Impact Perception (CIP), which categorized as benefits and costs (Table 2.2).
Table 2.2 The Cultural Impact Perception Structure
Benefits Costs
Impact Items Impact Items
Information about culture
Exposure to a variety of cultural experiences through the community festival
Disinformation about culture
Negative community image
Preservation of cultural traditions
Shared experience Revitalization of traditions
Traditions preserved
Loss of cultural traditions
Loss of language Loss of heritage Traditions altered Construction of
cultural identity
Validation of community groups Impacts on the region’s cultural identity
Building of community pride Opportunity to develop new cultural skills and talents
Celebration of community
Impacts on the local character of the community
Loss of cultural identity
Cultural profanation Loss of cultural amenities
12 Increased local
interest in the region’s culture and history
Integration by cultural effects
Community pride and integration cultural integration
Creation of ghettos by cultural effects
The experience of being culturally marginalized Community alternation Social cohesion by
means of culture
Opportunity for intercultural contact Community groups work together to achieve common goals through the festival
Variety of cultural experiences
Social exclusion by means and culture
Cultural offence Community pride in divisiveness
Social dislocation Potential for intercultural misunderstanding
The Cultural Impact Perception (CIP) consisted of five impacts, splited up into benefit and cost. They were related to culture aspects; cultural information; cultural traditions; cultural identity; to the capacity to acquire rights and responsibilities as well as related to the community cohesion or exclusion. In addition, he classified these cultural impacts on two levels. The first three impacts were related with culture, while the last two were related with integration and social cohesion.
From review of related literature conclude the concept of research conducted social survey Instrument items by the researcher. The instrument was based on the social indicators developed by Sherwood, P. (2007) and a set of additional questions that had previously been used surveys in event research (Higham, 1999, Harris and Huyskens, 2002, Fredline et al. 2005, Preuss and Solberg, 2006, Ohmann et al., 2006, Bull and lovell, 2007, Guizzardi, Andrea; Mariani, Marcello; Prayag, Girish, 2017). Herein, researcher determines the structure of the variables to be measured and lead to question structure and evaluation group in Table 2.3.
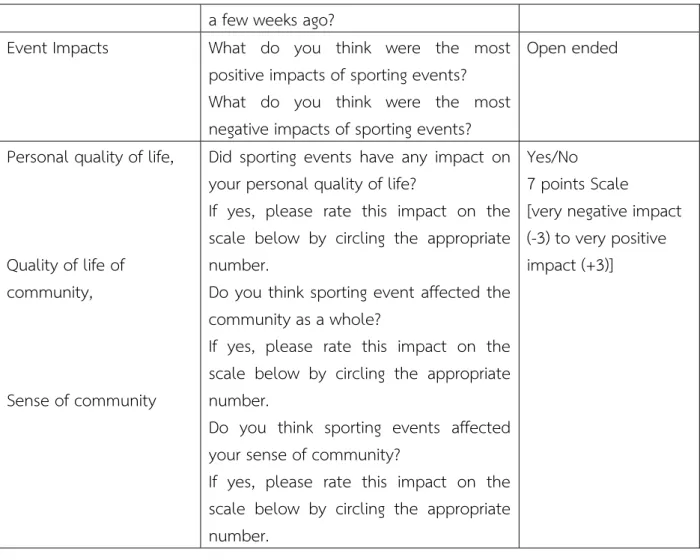
Table 2.3 Question structure based on conceptual framework
Independent variable Question structure Evaluation
Residents’ perceptions Awareness
Were you aware that Sporting events was staged at Rajamangala National Stadium
Open ended
13 a few weeks ago?
Event Impacts What do you think were the most positive impacts of sporting events?
What do you think were the most negative impacts of sporting events?
Open ended
Personal quality of life,
Quality of life of community,
Sense of community
Did sporting events have any impact on your personal quality of life?
If yes, please rate this impact on the scale below by circling the appropriate number.
Do you think sporting event affected the community as a whole?
If yes, please rate this impact on the scale below by circling the appropriate number.
Do you think sporting events affected your sense of community?
If yes, please rate this impact on the scale below by circling the appropriate number.
Yes/No
7 points Scale [very negative impact (-3) to very positive impact (+3)]
Table 2.3 Question structure based on conceptual framework(continued) Community pride Do you think sporting events affected
your pride in your community?
If yes, please rate this impact on the scale below by circling the appropriate number.
Yes/No
7 points Scale
Attendance Did you attend sporting events at Rajamangala National Stadium this year?
Have you attend sporting events at Rajamangala National Stadium in previous years?
Yes/No
Interest in event On the scale below, please indicate how interested you are in football events?
(choose one only)
5 points Scale [ avid fan(5) to no interest (1)]
Involvement Please indicate whether any of the following apply to you or to another member of your household
You/ Household member / Not applicable
14
Paid to work
Volunteer
Worked at football event (either paid or a volunteer) in previous years
Work for or own a company that is involved with football events (e.g.
supplied goods or services, sponsor)
Benefited in some way other than above (e.g. rented a property to a visitor for the football events)
Work in other events
Work in the hospitality industry
Participated in football events as a competitor
Any other involvement with football events
Proximity Distance that respondent lives from the event
Approximately how far do you live from Rajamangala National Stadium?
5 points Scale [More than 15 km (5) to Within 1 km (1)]
Demographic Gender : What is your gender?
Age : How old are you?
1= male, 2=female Open ended
15 Chapter 3
RESEARCH METHODOLOGY Research Design
This research project is basic research, exploratory research, descriptive statistics analysis with qualitative approach. The dependent variable involves measurement of residents’ perceptions impacts of sporting events performance on the community. It involves collecting data in order to answer questions concerning the impacts of sporting events on the host community. It involves assessing perceptions toward sporting events.
Descriptive data are collected through a questionnaire survey. The qualitative methods are used for this research. Qualitative method helped to identify variable involves measurement of residents’ perceptions impacts of sporting events performance among subjects. The results from the literature review synthesis in qualitative method then are used for the questionnaire design for the next stage.
This research project identify with 3 primary research questions. The following questions will be studied:
1. Are there impacts of sporting events performance on the community?
2. What type of impact, it may be positive or negative impacts?
3. What type of impact, it may be relate to economic, social or environmental of the community?
Sampling procedure
Population and Sample
Population : people around Huamark, Bangkapi District, Bangkok Sample : respondents at Huamark, Bangkapi District, Bangkok
The population used in this study is finite population. There are 67,931 people live around Huamark, Bangkapi District, Bangkok (Population statistic, Bangkapi District Office, Bangkok access online February 15 2017)
Nevertheless, simple random sampling is a probability technique for survey method, and as such, its generalizability to a larger population is limited. Due to finite population, this research is calculated the number of samples by probability sampling. To get the right size of sample enough to cite the population (Siljaru, Thanin, 2005, page 47).
The survey are collected from people who living at Huamark, Bangkapi District, Bangkok.
A total of 400 questionnaires are distributed between August - October 2017.
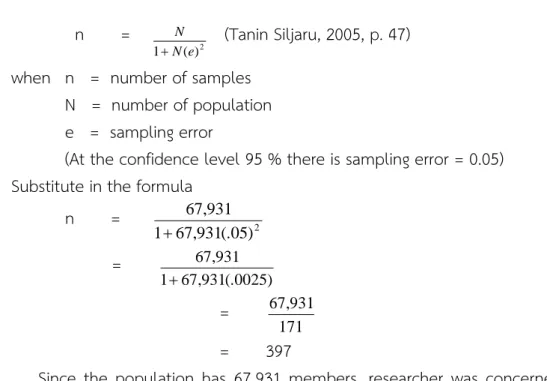
This research calculates the size of the sample when we know the population and use formula to calculate as follows. It get a reasonable sample size with sufficient refer to population.
16 n =
)2
( 1 N e
N
(Tanin Siljaru, 2005, p. 47) when n = number of samples
N = number of population e = sampling error
(At the confidence level 95 % there is sampling error = 0.05) Substitute in the formula
n = 2
) 05 (.
931 , 67 1
931 , 67
=
) 0025 (.
931 , 67 1
931 , 67
=
171 931 , 67
= 397
Since the population has 67,931 members, researcher was concerned with 400 subjects.
Development measuring instrument and scale measurement
The instrument was based on the social indicators developed by Sherwood, P.
(2007) and a set of additional questions that had previously been used surveys in event research (Harris and Huyskens, 2002, Fredline et al. 2005, Guizzardi, Andrea; Mariani, Marcello; Prayag, Girish, 2017). The reason for the use of the additional questions was that a survey that only used the four social indicators derived from this study would be too short. Additional questions not only added to the quality of the survey instrument, but also allowed for some of the other social issues to be addressed such as the level of community involvement in the event. Table 3.1 reveals the key items that were contained in the survey instrument.
Table 3.1 Social Survey Instrument Items
Item Details
Awareness Aware of event being staged
Event Impacts Open ended questions about positive and negative impacts of event Impacts and
scale of impacts
Personal quality of life, quality of life of community, sense of community and community pride
Attendance Attendance at current or previous football events Interest in event Level of interest in event
Involvement Type of involvement in event by respondent or household member
17
Proximity Distance that respondent lives from the event Demographic Gender and Age
Pilot Testing
The survey instrument that will be used for the study is pilot test amongst a convenience sample of event and non-event respondents. The researcher selected a convenient sample of 50 regular students enrolled in hospitality and event management of Khon Kaen University for testing in the process of analyzing the questions and qualitative approach were used to analyze and corrected the items in the scale. After pilot testing, it will be collected data from the sample group by using description questionnaire as follows:
Survey of residents on the impacts of sporting events at Rajamangala National Stadium 1. Were you aware that Sporting events was staged at Rajamangala National
Stadium a few weeks ago?
2. What do you think were the most positive impacts of sporting events?
3. What do you think were the most negative impacts of sporting events?
4. Did sporting events have any impact on your personal quality of life?
5. If yes, please rate this impact on the scale below by circling the appropriate number. [very negative impact (-3) to very positive impact (+3)]
6. Do you think sporting event affected the community as a whole?
7. If yes, please rate this impact on the scale below by circling the appropriate number. [very negative impact (-3) to very positive impact (+3)]
8. Do you think sporting events affected your sense of community?
9. If yes, please rate this impact on the scale below by circling the appropriate number. [very negative impact (-3) to very positive impact (+3)]
10. Do you think sporting events affected your pride in your community?
11. If yes, please rate this impact on the scale below by circling the appropriate number. [very negative impact (-3) to very positive impact (+3)]
12. Did you attend sporting events at Rajamangala National Stadium this year?
13. Have you attend sporting events at Rajamangala National Stadium in previous years?
14. On the scale below, please indicate how interested you are in football events?
(choose one only)
5 I am a avid fan of football events
4 I am interested football events and follow them when I can 3 I am not particularly interested in football events, but
football is an enjoyable experience
2 I am not interested in football event but I sometimes attend or watch because family/friends are interested
18
1 I have absolutely no interest in football events
15. Please indicate whether any of the following apply to you or to another member of your household (choose all that apply)
Paid to work at football event this year You Household member Not applicable Volunteered at football event this year You Household member Not applicable Worked at football event (either paid or
a volunteer) in previous years
You Household member Not applicable Work for or own a company that is
involved with football events (e.g.
supplied goods or services, sponsor)
You Household member Not applicable
Benefited in some way other than above (e.g. rented a property to a visitor for the football events)
You Household member Not applicable
Work in other events You Household member Not applicable Work in the hospitality industry You Household member Not applicable Participated in football events as a
competitor
You Household member Not applicable Any other involvement with football
events (please state)
………
You Household member Not applicable
16. Approximately how far do you live from Rajamangala National Stadium?
5 More than 15 km 4 11-15 km
3 6-10 km 2 1-5 km 1 Within 1 km 17. What is your gender?
2 female 1 male
18. How old are you? ……….. years Data Analysis
In this study, perceptions were measured through a two-page self-completed questionnaire written in Thai, administered to a sample of 400 residents of the district of Bangkapi (population 67,931 members) in Bangkok, Thailand. Resident questionnaires were distributed within 2 months. The questionnaire comprised 27 questions. The first
19
part aimed to identify awareness of event being staged. The second part of instrument contained 2 Open ended questions about positive and negative impacts of event and 8- item measure of residents’ perceptions of impact relate to personal quality of life, quality of life of community, sense of community and community pride. The third and final part of the instrument included questions about attendance at current or previous football events, level of interest in event, type of involvement in event by respondent or household member, and participants’ distance, gender and age. Once collected, all data were entered into SPSS version 15.0 for further analysis. Descriptive statistics are used to describe the subjects and the perceived impacts of sport event. Because of qualitative approach, the findings are described the central position of a frequency distribution for a group of data by mode. Mode is the number that occurs most often in a set of numbers.
The results information presented by descriptive with percentage (%) in the form of tables, and text.
20 Chapter 4
RESULTS AND DISCUSSION
This chapter presents the results of data analysis. The first section describes the basic information derived from demographics data through descriptive statistics. The second section presents the results derived from residents’ awareness of sporting events, positive and negative impacts by qualitative approach, residents’ perceptions impacts of sporting events performance on the community, and characteristics of surveyed respondents related to sporting event through descriptive statistics.
The results and discussion describe 3 primary research questions. The following questions are studied:
1. Are there impacts of sporting events performance on the community?
2. What type of impact, it may be positive or negative impacts?
3. What type of impact, it may be relate to economic, social or environmental of the community?
Findings
1. Socio-demographic profile of the respondents
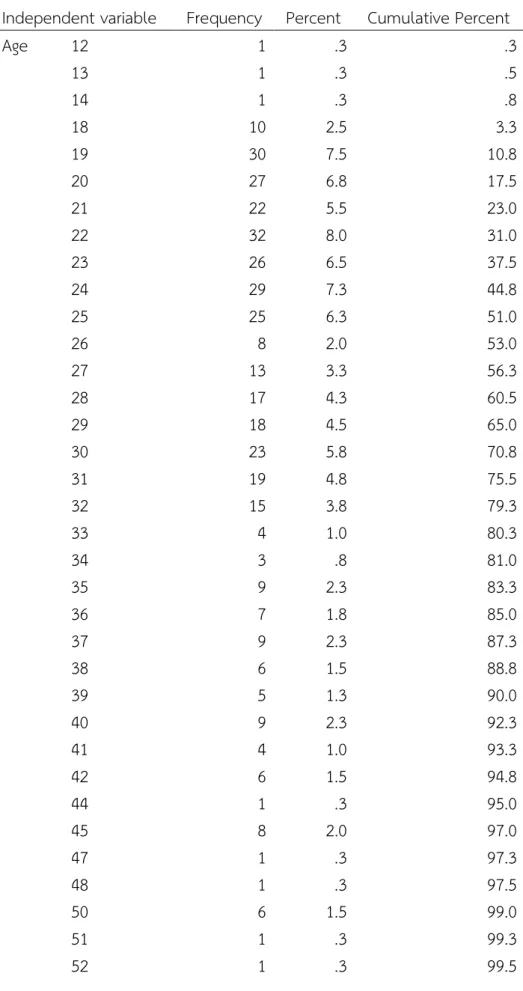
Respondents of this research are Thai people age 12 – 67 years who living at Huamark, Bangkapi District, Bangkok (Table 4.1). Since the population has 67,931 members, researcher is concerned with 400 subjects. A total of 400 questionnaires are distributed between August - October 2017. It was found that the total sample of 400 were completed (with a response rate of 100%). The vast majority of respondents, sufficient number of respondents (304 subjects) were in the age group between 19-32 years with 76 percent respondents. There were male 43 percent and female respondents 57 percent in this survey (Table 4.2).
21
Table 4.1 Frequency Distribution Based on Age
Independent variable Frequency Percent Cumulative Percent
Age 12 1 .3 .3
13 1 .3 .5
14 1 .3 .8
18 10 2.5 3.3
19 30 7.5 10.8
20 27 6.8 17.5
21 22 5.5 23.0
22 32 8.0 31.0
23 26 6.5 37.5
24 29 7.3 44.8
25 25 6.3 51.0
26 8 2.0 53.0
27 13 3.3 56.3
28 17 4.3 60.5
29 18 4.5 65.0
30 23 5.8 70.8
31 19 4.8 75.5
32 15 3.8 79.3
33 4 1.0 80.3
34 3 .8 81.0
35 9 2.3 83.3
36 7 1.8 85.0
37 9 2.3 87.3
38 6 1.5 88.8
39 5 1.3 90.0
40 9 2.3 92.3
41 4 1.0 93.3
42 6 1.5 94.8
44 1 .3 95.0
45 8 2.0 97.0
47 1 .3 97.3
48 1 .3 97.5
50 6 1.5 99.0
51 1 .3 99.3
52 1 .3 99.5
22
55 1 .3 99.8
67 1 .3 100.0
Total 400 100.0
Table 4.2 Frequency Distribution Based on Gender
Independent variable Frequency Percent Valid Percent Cumulative Percent
Gender male 172 43.0 43.0 43.0
female 228 57.0 57.0 100.0
Total 400 100.0 100.0
Results and Discussion
2. Results of residents’ awareness of sporting events
Respondents’ perceptions in terms of perceived sporting events news are presented in Table 4.3. The residents were asked: “Were you aware that Sporting events was staged at Rajamangala National Stadium a few weeks ago?” The answer was yes/no.
Table 4.3 Frequency Distribution Based on Awareness of sport event news Independent variable Frequency Percent Valid Percent Cumulative Percent
Awareness yes 218 54.5 54.5 54.5
no 182 45.5 45.5 100.0
Total 400 100.0 100.0
In relation to awareness of sport event news, 54.5 percent of respondents perceived the news and 45.5 percent did not perceive.
3. Sporting event created both positive and negative impacts: a qualitative approach The residents were asked to list the most positive impacts and negative impacts of sporting events. While not everyone gave distinct reasons, several themes emerged from the majority of the responses. The findings were identified as four main positive impacts. Whether sporting events provide a recreational opportunity for the community, they offer stadium/sporting venue and infrastructures development, this may lead to community the technological progress and better productivity in the economy of host community. Sporting events as form of entertainment; provide relaxation, bring people in the community together, people enjoy events, and good for health. Sporting events bring the economic growth to community, several economic benefits to local communities such as the visitors generated enormous economic activity through different forms of expenditure on sporting and non-sporting activities. There was an increased demand for various forms of food services and accommodation services business. As a
23
result, sporting event as well as infrastructure development promote job creation, because a lot of markets, accommodation services, entertainment facilities like concerts, art and entertainments are most likely to be created for the visitors. In addition, during the major sport events thousands of people are able to go to the hosting community to watch it. Also they can purchase hotel rooms, meals, drinks, transportation, tickets on the games or matches etc. This means that sporting event boosts the expenditure and promotes an increase in retail trade, which is very beneficial for the hosting economy.
The findings were identified as four main positive impacts; recreational, venue and infrastructures development, entertainment, and economic benefits, different from.
Fredline (2005), Ohmann et al. (2006), and Bull and Lovell (2007) explored sense of community as a positive impact.
After identifying the positive impacts, the residents were asked: “What do you think were the most negative impacts of sporting events?” The intention of this question was to ascertain the perceived impacts of sporting events as well as to distinguish these impacts, which are no previously cited in the extant literature. The findings were identified as six main negative impacts. Sporting events also results in negative impact on host community, including heavy traffic jam, inconvenient for transportation, overcrowding, disruptions in the normal life of the residents, and local community displacement. The findings were identified the negative impact of sporting event on the environment as a result of increased pollution, noise pollution, air pollution, and too much garbage. They thought sporting events effect environment, nevertheless, they did not mentioned cultural impacts. Different from Fredline (2005); Higham (1999); Ohmann et al., (2006) identified poor fan behavior and crime (Ohmann et al., 2006; Preuss and Solbeg, 2006) were viewed as negative impacts.
4. Perceptions of sporting events and social impacts
Respondents’ perceptions in terms of social impacts; personal quality of life, Quality of life of community, sense of community, community pride are presented in Table 4.4-Table 4.11. First, we explored the perception of personal quality of life variable.
The residents were asked: “Did sporting events have any impact on your personal quality of life?” After that, “If yes, please rate this impact on the scale below by circling the appropriate number. This item come with 7 points rating scale from very negative impact (-3) to very positive impact (+3). Respondents’ perceptions in terms of personal quality of life is presented in Table 4.4-Table 4.5.
Table 4.4 Frequency Distribution Based on personal quality of life Independent variable Frequency Percent
Valid Percent
Cumulative Percent Impact on personal quality of life yes 71 17.8 17.8 17.8
24
no 329 82.3 82.3 100.0 Total 400 100.0 100.0
Table 4.5 Frequency Distribution Based on personal quality of life impact level Independent variable Frequency Percent
Valid Percent
Cumulative Percent
Impact levela very negative 4 1.0 1.0 1.0
more negative 6 1.5 1.5 2.5
negative 47 11.8 11.8 14.3
neutral 341 85.3 85.3 99.5
More positive 2 .5 .5 100.0
Total 400 100.0 100.0
Note: a7 points Scale from -3= very negative impact to +3 very positive impact
In relation to personal quality of life, 82.3 percent of respondents’ agreement that sporting event have no impact on their personal quality of life, although 17.8 percent of respondents perceived impact on personal quality of their life. However, the majority of them, 85.3 percent agree that the impact on quality of life are neutral level.
Second, we explored the perception of quality of life of community variable. The residents were asked: “Do you think sporting event affected the community as a whole?”
After that, “If yes, please rate this impact on the scale below by circling the appropriate number. This item come with 7 points rating scale from very negative impact (-3) to very positive impact (+3). Respondents’ perceptions in terms of quality of life of community is presented in Table 4.6-Table 4.7.
Table 4.6 Frequency Distribution Based on quality of life of community Independent variable Frequency Percent
Valid Percent
Cumulative Percent Impact on quality of life
of community
yes 91 22.8 22.8 22.8
no 309 77.3 77.3 100.0
Total 400 100.0 100.0
Table 4.7 Frequency Distribution Based on quality of life of community impact level Independent variable Frequency Percent
Valid Percent
Cumulative Percent
Impact levela very negative 4 1.0 1.0 1.0
more 16 4.0 4.0 5.0
negative 48 12.0 12.0 17.0
neutral 325 81.3 81.3 98.3
positive 3 .8 .8 99.0
25
more 4 1.0 1.0 100.0
Total 400 100.0 100.0
Note: a7 points Scale from -3= very negative impact to +3 very positive impact
In relation to quality of life of community, 77.3 percent of respondents’
agreement that sporting event have no impact on their personal quality of life, although 22.8 percent of respondents perceived impact on quality of life of community. However, the majority of them, 81.3 percent agreed that the sporting events impact on quality of life of community are neutral level.
Third, we explored the perception of sense of community variable. The residents were asked: “Do you think sporting events affected your sense of community?” After that,
“If yes, please rate this impact on the scale below by circling the appropriate number.
This item come with 7 points rating scale from very negative impact (-3) to very positive impact (+3). Respondents’ perceptions in terms of sense of community is presented in Table 4.8-Table 4.9.
Table 4.8 Frequency Distribution Based on sense of community Independent variable Frequency Percent
Valid Percent
Cumulative Percent Impact on sense of
community
yes 66 16.5 16.5 16.5
no 334 83.5 83.5 100.0
Total 400 100.0 100.0
Table 4.9 Frequency Distribution Based on sense of community impact level Independent variable Frequency Percent
Valid Percent
Cumulative Percent Impact levela very
negative 1 .3 .3 .3
more 4 1.0 1.0 1.3
negative 40 10.0 10.0 11.3
neutral 348 87.0 87.0 98.3
positive 4 1.0 1.0 99.3
more 3 .8 .8 100.0
Total 400 100.0 100.0
Note: a7 points Scale from -3= very negative impact to +3 very positive impact
In relation to sense of community, 83.5 percent of respondents’ agreement that sporting event have no impact on sense of community, although 16.5 percent of
respondents perceived impact on sense of community. However, the majority of them,
26
87.0 percent agreed that the sporting events impact on sense of community are neutral level.
Fourth, we explored the perception of community pride variable. The residents were asked: “Do you think sporting events affected your pride in your community?” After that, “If yes, please rate this impact on the scale below by circling the appropriate number. This item come with 7 points rating scale from very negative impact (-3) to very positive impact (+3). Respondents’ perceptions in terms of community pride is presented in Table 4.10-Table 4.11.
Table 4.10 Frequency Distribution Based on community pride Independent variable Frequency Percent
Valid Percent
Cumulative Percent Impact on
community pride
yes 82 20.5 20.5 20.5
no 318 79.5 79.5 100.0
Total 400 100.0 100.0
Table 4.11 Frequency Distribution Based on community pride impact level Independent variable Frequency Percent
Valid Percent
Cumulative Percent Impact levela
very negative 2 .5 .5 .5
negative 23 5.8 5.8 6.3
neutral 343 85.8 85.8 92.0
positive 14 3.5 3.5 95.5
more 10 2.5 2.5 98.0
very positive 8 2.0 2.0 100.0
Total 400 100.0 100.0
Note: a7 points Scale from -3= very negative impact to +3 very positive impact
In relation to community pride, 79.5 percent of respondents’ agreement that sporting event have no impact on community pride, although 20.5 percent of respondents perceived impact on community pride. However, the majority of them, 85.8 percent agreed that the sporting events impact on community pride are neutral level.
5. Involvement characteristics of surveyed respondents
Respondents of this research are Thai people age 12 – 67 years who living at Huamark, Bangkapi District, Bangkok (Table 4.1). Since the population has 67,931 members, researcher is concerned with 400 subjects. A total of 400 questionnaires are distributed between August - October 2017. It was found that the total sample of 400 were completed (with a response rate of 100%). The vast majority of respondents,
27
sufficient number of respondents (304 subjects) were in the age group between 19-32 years with 76 percent respondents. There were male 43 percent and female respondents 57 percent in this survey (Table 4.2).
The final part, we explored characteristics related to sporting event variables;
attendance, level of interested in football event, involvement, and proximity/distance.
For attendance variable, the respondents were asked: “Did you attend sporting events at Rajamangala National Stadium this year?”and “Have you attend sporting events at Rajamangala National Stadium in previous years?” Yes/No question.
For interested in football event, the respondents were asked: “On the scale below, please indicate how interested you are in football events?” These items come with 5 points rating scale from avid fan (5) to no interest (1).
For involvement in sporting events, the respondents were asked: “Please indicate whether any of the following apply to you or to another member of your household or not applicable”. This item consists of nine situations as following;
1. Paid to work at football event this year 2. Volunteered at football event this year
3. Worked at football event (either paid or a volunteer) in previous years
4. Work for or own a company that is involved with football events (e.g. supplied goods or services, sponsor)
5. Benefited in some way other than above (e.g. rented a property to a visitor for the football events)
6. Work in other events
7. Work in the hospitality industry
8. Participated in football events as a competitor
9. Any other involvement with football events (please state)
For proximity/distance variable, the respondents were asked: “Approximately how far do you live from Rajamangala National Stadium?” This item comes with 5 points rating scale from more than 15 km (5), 11-15 km (4), 6-10 km (3), 1-5 km (2), and within 1 km (1).
Respondents’ involvement characteristics in terms of attendance, interest, involvement, and proximity/distance are presented in Table 4.12.
Table 4.12 Involvement characteristics of surveyed respondents
Variable Number Percent (%) Valid (%)
Gender (N=400)
male 172 43.0 43.0
female 228 57.0 57.0
Age (N=400)
28
12-19 43 10.8 10.8
20-29 217 54.3 54.3
30-39 100 25.0 25.0
40-49 30 7.5 7.5
50-59 9 2.2 2.2
60+ 1 0.2 0.2
Attendance this year (N=400)
Attend sporting event this year (yes) 117 29.3 29.3
Not attend sporting event this year (no) 283 70.8 70.8 Attendance in previous years (N=400)
Attend sporting event in previous years (yes) 136 34.0 34.0 Not attend sporting event in previous years (no) 264 66.0 66.0 Interested in football event (N=400)
absolutely no interest in football 52 13.0 13.0
no but sometimes attend or watch 81 20.3 20.3
not particularly but football is an enjoyable
experience 58 14.5 14.5
interest in and follow when I can 118 29.5 29.5
avid fan of football 91 22.8 22.8
Table 4.12 Involvement characteristics of surveyed respondents (continued)
Variable Number Percent (%) Valid (%)
Involvement in sporting events
Paid to work at football event this year (N=400)
not applicable 376 94.0 94.8
yes 11 2.7 2.0
household member 13 3.3 3.3
Volunteered at football event this year (N=400)
not applicable 383 95.8 95.8
yes 7 1.8 1.8
household member 10 2.5 2.5
Worked at football event (either paid or a volunteer) in previous years (N=400)
29
not applicable 380 95.0 95.0
yes 6 1.5 1.5
household member 14 3.5 3.5
Work for or own a company that is involved with football events (e.g. supplied goods or services, sponsor) (N=400)
not applicable 381 95.3 95.3
yes 4 1.0 1.0
household member 15 3.8 3.8
Benefited in some way other than above (e.g.
rented a property to a visitor for the football events) (N=400)
not applicable 379 94.8 94.8
yes 7 1.8 1.8
household member 14 3.5 3.5
Work in other events (N=400)
not applicable 374 93.5 93.5
yes 8 2.0 2.0
household member 18 4.5 4.5
Table 4.12 Involvement characteristics of surveyed respondents (continued)
Variable Number Percent (%) Valid (%)
Work in the hospitality industry (N=400)
not applicable 376 94.0 94.0
you 10 2.5 2.5
household member 14 3.5 3.5
Participated in football events as a competitor (N=400)
not applicable 381 95.3 95.3
yes 5 1.3 1.3
household member 14 3.5 3.5
Any other involvement with football events (N=5)
athlete 5 100 100
Proximity/distance (N=400)
within 1 km 75 18.8 18.8
1-5 km 145 36.3 36.3
6-10 km 59 14.8 14.8
11-15 km 32 8.0 8.0