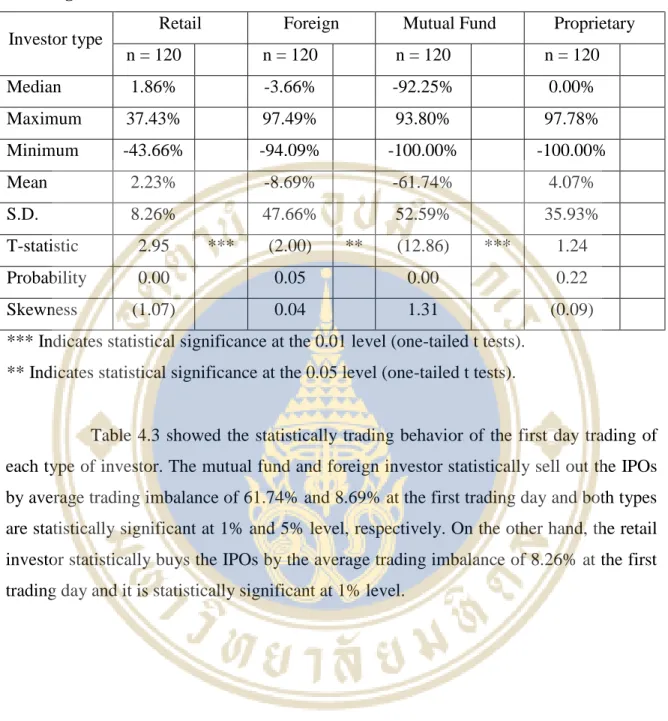
The mutual fund and the Foreign Investor are the group that sold the IPOs on the first day of trading; on the other hand, the retail investor would buy the IPOs. Some studies show the return by dividing the period into pre- and post-crisis to see the progress of the return based on the economic situation. The study in Thailand highlighted the day trading by each type of investor and then it is the motivation of my study on investor behavior and relationship with the initial return to SET listed IPOs only in its first long trading.
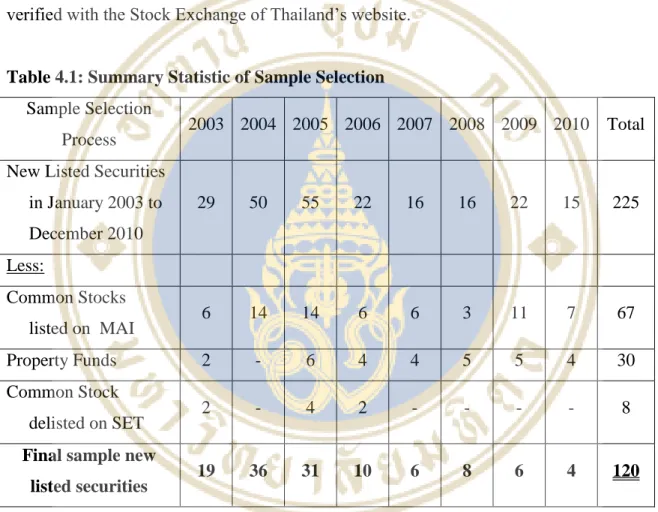
The first section describes the evidence of IPO underpricing in Thailand and other countries. The second section deals with the literature on investor trading behavior in connection with IPOs. Gounopoulos (2003) examines the initial performance of Greek IPOs and his sample consists of 225 firms listed on the Athens Stock Exchange in the period from January 1990 to December 2001.
The results show the initial return of 8.34% and the long-term market-adjusted return after the first trading date is 7.68%. The average raw initial return and the average market-adjusted initial return of 150 IPOs on the first day of trading are 20.41% and 19.96%, respectively, and are highly statistically significant at the 1% level. He also examined the raw initial return (RIR) and the market adjusted initial return (MAIR) based on the year of their listing.
First, we examine the level of short-term returns in Thailand's stock market and propose the first hypothesis as follows.
Trading behavior of investor on Initial Public Offerings Literature
The resources industry has the highest average MAIR of 44.47%, with the second highest average MAIR being the financial industry at 34.74%. Among the sample, the agri-food industry has the worst initial performance with an average market-adjusted performance of 4.56%. Under the Taiwan Stock Exchange Corporation, traders' access to the TSEC is for proprietary trading purposes only, and they effectively trade as market makers to provide liquidity.
Thus, market maker order flow will be negative (positive) when stock returns are positive (negative), implying the negative relationship. Chae and Wang (2003) prove that low transaction costs and high transaction speed can allow them to take advantage of opportunities that are not worthwhile for other market participants. The contemporaneous correlation between trader order flow and stock returns is highly positive, inconsistent with models of market maker trades and they also earn significant excess returns driven in aggregate by the informational component of profits.
Kamesaka and Wang (2004), The paper examines the short-term speculative trading performance of individual, institutional and foreign investors using daily buying and selling flows from Thailand's stock market. The results indicate that foreign investors tend to increase their net purchases (buy less sales) after a rise in stock price of several days, while individual investors in Thailand tend to increase their net purchases after a decline in the share price of a few days. The previous literature studies how the investor behavior affects or affects the return on stocks.
Furthermore, each type of investor has different backgrounds, roles and responsibilities, yet they all aim for only one goal which is high expected return, so we examine their behaviors and relationships in first trading IPOs in SET through the following hypotheses.
Long-run Performance of Initial Public Offerings Literature
Financial advisor performance based on listed stocks
THEORITICAL/CONCEPTUAL FRAMEWORK OF RESEARCH STUDY
Data
Methodology
- Raw Initial Return and Market Adjusted Initial Return Calculation Method
- One Year Performance Calculation Method
- Trading Imbalance Measured by Investor
- Regression Model
MAIRi,1= Initial market-adjusted return of company 'i' at the end of the first trading day. The raw initial return derived in the above equation (RIR) is adjusted for market changes by taking into account the movements of the Market Index between the first day of the offer and the first day of trading of the IPOs. The sample mean of the initial raw return and the mean of the market-adjusted initial return for the first trading day are represented by the RIR bar and the MAIR bar, respectively.
The average of market-adjusted initial returns can be thought of as a performance index that reflects the return, in excess of the market return on an investment, divided equally by N new issues in a sample;. This paper tests both mean of raw initial return and mean of market-adjusted initial return to compare and check results. To test hypotheses that the mean of raw initial return and mean of market-adjusted initial return for the first trading day is zero, we will use t-statistics to test these hypotheses.
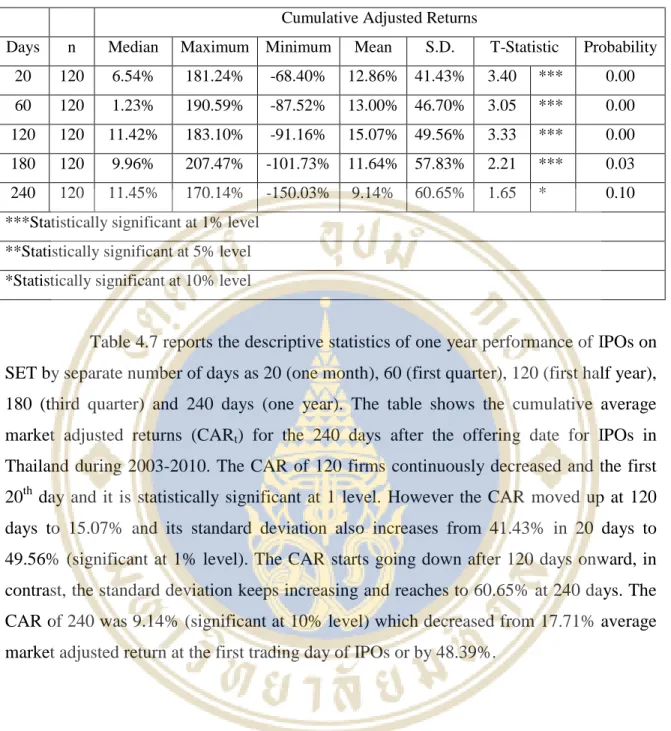
Previous research by Ritter (1991) and Corhay, Teo, and Rad (2002) use cumulative average market-adjusted returns to measure long-term performance. Before deriving the cumulative average market-adjusted return (CAR) for the IPO from day 1 to day T. Therefore, the return on day 1 is calculated from the closing price of the first trading date.
Next, the cumulative market-adjusted abnormal return is the summation of the market-adjusted returns;. Trading volume for the overall stock market is used to examine the net trading volume by each type of investor. We used the trade imbalance by investor type on each announcement date to find the impact.
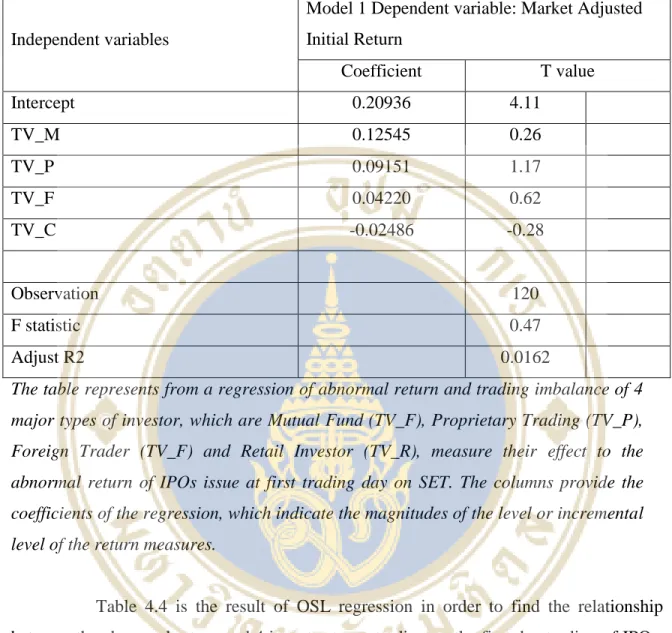
The result will be expressed as a percentage and will be used to analyze the impact of the raw initial return on the first trading date of the IPO on the SET. To examine the relationship between average market-adjusted initial returns and trading by investor type (trade imbalance).
EMPIRICAL RESULTS
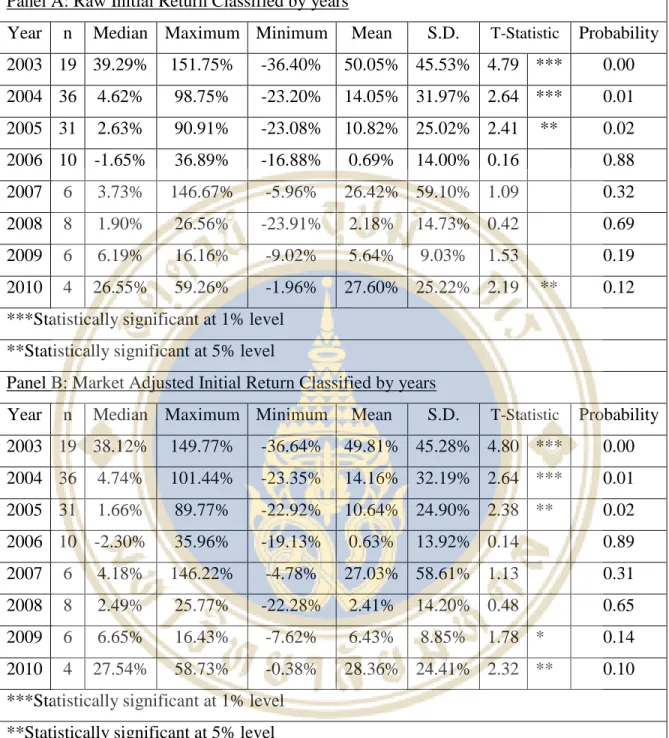
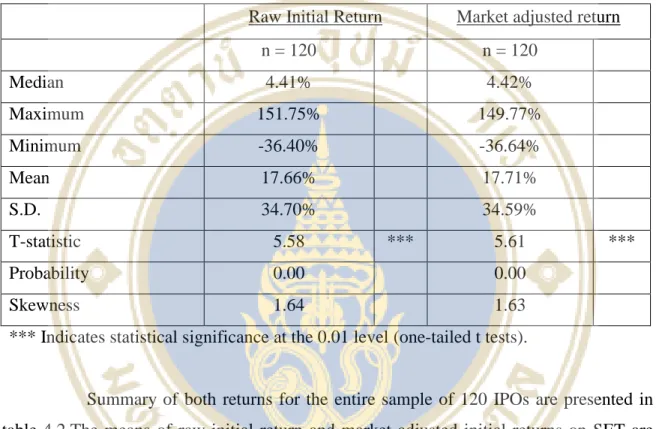
Summary of both returns for the entire sample of 120 IPOs is presented in table 4.2. The mean of raw initial return and market adjusted initial returns on SET are 17.66% and 17.71% respectively and both are statistically significant at 1% level. The standard deviations of the raw and adjusted initial returns on SET are 34.70% and 34.59%, respectively. The return on IPOs at the first day of trading is statically influenced by the performance pattern of itself which the investor sees that the initial return will increase significantly only at the first day of trading and will drop dramatically at the next period, then the investor will trade to take advantage of the first day return.
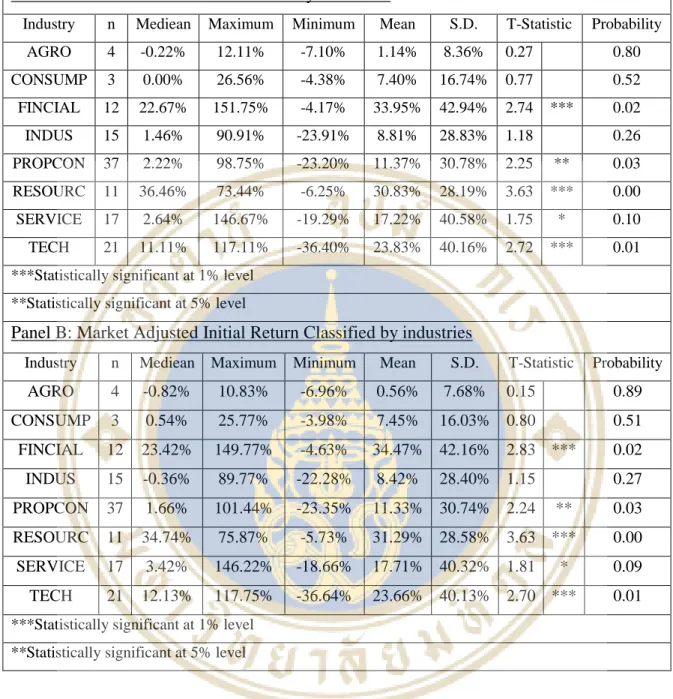
While the lowest averages for initial raw return and market-adjusted return were presented in 2009 with 9.03% and 8.85%, respectively. Means of excess returns and standard deviations of returns tend to decrease continuously in 2003 onwards, however it has increased significantly in 2007 in initial raw return at 26.41% and initial market-adjusted return at 27.03% with the highest standard deviation high at 59.10% and 58.61%, respectively. The findings show that the financial industry has the highest average initial returns and market-adjusted initial returns of 33.95% and 34.47%, respectively.
The second and third highest initial returns are resource industry at an average raw return of 30.83% and market adjusted return at 31.29% and technology industry at an average raw return of 23.83% and market adjusted return at 23.66%. Raw and market-adjusted initial returns are statistically significant at the 1% level for first. three of the highest yielding average per industry. Among the sample, the agriculture and food industry has the worst initial performance with a raw initial return of 1.14% and an average market-adjusted return of 0.56%.
In the view of standard deviation, the findings show that the financial industry also has the highest standard deviation of market adjusted performance with 42.16%. On the other hand, the agriculture and food industry has the lowest standard deviation of market-adjusted initial return of his study examined the relationship between selected factor and initial return of IPOs listed by multiple regression method. The study showed the most important specific company factors (Age, Firm size, ROA, Debt ratio, Return average of 3 years return, PE ratio, Three year PE ratio) and overall market factors (Trend of the SET index, Trend of the SETs volume ). This will affect the initial return of IPO in Thai stock market, further following company specific factors that are significant to earn initial return of IPO 1) firm size, 2) Three years PE ratio, 3) Debt ratio and 4) Return average 3 years return.
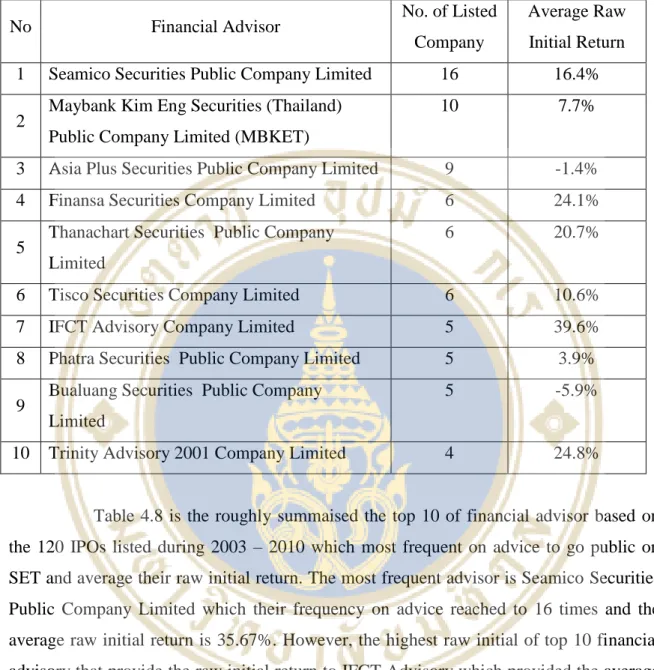
The table shows the cumulative average market-adjusted returns (CARt) for the 240 days after the offering date for IPOs in Thailand during 2003-2010. The most frequent adviser is Seamico Securities Public Company Limited, whose frequency of advice reached 16 times, and the average raw initial return is 35.67%. However, the highest raw initial of the top 10 financial advisory providing the raw initial return to IFCT Advisory, which produced the average raw initial return of 39.6%.
The highest IPO raw yield recommended by IFCT is Maybank Kim Eng Securities (Thailand) Public Company Limited at 151.75%. The lowest average raw return on financial advice is Bualuang Securities Public Company Limited at minus 5.9%, which mainly came from negative average initial raw return of DSG International (Thailand) Public Company, which is in the consumer industry at 19.87%.
CONCLUSION
Finally, the result of the performance of the financial advisor in Thailand will depend on the type of listed company they are advising. The high performance financial advice advises the listed company in the sector or industry that provides high return such as financing or resource.
Phansatan, S., (2009), The Trading Pattern and Source of Trading Performance of Different Types of Investors in Thailand, Empirical Evidence from Thailand, Chulalongkorn University.