Finally, the regression results again emphasize that the positive relationship between change in consumer confidence and Thai stock market exists. Fisher and Statman (2003) also attempt to answer the questions: i) Does consumer sentiment predict stock returns? ii) Does inventory yield affect consumer confidence? and iii) What is the relationship between consumer confidence and investor sentiment. Their research empirically shows that the stock market returns and consumer confidence are significantly related.
Consumer Sentiment in an International Context
The negative relationship between current consumer confidence level and subsequent monthly excess return is statistically significant, not only for the USA Hung (2012) also finds an important exception in Japan where the current consumer confidence level boosts the excess market return in the following month.
Consumer Sentiment affects Returns by Industry
As a result, he argues that stock returns in the United States are for the most part unaffected by sentiment, like some other industrialized countries. Moreover, they not only examine the level of investor sentiment, but also take into account the role that the change in investor sentiment can play in shaping future market returns and volatility.
Consumer Sentiment affects Returns by Firm Size
Changes in sentiment across age groups tend to affect the technology industry (eg, the computer industry, computer software and electronic equipment industry), the auto and truck industry, the precious metals industry, and the retail industry. Regarding the automotive, tape and retail industries, which among different age groups appear to be affected by changes in consumer sentiment, Mark Anthony Johnson (2010) provides the explanation that vehicle purchases are significant purchases for most consumers and are only secondary to purchase of a home in relation to the size of the purchase price. Baker and Wurgler (2006) also find that investor sentiment, which is similar to consumer sentiment, has more influence on small stocks, young stocks, high volatility stocks, unprofitable stocks, non-dividend paying stocks, extreme growth stocks and distressed stocks. .
He argues that this provides evidence consistent with his hypotheses of sentiment predicting future total market returns and influencing sentiment to be stronger for growth stocks, value stocks, and small stocks. Mark Anthony Johnson (2010) further explores the impact on retail stocks of whether this noise trader argument holds up under changes in consumer sentiment for all ages. His results show that changes in sentiment affect larger firms' market risk premiums more than smaller firms.
He finds that a 10% change in overall consumer sentiment (consumers of all ages) predicts a market risk premium change of 4.05% in the next month for the largest firms versus a market risk premium change of 1.85% for the smallest firms. He can conclude that this size effect is, for the most part, linear in that the largest firms are most affected and this effect has gradually decreased as firm size decreases.
RESEARCH METHODOLOGY
Data and Sample Characteristics
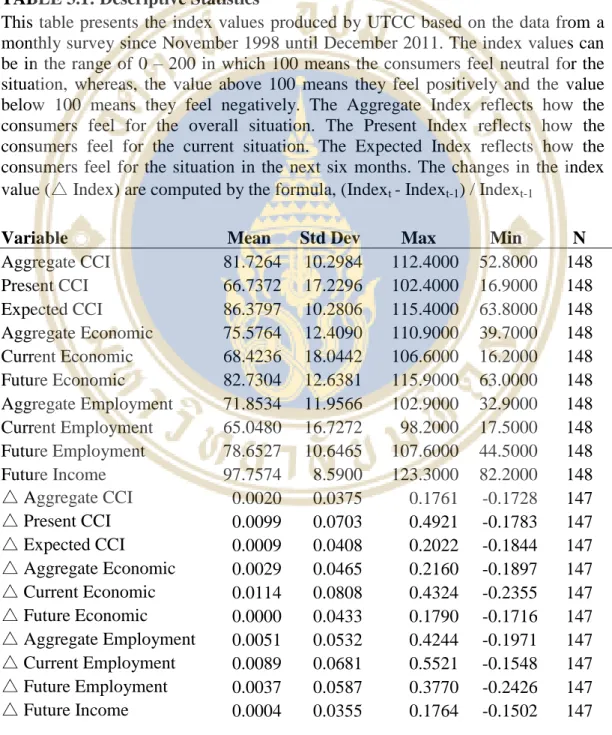
The index values can be in the range of 0 – 200, where 100 means that the consumers feel neutral about the situation, while the value above 100 means they feel positive and the value below 100 means they feel negative. The expected index reflects how consumers feel about the situation in the next six months. The changes in the index value (△ Index) are calculated using the formula (Indext - Indext-1) / Indext-1.
First, this research mainly focuses on how the total stock market reacts due to changes in consumer confidence index. To search for the explanation whether that relationship exists, I obtain the data from SET SMART database using the daily % age changes of SET index as the total market returns. Furthermore, this research will study whether firm size plays any role in relation to changes in consumer sentiment.
This research not only seeks to investigate the response to stock returns, but also incorporates a behavioral investment component by examining which types of investors are more responsive to changes in consumer sentiment. To investigate this aspect, trading volume data by investor type, which includes retail trader, foreign trader, institutional trader and equity trader, can be collected from SET SMART for both the aggregate market level and the firm level.
Research Methodology
- Event Study Method
- Regression Model
The changes in CCI are derived from the percent age change of the current CCI period compared to the previous CCI period. Being able to examine whether company size has a statistically significant relationship with changes in consumer sentiment is all data from everyday life. In addition to stock returns, this research also includes the behavioral investing event study to investigate among different types of investors which types of investors respond better to the changes in consumer confidence and in what situation they react between positive and negative changes in the CCI.
Similar to the market return response, this study also examines the trading behavior by investor type at the market level, how those investor types respond to CCI changes in good and bad years. Equation (1) examines whether the changes in CCI have a statistically significant impact on the average SET market returns on the announcement day and a day after. After testing for the relationship between the changes in consumer sentiment and the total market returns, this research further examines the trading behavior by investor type behind the empirical result of such a relationship.
Equation (2) examines whether changes in the CCI have a statistically significant impact on the average SET market returns on the announcement day and the day after the announcement, and which types of investors thus affect market returns due to their trading behavior changed in reaction to the CCI change. Equation (3) investigates whether changes in the CCI have a statistically significant impact on the average SET market returns on the day of the announcement and the day after with control variables including all types of investors adding a dummy variable to examine the impact of a good year and a bad year in relation to market returns.
RESULTS AND DISCUSSION
Empirical Results on Stock Returns Event Study
- Changes in CCI Impact on Aggregate Market Return
- Market Returns Reaction in Good or Bad Years
- Size Effect on Abnormal Returns
- Industry Effect on Abnormal Returns
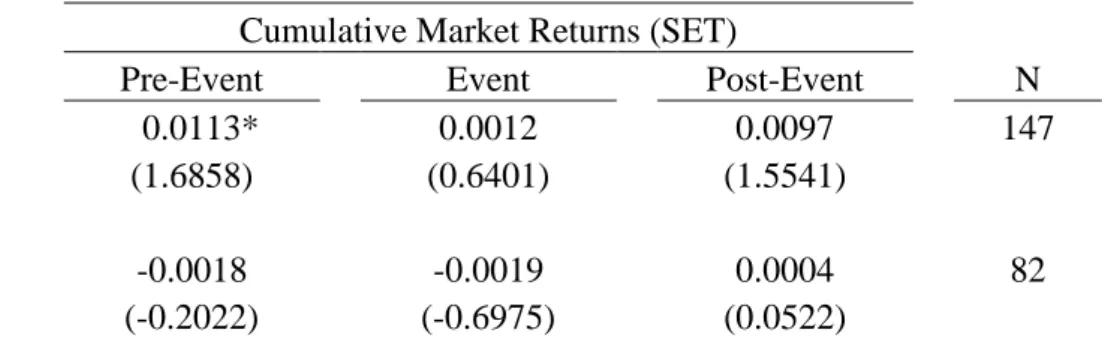
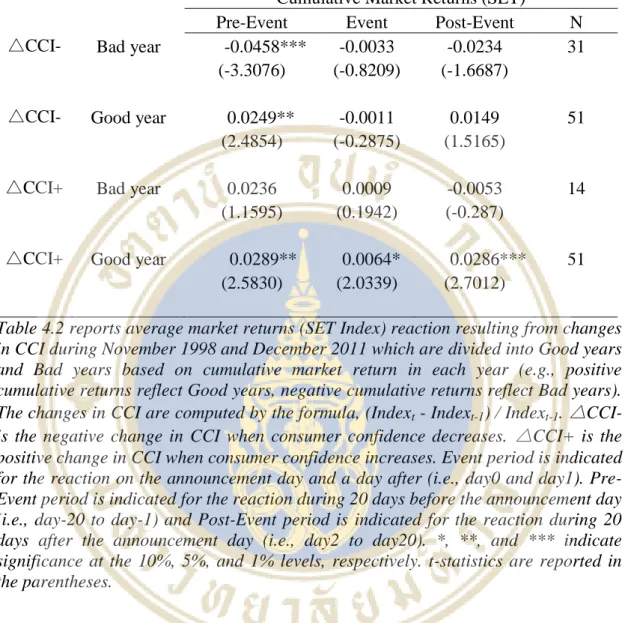
The result per table 4.2 also illustrates the investors' expectation of the positive changes in the CCI that affect the market return in the pre-event period as well as the investors' underreaction in the subsequent period in good years in accordance with the result per table 4.1. The results in table 4.2 are also tested to ensure that the market reactions in a good year are statistically significantly different from the market reactions in a bad year. By examining the cumulative abnormal return for small companies and the larger companies during the event period, the result per table 4.3 that the decrease in CCI appears to affect the negative returns of small firms that deviated from the average market return with statistically significant at the 1% level, whereas no significant response in the larger firms.
Regardless of positive or negative change in TKB, Table 4 reports that changes in TKK lead to negative abnormal returns of small firms of -0.82% (t-stat = -3.71). The results in Table 4.3 are also tested for significant difference between small firms and larger firms. The abnormal returns of stock i in time period t are calculated by the formula, Stocki,t - SETt, where SET is the aggregate return of the market.
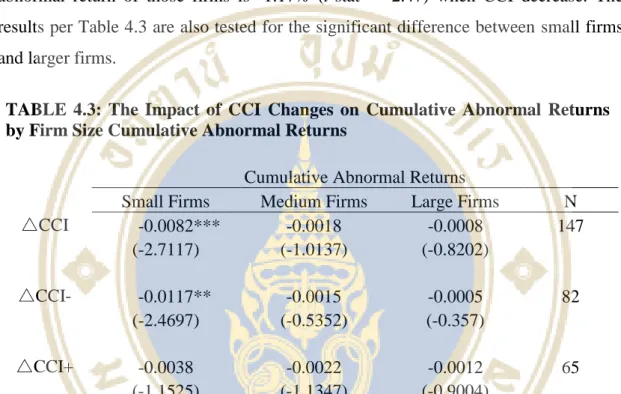
However, the result shows the statistically significant impact on positive abnormal stock returns in the property and construction industry only if TKK decreases. On the other hand, abnormal stock returns in the Resources industry are positively related to TBK changes only when TKK increases.
Empirical Results on Trading Behavior Event Study
- Changes in CCI Impact on Market Trading Behavior
- Market Trading Behavior in Good Years and Bad Years
- Size Effect on Investor Trading Behavior
- Industry Effect on Investor Trading Behavior
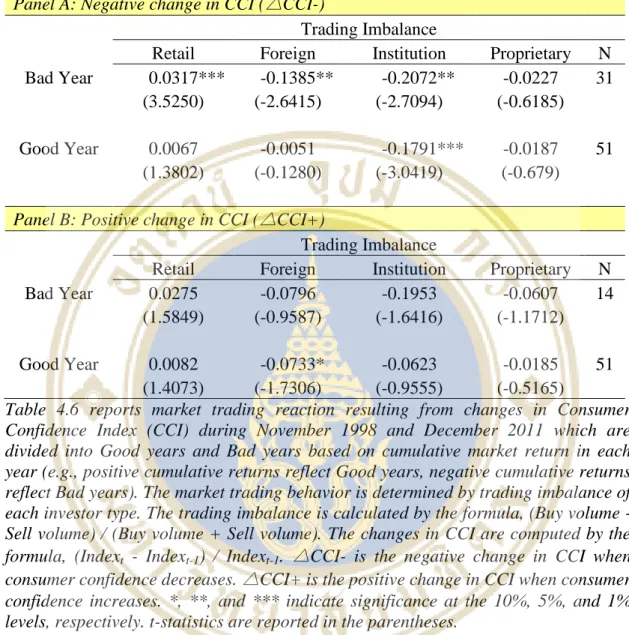
This study further examines whether there are different impacts of CCI changes on trading behavior during good years and bad years. To illustrate, retail traders will buy stocks while foreign traders and institutional traders will sell stocks. By focusing on the CCI increases during good years that it is statistically significant impact on the market returns according to my previous result, only foreign traders who react to the CCI change into a position of seller with statistically significant at 10% level.
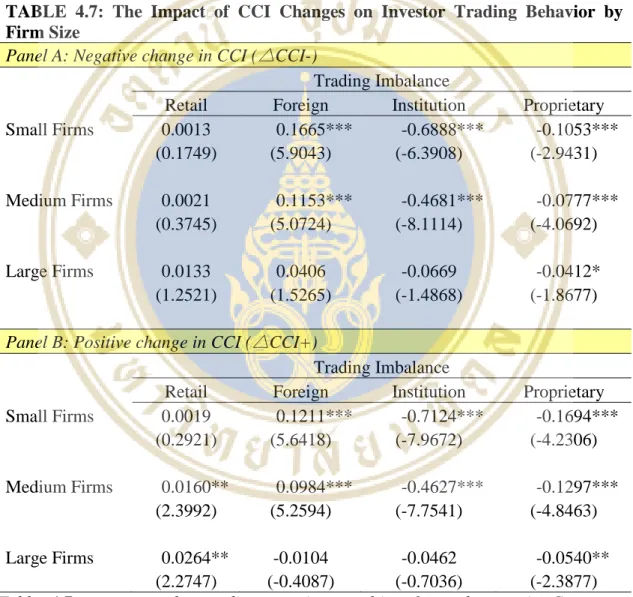
Aiming to explore whether each type of investor trades in the same way among small firms, medium-sized firms and large firms in response to consumer sentiment changes positively and negatively, the trading behavior of investors is examined by stock trading disequilibria that are divided in one of the three portfolios. – small, medium and large firm size based on firms' market capitalization. Noting investors who trade in small firms as their returns are statistically significantly related to CCI changes according to my previous results, Table 4.7 shows that CCI changes positively or negatively, foreign traders will buy while institutional traders and proprietary traders will sell those small stocks with statistical significance at the 1% level. Trading imbalance is calculated by the formula, (Buy Volume - Sell Volume) / (Buy Volume + Sell Volume). Equity trading imbalances are allocated to one of three portfolios based on the firms' market capitalization.
By examining the trading imbalances of each type of investor trading stocks in each sector during the event period, the result of Table 4.8 shows the different trading behavior between each group of investors and each sector, with statistically significant values of 1%, 5% and 10 % level. The changes in the CCI are calculated using the formula (Indext - Indext-1) / Indext-1.△CCI- is the negative change in the CCI when consumer confidence decreases.
Empirical Results from Regression
- Regression of the CCI Changes on Average Market Returns To emphasize whether the changes in consumer sentiment exhibit
- Regression of the CCI Changes with Trading Control Variables By incorporating with control variables of trading imbalance per each
- Regression of the CCI Changes adding Good/Bad Year Variables In addition to the trading control variables, this study also investigates the
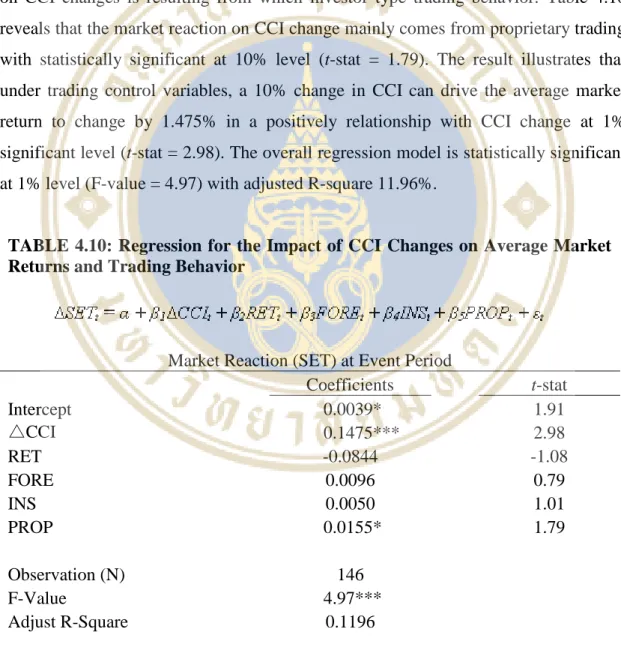
The trade imbalance is calculated by the formula, (Buy volume - Sell volume) / (Buy volume + Sell volume). The average market return (△SETt) is calculated by △SETt = (SETt - SETt-1) / SETt-1, then summed over the event period t, where t is the CCI announcement day and a day after. The result illustrates that among trading control variables, a 10% change in CCI can cause the average market return to change by 1.475% in a positive relationship with CCI change at 1%.
RETt is the retail trade imbalance during the event period t while FOREt, INst and PROPt is the trade imbalance of foreign trader, institutional trader and proprietary trader, respectively. The trading imbalance of each type of investor i in period t is calculated as (Buy volume - sell volume) / (buy volume + sell volume).* and *** indicate significance at the 10% and 1% level, respectively. The result shows under the control of trading variables incorporated with the dummy variable of good or bad year, a 10% change in CCI can bring the change of average market return by 1.484% in a positive relationship with CCI change.
GBt represents a dummy variable equal to one if the event occurs in good years and zero otherwise. The trading imbalance of each type of investor i in period t is calculated as (Buy volume - sell volume) / (buy volume + sell volume).* and *** indicate significance at the 10% and 1% level, respectively.
CONCLUSION