RELATIVE VALUATION OF GULF ENERGY DEVELOPMENT PUBLIC COMPANY LIMITED
JIAXING LIN
A THEMATIC PAPER SUBMITTED IN PARTIAL FULFILLMENT OF THE REQUIREMENTS FOR THE DEGREE OF MASTER OF MANAGEMENT
COLLEGE OF MANAGEMENT MAHIDOL UNIVERSITY
2022
COPYRIGHT OF MAHIDOL UNIVERSITY
Thematic paper entitled
RELATIVE VALUATION OF GULF ENERGY DEVELOPMENT PUBLIC COMPANY LIMITED
was submitted to the College of Management, Mahidol University for the degree of Master of Management
on May 1, 2022
...
Miss Jiaxing Lin Candidate
... ...
Asst. Prof. Simon Zaby, Prof. Roy Kouwenberg,
Ph.D. Ph.D., CFA
Advisor Chairperson
... ...
Assoc. Prof. Vichita Ractham, Worapong Janyangyuen,
Ph.D. D.B.A.
Dean Committee member
College of Management Mahidol University
ACKNOWLEDGEMENTS
I wish to express my sincere to my advisor, Dr. Simon Zaby. This thematic paper would not have been completed without his irreplaceable guidance and support throughout the research process. Most importantly, he did his best to help me when I was in trouble and kept encouraging me to get me back on my feet. Besides, Dr. Simon gives me the most valuable feedback in every meeting. I am honored to have this opportunity to study and conduct this research under his careful guidance.
I sincerely thanks to the committee members Prof. Roy kouwenberg and AJ.
Worapong Janyangyuen for their suggestions on my thematic paper. In addition, I would like to sincerely thank every professor during my graduate studies for their guidance and care over the past five semesters. Also, I would like to sincerely thank Miss Piyanuch Rojbowornwitthaya.She was like a superhero who showed up to me when I needed help. She always supported and encouraged me, gave me the courage to face any difficulties. I also appreciate Miss Patanya Chaiyasat help and support for me. I would also like to thank each of my classmates, and the CMMU staff for their enthusiasm and care, allowing me to focus on completing this thesis.
Finally, my endless and deepest gratitude to my parents and relatives for the love and care they have shown me. I was able to complete my graduate program because of the continued support and trust of my parents, who have always been my solid backing. My sincere thanks to everyone who supported me during the writing of the thematic paper.
Jiaxing Lin
RELATIVE VALUATION OF GULF ENERGY DEVELOPMENT PUBLIC COMPANY LIMITED
JIAXING LIN 6349065
M.M. (CORPORATE FINANCIAL)
THESIS ADVISORY COMMITTEE: ASST. PROF. SIMON ZABY, Ph.D., PROF.
ROY KOUWENBERG, Ph.D., CFA., WORAPONG JANYANGYUEN, D.B.A.
ABSTRACT
In this paper, the relative valuation method was selected to estimate the share value of Gulf Energy Development Public Company Limited (Gulf). I used trailing and forward PE, PBV, and EV/EBITDA multiples to determine Gulf's stock price in 2022 and 2023. Therefore, by using the average of the corresponding target price for each multiplier, Gulf's share price in 2022 is estimated at 55.46 baht per share.
It is 8.75% higher than the current price of 51.00 baht on the same day (March 1). The target price will increase from the March 1 price which was 51. Therefore, we recommend the investors to buy Gulf stock because the current price of Gulf is undervalued.
We recommend a revaluation of Gulf after the Covid-19 situation recovers and the economy of the entire country returns to normal operation. Financial data about Gulf's business will change due to changes in the macroeconomic environment and consumer demand, as well as improvements in the strategies of peer energy companies.
To better understand the positioning of Gulf in the international market after the recovery of the epidemic, it is best to compare Gulf with a comparable benchmark company and re-value it again.
KEY WORDS: Gulf/ Relative Valuation/ Renewable Energy
67 pages
CONTENTS
Page
ACKNOWLEDGEMENTS ii
ABSTRACT iii
LIST OF FIGURES vii
LIST OF TABLES ix
LIST OF ABBREVIATIONS x
CHAPTER I INTRODUCTION 1
CHAPTER II COMPANY OVERVIEW OF GULF 4
2.1 Introduction to GULF 4
2.2 Company’s Business 5
2.3 Financial Perference 10
2.3.1 Revenue Structure 10
2.3.2 Revenue Breakdown by Business Units (%) 11
2.3.3 Net Profit/ Core Profit 14
2.3.4 D/E Ratios 16
CHAPTER III ANALYSIS OF MACROECONOMY, INDUSTRY, AND
COMPETITORS 17
3.1 Thailand's Macroeconomic Outlook 17
3.2 Industry overview 19
3.2.1 Industry situation for Power Generation Business 20 3.2.2 Industry situation for Gas Business 28
CONTENTS (cont.)
3.2.3 Industry situation for Infrastructure and Utilities Business 29 3.2.4 Industry situation for Digital Business 30
3.3 Peers Selection 31
CHAPTER IV VALUATION OF GULF 33
4.1 Relative Valuation Model 33
4.1.1 P/E Ratio 34
4.1.2 P/BV Ratio 36
4.1.3 EV/EBITDA Ratio 38
4.2 GULF’s Performance Compared to Peers’ 39
4.2.1 GULF’s Market Capital Compares to Peers 40 4.2.2 GULF’s Multiples Compares to Peers 41 4.2.3 Relative Multiples Compares to Peers 43 4.2.4 Target Price from Different Multiple 43 4.3 Sensitivity Analysis and Scenario Analysis 45 4.3.1 Different Target Share Prices for (+20%) and (-20%) 46 4.3.2 Estimated Target Prices by Peers’ Benchmark Multiples 48 CHAPTER V INVESTMENT RISKS AND DOWNSIDE POSSIBILITIES 49
5.1 Strategic Risk 49
5.2 Financial Risk 50
5.3 Operational Risk 50
5.4 Market Risks 51
5.5 Environment Risk 51
5.6 Social risks 52
CHAPTER VI CONCLUSION 53
CONTENTS (cont.)
REFERENCES 55
REFERENCES (cont.) 56
APPENDICES 58
Appendix A: Investment Structure of GULF 59
Appendix B: Organizational Chart 61
Appendix C: Corporate Governance Structure 62
Appendix D: Shareholder Structure of GULF 64
Appendix E: Business Strategy of GULF 65
BIOGRAPHY 67
LIST OF FIGURES
Figure Page
1.1 Financial Information of Gulf 2
1.2 History stock price of Gulf 3
2.2 Digital Business Investment 9
2.3 Total Revenues of Gulf 11
2.4 GULF’s Revenue Structure 12
2.5 GULF’s Revenue breakdown by business units (%) 14
2.6 Net profit / Core profit of Gulf 15
2.7 Balance Sheet of Gulf 16
3.1 Real GDP growth Map in 2021 18
3.2 Real GDP growth Map in 2022 18
3.3 Thailand GDP Growth QoQ 19
3.4 Business Portfolio Overview 20
3.5 Thailand’s Electricity Consumption in 2008-2037 (Gigawatt-hours) 21
3.6 Peak Power Demand in Thailand from 2008 to 2037 (Megawatts) 22
3.7 Thailand’s Total Contracted Capacity from the Grid (November 2021) 23
3.8 New IPP Power Plants from Gulf 23
3.9 Vietnam GDP Annual Growth Rate 25
3.10 Germany GDP 2001-2022 26
3.11 Thailand GDP 2001-202 27
3.12 Lao PDR GDP 2001-2022 28
4.1 Trailing P/E Band of GULF 34
4.2 Forward P/E Band of GULF 35
LIST OF FIGURES (cont.)
Figure Page
4.3 Trailing P/BV Band of GULF 36
4.4 Forward P/BV Band of GULF 37
4.5 Trailing EV/EBITDA Band of GULF 38
4.7 Estimate Gulf Target Price 45
4.8 GULF Smart Estimate EPS 46
LIST OF TABLES
Table Page
4.1 GULF’s Market Capital Compares to Peers 41
4.2 GULF’s Key Ratio Compares to Peers 41
4.3 GULF’s Multiples Compares to Peers 43
4.4 GULF’s Target Price 43
4.5 GULF’s Target Share Price from Different Multiple 44
4.6 Different Target Share Prices for (+20%) 47
4.7 Different Target Share Prices for (-20%) 47
4.8 Estimated Target Prices by Peers’ Benchmark Multiple 48
LIST OF ABBREVIATIONS
Acwa Power Co International Company for Water and Power Projects ADVANC Advanced Info Service Public Company Limited
BSD District Cooling System
BSP Power Distribution System
CAGR Compound Annual Growth Rate
CAPEX Capital Expenditure
Covid-19 CoronaVirus Disease 2019
EA. BK Energy Absolute Public Company Limited EBIT Earnings Before Interest and Taxes
EBITDA Earnings Before Interest, Taxes, Depreciation and Amortization
EEC Eastern Economic Corridor
EPPO Energy Policy and Planning Office
EPS Earnings per share
EU European Union
GDP Gross Domestic Product
GULF Gulf Energy Development Public Company Limited
INTUCH Intouch Holdings Company
IPP Independent Power Producer
IUs Industrial Customers Load Factor
QoQ Quarter-Over- Quarter
Lao PDR Lao People's Democratic Republic
LNG Liquefied Natural Gas
LIST OF ABBREVIATIONS (cont.)
MN Million
MNTK.OQ Montauk Renewables, Inc.
MTP3 Map Ta Phut Industrial Port Development Project, Phase 3
MW Megawatt
M6 Bang Pa-In - Nakhon Ratchasima
M81 Bang Yai – Kanchanaburi
NGD Natural Gas Distribution
NI Net Income
PDP Development Plan
PPA Power Purchase Agreement
PPP Public-Private Partnership SET Stock Exchange of Thailand
SPP Small Power Producer
THB Thai Baht
YoY Year-Over-Year
3Q20 Third Quarter of 2020
4Q21 Fourth Quarter of 2021
CHAPTER I INTRODUCTION
Gulf Energy Development Public Company Limited (“GULF”) is a Thailand-based holding company principally engaged in the energy industry. The Company's shares traded on the first day of trading on the Stock Exchange of Thailand on December 6, 2017. The GULF was established in Bangkok in 2011. GULF invests in conventional and renewable energy generation and distribution businesses, as well as natural gas supply and distribution, infrastructure development projects and other related businesses (GULF, 2022). GULF conducts related business in Thailand and around the world through its subsidiaries.
GULF total revenue is 47,467.3 million baht, the market capitalization is 586,657.5 million baht (Figure 1.1), GULF shares outstanding is around 11,733.1 billion and the GULF dividend yield is 0.88%. The largest major holder of GULF is MR. SARATH RATANAVADI who hold 35.33% shares, GULF dividend payout ratio increased from 28.2% in 2018 to 58.1% in 2021. The dividend policy of GULF is that the board of directors of the company recommends to shareholders an annual dividend that accounts for at least 30.0% of the company's net profit after tax.
Figure 1.1 Financial Information of Gulf Source: S&P Capital IQ (2022)
COVID-19 has limited impact to GULF as IU electricity demand is still growing while overseas project delays do not impact returns. Since the in Thailand the electricity demand from IUs (industrial customers load factor) still growing from new customers and existing customers, especially from automotive, steel, electronic components and packaging industries. The company’s total revenue in 2020 was 35,869 million baht, and the total revenue increased to 52,870 million baht in 2021, the total revenue growth rate is 47.4%.
The objective of this article is to estimate GULF's share price in 2022 using the relative valuation method, and to conduct research on GULF's financial and business performance. First, we will introduce GULF, as well as GULF's product portfolio and the company's operations. Next, we will analyze the national economic analysis.
Comparing competitors in GULF's industry using the relative valuation method. Thirdly, we will forecast the financial statements of GULF after analyzing the historical financial data of GULF. Then comes the valuation analysis, potential risks and how those risks might affect the conclusion. Finally, the conclusion section will summarize all analysis and valuation results.
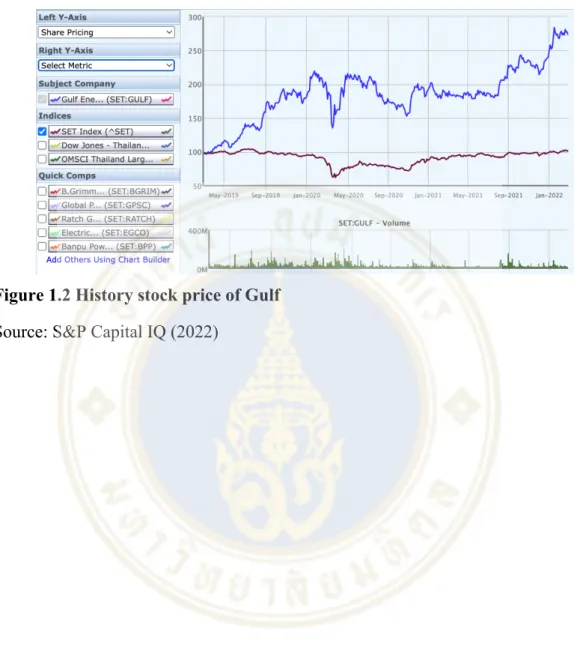
We recommend a "buy or hold" on Gulf Energy Development Public Company Limited shares from the (Figure 1.2) that GULF has been rising from 2021
onwards. Even under the influence of the epidemic, GULF's total revenue has maintained a strong upward trend.
Figure 1.2 History stock price of Gulf Source: S&P Capital IQ (2022)
CHAPTER II
COMPANY OVERVIEW OF GULF
GULF is a holding company that invests in a core business portfolio which can be divided into 3 business groups including 1: Energy business including gas power generation business and other related businesses, renewable energy business and natural gas business 2: Infrastructure and utilities business and 3: digital commerce. In this chapter, we will introduce the company from four aspects: introduction to Gulf (2.1), company business (2.2), company financial performance (2.3).
2.1 Introduction to GULF
GULF is one of the largest private power producers in Thailand, managing a range of gas and renewable energy projects, serving both public (Electricity Authority of Thailand or EGAT) and private customers in key industrial areas in Thailand. In addition, GULF also provides management services for power projects within the group from the development and construction stage to the post-commercial operation management stage. GULF's goal is to provide the highest level of service to its customers, which is reflected in GULF's customer satisfaction score of over 93%, higher than the company's target, reflecting an upward trend in satisfaction (Gulf, 2022).
Each letter of GULF corresponds to the corresponding word. G is for Goal- oriented, it means GULF has the drive and courage to overcome limitations, and the company encourages and supports personal development, enabling employees to achieve company goals, push boundaries with confidence, and overcome obstacles together. U is for Unity, it means teamwork and mutual success, but it also means that
the company creates a work environment that promotes knowledge sharing and exchange and supports activities that encourage positive interactions among employees.
L is for Learning, it means a love of learning and a curiosity to initiate and explore new things. Employees are challenged to think outside the box, learn from mistakes, find new ideas, and seek personal development through training opportunities offered throughout the year. F is for Flexible, it means being flexible and agile to all challenges.
Companies and their employees must be able to adapt to changing circumstances, be open to new ideas and perspectives, and be resourceful and flexible at work (Gulf, 2022).
The company's core businesses are diversified and cover five businesses: 1.
Power Generation Business involving electricity, steam and chilled water generation and distribution and other businesses. 2. Renewable Energy Business. 3. Hydropower Business. 4. Infrastructure and Utilities Business. 5. Gas Business.
GULF is committed to providing energy efficiency solutions and developing future energy resources, including other renewable energy sources. GULF's goal is to create and develop high-value resource opportunities by aligning the company's business strategy through rigorous operational excellence, capital management and cost efficiency. In addition, GULF plans to increase earnings across the value chain and make targeted investments to lead the industry's returns (Gulf, 2022).
Vision and Mission Statements of GULF - GULF vision is A trusted company that innovates to develop premier energy across boundaries. And the mission of GULF is to integrate innovative strategy, quality resources, premier technology, and culture of commitment to achieve the most reliable energy solution (Gulf, 2022).
2.2 Company’s Business
In 2021, GULF conducts the following business (Figure 2.1): Power project COD, on March 31, 2021, GULF builds GSRC unit 1-2 (gas-fired). PPP Contracts
Signing, 29 September 2021, BGSR 6 and BGSR 81 signed a public-private partnership (PPP total cost) contract with the Ministry of Highways to operate the M6 and M81 intercity motorway projects. Expansion into Digital Business, On August 4, 2021, GULF completed the tender offer for INTUCH shares, with a total shareholding ratio of 42.25% (18.93% before the transaction). On October 1, 2021, GULF and Singtel signed a memorandum of understanding to jointly develop data center business in Thailand.
Financing Activity, September 29, 2021, GULF issued bonds to institutional investors and high net worth individuals with a total amount of 30 billion baht, an average annual interest rate of 2.5%, and an average maturity of 6 years. Restructuring Business Groups, on August 13, 2021, GULF established Gulf Renewable Energy to operate renewable energy businesses such as wind energy, solar farms, solar roofs, biomass and hydropower. On December 16, 2021, GULF established Gulf Innova to operate digital infrastructure and digital-related services businesses, including co-investing with partners to build future digital platforms (Gulf, 2022).
Figure 2.1 Business Portfolio Overview
Source: GULF. Company presentation 2021
Power Generation Business - GULF's gas-fired independent power producer ("IPP") project generates electricity and sells power to EGAT under a 25-year power purchase agreement ("PPA"). And its gas-fired Small Power Producer (“SPP”) projects sell 70% - 80% of the electricity they generate goes to EGAT under a 25-year power purchase agreement. The power purchase agreement begins when the project achieves commercial operation.
Electricity sold to EGAT is distributed through EGAT's national transmission network. It is then sold to PEA and MEA and finally distributed to consumers across Thailand. GULF's SPP also sells electricity, steam and chilled water to industrial users.
In Thailand, GULF currently has 21 gas-fired power projects in operation and another 4 gas-fired IPPs under development. Overseas, GULF is developing its own gas-fired power generation project in the Duqm Special Economic Zone in Oman (Gulf, 2022).
Gas Business - GULF continues to develop its own natural gas business, aligning the company's development with Thailand's national strategy and efforts to support energy security and enhance competitiveness across the natural gas value chain.
GULF's natural gas business includes:
LNG supply and trade: GULF has been granted a liquefied natural gas (LNG) shipper license under its subsidiary, Gulf LNG Company Limited, to supply 300,000 tonnes of natural gas per annum to 19 SPPs in operation under the Company. In addition, the Company has also been granted an LNG shipper license under its joint venture, Hin Kong Power Holding Company Limited, to supply 1.4 million tonnes of natural gas per annum to the Hin Kong power project.
LNG terminal: The Company holds a 70% equity interest in Gulf MTP with the rights to develop and operate the Map Ta Phut Industrial Port Development Project, Phase 3 (Phase 1) (“MTP3”) located in Rayong province. As part of the MTP3 project,
the Company has been granted rights to design, construct and operate an LNG terminal with a capacity of up to 10.8 million tonnes per annum.
Natural gas distribution (NGD): GULF holds a 40% equity interest in PTT NGD to invest in the construction of a natural gas distribution pipeline system serving customers in 13 industrial areas in the Bangkok Metropolitan region and Rayong province. In addition, the Company holds a 35% equity interest in Gulf WHA MT to operate two gas distribution projects (“NGD2” and “NGD4”) serving industrial users in industrial estates in Thailand’s eastern seaboard (Gulf, 2022).
Renewable Energy - GULF develops and operates renewable energy projects in Thailand and overseas.
In Thailand, GULF has 4 solar rooftop power projects with a total installed capacity of 600 kW in Chonburi and Rayong. It also has a small biomass power plant with a total installed capacity of 25 MW in Songkhla Province. The total capacity of Thailand's renewable energy projects is 25.6 MW.
Overseas, GULF holds direct equity interests in Vietnam's solar farms ("GTN1" and "GTN2"), and offshore wind farms ("Mekong Wind") with a combined capacity of 246.8 MW. In addition, GULF holds a 50% stake in the Borkum Riffgrund II project in Germany with a total capacity of 464.8 MW (Gulf, 2022).
Hydropower - GULF is currently studying the feasibility of developing hydropower projects in the Mekong River Basin in Laos under a memorandum of understanding on the purchase of electricity between Thailand and the Lao People's Democratic Republic. The hydropower projects under study are runoff or diversion dams, and no large reservoirs have been built. Its principle is to use the natural flow of water to generate electricity, so that the amount of water entering is equal to the amount of water flowing out, so it has no impact on the environment of Laos (Gulf, 2022).
Infrastructure & Utilities - Beginning in 2019, GULF began to gradually invest in infrastructure and utilities business in Thailand.
Except for Phase 3 of Map Ta Phut Industrial Port Development in Rayong Province. GULF will also reclaim land for the infrastructure portion and operate an LNG terminal in the area, and the company is also operator of the M6 (Bang Pa-In - Nakhon Ratchasima) and M81 (Bang Yai – Kanchanaburi) intercity highways.
GULF also holds a 33.3% stake in a joint venture to invest in the operation of the Power Distribution System (“BSP”) and District Cooling System (“BSD”) at the One Bangkok Project in Bangkok, Thailand (Gulf, 2022).
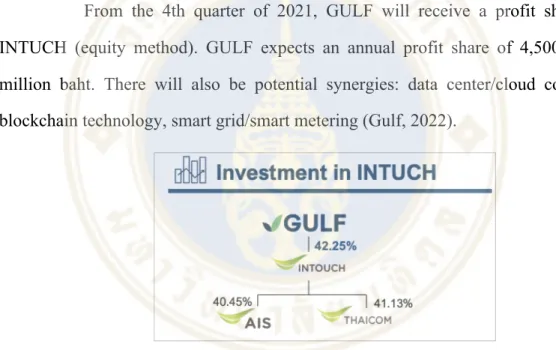
Digital Business - In 2021, GULF holds a 42.25% stake in INTUCH, and GULF received 2.349 billion baht in dividends from INTUCH in 2021 (Figure 2.2).
From the 4th quarter of 2021, GULF will receive a profit share from INTUCH (equity method). GULF expects an annual profit share of 4,500 – 5,000 million baht. There will also be potential synergies: data center/cloud computing, blockchain technology, smart grid/smart metering (Gulf, 2022).
Figure 2.2 Digital Business Investment Source: GULF. Company presentation 2021
Regarding the data center, GULF signed a joint development agreement with Singtel and ADVANC. Through this agreement, GULF will establish a leading data center business in Thailand. And that data center demand will be driven by consumers, businesses, and governments.
Digital asset exchange, digital asset exchange, GULF signed a memorandum of understanding with Binance in 2021. Binance's cryptocurrency exchange is the largest in the world. GULF and Binance will jointly research and develop a digital asset exchange in Thailand. The partnership will help Thailand advance its own digital asset and blockchain infrastructure development (Gulf, 2022).
2.3 Financial Preference
We will introduce the financial preference from 4 parts: revenue structure (2.3.1), revenue breakdown by business units (%) (2.3.2), net profit/ core profit (2.3.3) and D/E ratio (2.3.4).
2.3.1 Revenue Structure
GULF's total revenue in 2021 was 52.87 billion baht, an increase of 47.4%
from 35.869 billion baht in 2020.
The source of total revenue mainly comes from: the increase in sales revenue, which will increase from 32.298 billion baht in 2020 to 45.373 billion baht in 2021, a growth rate of 40.5%. There are three main reasons for the increase in sales revenue:
1. Revenue recognition from GSRC units 1-2 which COD on 31 Mar and 1 Oct ’21. 2. Full year revenue of BKR2 (revenue generated from 4Q20). 3. The average selling price of electricity per unit has increased due to rising natural gas prices.
Other income increased from 543 million baht to 2,516 million baht, mainly due to an increase in INTUCH dividends.
Recognized revenue from lease under power purchase agreement from GSRC units 1-2. Therefore, revenue from GSRC and BKR2 projects and contribution from INTUCH are key drivers of GULF's 2021 revenue increase (Gulf, 2022).
Figure 2.3 Total Revenues of Gulf
Source: GULF. (2022). Annual Report 2021
2.3.2 Revenue Breakdown by Business Units (%)
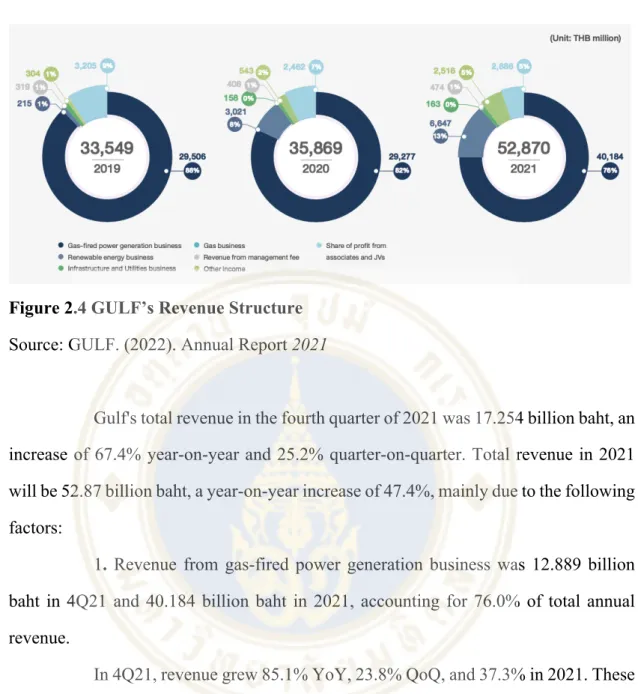
Gulf's main revenue comes from the sale of electricity, steam, chilled water and desalinated water. As well as profits from associates and joint ventures, from the operation of the gas-fired power generation and renewable energy businesses. However, the gas business and the infrastructure and utilities business, which are currently under construction and development, will become important and contribute more revenue to Gulf in the future. The revenue contribution of Gulf's various business categories is shown in the following Figure 2.4:
Figure 2.4 GULF’s Revenue Structure Source: GULF. (2022). Annual Report 2021
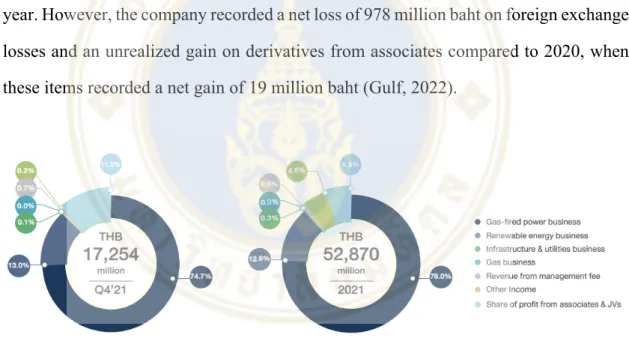
Gulf's total revenue in the fourth quarter of 2021 was 17.254 billion baht, an increase of 67.4% year-on-year and 25.2% quarter-on-quarter. Total revenue in 2021 will be 52.87 billion baht, a year-on-year increase of 47.4%, mainly due to the following factors:
1. Revenue from gas-fired power generation business was 12.889 billion baht in 4Q21 and 40.184 billion baht in 2021, accounting for 76.0% of total annual revenue.
In 4Q21, revenue grew 85.1% YoY, 23.8% QoQ, and 37.3% in 2021. These revenues are primarily from revenue recognition for GSRC units 1-2 from the commercial operation dates of March 31 and October 1, 2021. And the average selling price of electricity per unit that increases with the price of natural gas. In addition, GMP Group has increased electricity and steam sales to industrial users (Gulf, 2022).
2. Gulf’s renewable energy business revenue in the fourth quarter of 2021 was 2,248 million baht, compared with 6,647 million baht in 2021, accounting for 12.6%
of total revenue for the year (Gulf, 2022).
4Q21 revenue grew 1.3% YoY. Mainly due to the depreciation of the Thai baht against the US dollar and the euro, the German BKR2 offshore wind project, GTN1
and the GTN2 solar project in Vietnam can be sold at higher baht prices. Revenues from the BKR2 offshore wind project entering the peak season increased by 70.8%
sequentially compared to the third quarter of 2021. Compared with 2020, 2021 revenue increased by 120.0% year-on-year, mainly from the full-year performance of the BKR2 offshore wind project, while the performance recognized in 2020 was in the first quarter, plus the GCG biomass project started its full-year performance contribution in 2021 3 Commercial operation on the 1st of the month (Gulf, 2022).
3. Gulf's infrastructure and utilities business revenue was THB 22 million in 4Q21 and THB 163 million in 2021, representing 0.3% of total revenue for the year, from service concessions for MTP3 industrial land reclamation work The right to arrange revenue from the port development project, which is scheduled to be completed in 2024, will be recognized by the company from 3Q20 (Gulf, 2022).
4. Management fee income was 128 million baht in 4Q21 and 474 million baht in 2021, representing 0.9% of the company's management service revenue to associates. Services provided by SPP power plants (Gulf, 2022).
5. Other revenue was 31 million baht in 4Q21 and 2,516 million baht in 2021. These mainly come from Gulf's investment in INTUCH in 2021, which will allow Gulf to receive 2.349 billion baht in dividend income from INTUCH. However, starting in Q4'21, the company will record these incomes as profits from INTUCH rather than dividend income (Gulf, 2022).
6. Gulf’s share of profits from associates and joint ventures was 1,936 million baht in the fourth quarter of 2021 and 2,886 million baht in 2021, accounting for 5.5% of total revenue for the year (Figure 2.5).
In the fourth quarter of 2021, the profit share increased by 97.8% year-on- year, mainly due to the first recognition of the profit share from INTUCH, as well as the core profit share from GJP. This was increased due to the depreciation of the Thai baht, which is available to pay income. Although the share of foreign exchange gains and
unrealized gains on derivatives from associates was 238 million baht in 4Q21, down from a net gain of 537 million baht in 4Q20. However, compared to Q3'21, the profit share increased by 1,003.6% quarter-on-quater, and these were mainly from INTUCH's profit share. In addition, the company also recorded foreign exchange gain share and unrealized gains on derivatives from associates in 4Q21, and these items resulted in a net loss of 515 million baht in 3Q21.
In 2021 compared to 2020, the profit share increased by 17.2% year-on-year due to the recognition of INTUCH's profit share, and the profit share of PTT NGD was higher after the company invested 40% in PTT NGD in December 2020. And added April 2021, increasing the stake to 42%. GJP's share of core profit was the same as last year. However, the company recorded a net loss of 978 million baht on foreign exchange losses and an unrealized gain on derivatives from associates compared to 2020, when these items recorded a net gain of 19 million baht (Gulf, 2022).
Figure 2.5 GULF’s Revenue breakdown by business units (%) Source: GULF. (2022). Annual Report 2021
2.3.3 Net Profit/ Core Profit
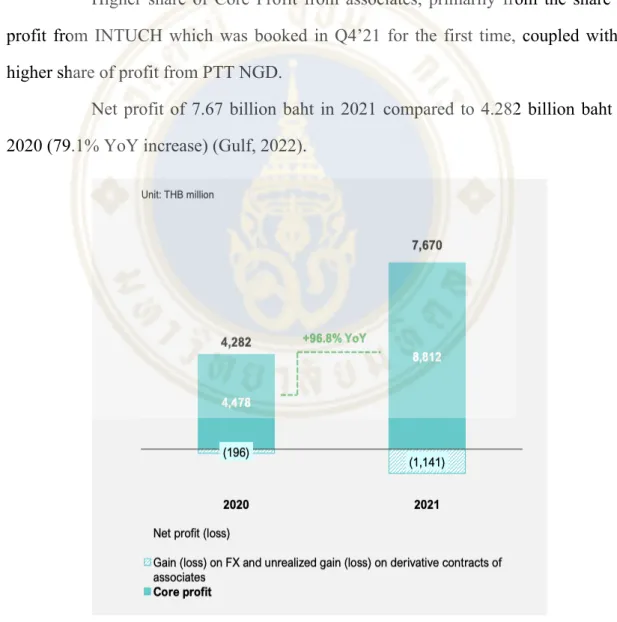
GULF's core profit in 2021 was 8.812 billion baht, compared to 4.478 billion baht in 2020, representing a year-on-year increase of 96.8% in net profit (Figure 2.6).
Mainly reasons: the profit contribution from the GSRC power plant 1-2 which started operation by GULF.
Full-year profit contribution from BKR2 wind projects, while BKR2 projects only had 1 quarter of results in 2020.
Performance of SPP power projects under the GMP Group improved, and sales of electricity and steam to industrial users grew in tandem.
Dividends received by GULF in 2021 are mainly from INTUCH dividends.
Higher share of Core Profit from associates, primarily from the share of profit from INTUCH which was booked in Q4’21 for the first time, coupled with a higher share of profit from PTT NGD.
Net profit of 7.67 billion baht in 2021 compared to 4.282 billion baht in 2020 (79.1% YoY increase) (Gulf, 2022).
Figure 2.6 Net profit / Core profit of Gulf
Source: GULF. (2022). Company presentation 2021
2.3.4 D/E Ratios
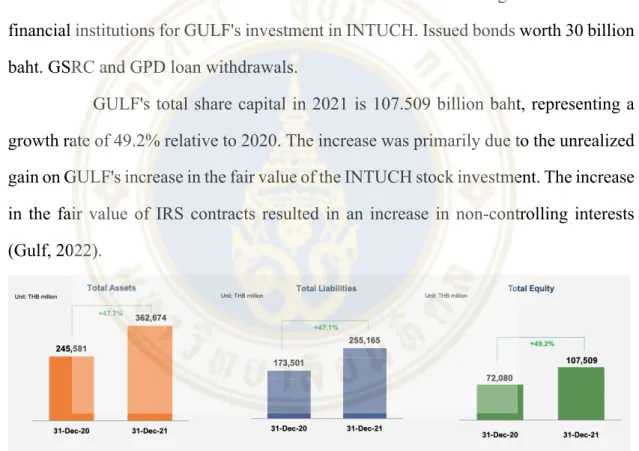
GULF's total assets in 2021 will be 362.674 billion baht, an increase of 47.7%
compared to 245.581 billion baht in 2020. The growth of total assets mainly comes from:
Finance lease receivable under power purchase (Figure 2.7).
Agreement increased from the COD of GSRC units 1-2. GULF's investment in INTUCH common stock
The total liabilities of GULF in 2021 will be 255.165 billion baht, a growth rate of 47.1% relative to 2020. The main reason for this is: long-term loans from financial institutions for GULF's investment in INTUCH. Issued bonds worth 30 billion baht. GSRC and GPD loan withdrawals.
GULF's total share capital in 2021 is 107.509 billion baht, representing a growth rate of 49.2% relative to 2020. The increase was primarily due to the unrealized gain on GULF's increase in the fair value of the INTUCH stock investment. The increase in the fair value of IRS contracts resulted in an increase in non-controlling interests (Gulf, 2022).
Figure 2.7 Balance Sheet of Gulf
Source: GULF. (2022). Company presentation 2021
CHAPTER III
ANALYSIS OF MACROECONOMY, INDUSTRY, AND COMPETITORS
In this chapter, we will analyze the macro environment of Gulf. First, an analysis of the overall environment in Thailand (3.1), and then an analysis of the industry in which Gulf operates (3.2).
3.1 Thailand's Macroeconomic Outlook
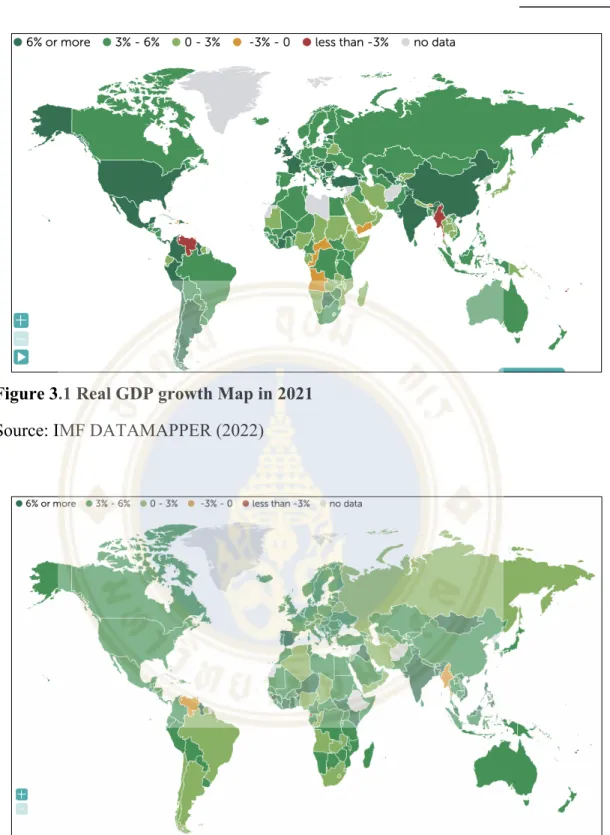
Global Economy - In 2021, the global economy will recover more strongly than in 2020, but overall growth will remain somewhat slow (Figure 3.1). This is due to the impact of the COVID-19 outbreak and prolonged supply disruptions on consumption and production. The global economy as a whole is expected to improve in 2022 (Figure 3.2). Although COVID-19 slowed down economic growth during the winter in Europe, the United States and other northern hemisphere countries at the beginning of the year, as well as the outbreak of the Omicron variant, it will gradually recover thereafter. The recovery and growth of the global economy in 2022 will allow Thailand to continue to expand its trading partners. By 2023, as the outbreak subsides and supply disruptions are resolved. Thailand's trading partner economies are expected to continue to expand, with economic growth returning to normal levels. So Thailand's trading partner economies will continue to grow from now on.
Figure 3.1 Real GDP growth Map in 2021 Source: IMF DATAMAPPER (2022)
Figure 3.2 Real GDP growth Map in 2022 Source: IMF DATAMAPPER (2022)
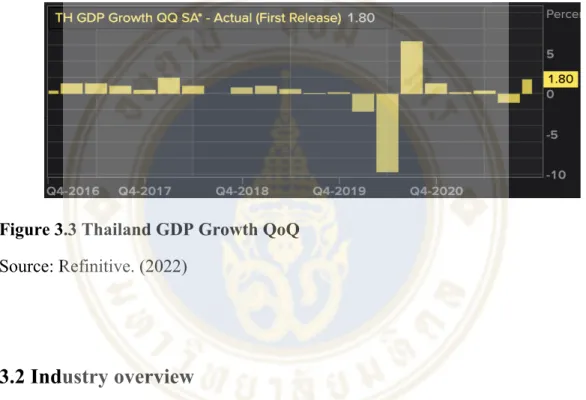
Thailand Economy - Thailand's economy is expected to grow 1.6% in 2021, driven by fourth-quarter GDP growth (Figure 3.3), boosted by strong exports and a
recovery in domestic activity following the easing of coronavirus restrictions and reopening to foreign tourists. By 2022, the Thai economy is expected to grow by 3.3%.
This is due to the limited impact of the Omicron-driven coronavirus outbreak, stronger domestic demand, tourism, and a gradual increase in exports. The impact of Omicron on domestic economic activity, merchandise exports and foreign tourist arrivals is estimated to be limited to early 2022. By 2023, the economy will pick up, mainly driven by a pickup in foreign tourist arrivals, with a projected GDP growth rate of 4.7%.
Figure 3.3 Thailand GDP Growth QoQ Source: Refinitive. (2022)
3.2 Industry overview
GULF has different core businesses, which can be divided into three major sectors: energy business, infrastructure business and digital business. We divide the energy business into Power Generation Business and Gas Business, and then we will analyze the four industries in which the Gulf business is located. They are Power Generation Business, Gas Business, Digital Business and Infrastructure and Utilities Business (Figure 3.4).
Figure 3.4 Business Portfolio Overview Source: GULF. Company presentation 2021
3.2.1 Industry situation for Power Generation Business
Gulf not only has energy and investment operations in Thailand, but also has operations in other countries. For example: Oman, Vietnam, Germany and Laos.
Therefore, we will analyze the energy industry and market in the countries where Gulf operates. Below is an overview of the energy industry in each country.
Thailand - According to data from the Energy Policy and Planning Office ("EPPO") of the Ministry of Energy of Thailand, Thailand's electricity demand in 2021 is 190,468 GWh. Compared with the electricity demand in 2020, there is a slight recovery, with a year-on-year increase of 1.8%. The recovery in electricity demand was mainly driven by increased industrial and household demand, which was unusually low in 2020 due to the first wave of COVID-19 in Thailand. At the same time, another reason for the increase in electricity demand in 2021 is the recovery of the world economy and the growth of countries that trade with Thailand, resulting in an increase in exports.
However, the third wave of COVID-19 in Thailand at the end of 2021 has had a negative impact on electricity demand in the business sector. However, according to the Bank of Thailand's economic forecast, Thailand's GDP is expected to grow by 3.4% in 2022,
which will lead to a further recovery and increase in Thailand's demand for electricity in 2022 (Gulf, 2022).
According to EPPO data (Figure 3.5), Thailand’s Electricity Consumption will increase from 148,855 GWh in 2011 to 190,468 GWh in 2021. The CAGR of electricity demand over the decade is 2.5%. Meanwhile, electricity consumption in Thailand will reach 367,458 GWh in 2037, according to estimates published in Thailand Electricity Development Plan 2018-2037 Revision 1 (“PDP2018 Revision 1”), based on electricity demand forecasts for the three power sectors (Gulf, 2022).
Figure 3.5 Thailand’s Electricity Consumption in 2008-2037 (Gigawatt-hours) Source: GULF. (2022). Annual Report 2021
During the decade 2011-2021, Peak Power Demand in Thailand increased from 23,900 MW in 2011 to 30,135 MW in 2021 (Figure 3.6). Its compound annual growth rate is 2.3%. According to PDP2018 Revision 1 forecast, Peak Power Demand in Thailand will reach 53,997 MW in 2037.
Figure 3.6 Peak Power Demand in Thailand from 2008 to 2037 (Megawatts) Source: GULF. (2022). Annual Report 2021
As of November 2021, according to EGAT's energy statistics (Figure 3.7), Thailand's total contracted generation capacity is 50,894 MW. EGAT generated 16,037 MW, which accounted for 31.5% of the total power generation. The IPP generated 15,499 MW, which accounted for 30.5% of the total power generation. 9,471 MW came from SPP which accounted for 18.6% of total power generation. 4,167 MW came from VSPP, which accounted for 8.3% of total power generation. In addition, Thailand imported 5,721 MW from Laos and Malaysia, which accounted for 11.2% of its total contracted power generation (Gulf, 2022).
Figure 3.7 Thailand’s Total Contracted Capacity from the Grid (As of November 2021)
Source: GULF. (2022). Annual Report 2021
Thailand will add new IPP power plants for contracted capacity during 2021-2027. Four of the new IPP power plants are from Gulf's power plant projects. The four projects are: GSRC, GPD, HKP, and BPP (Figure 3.8). The total contracted capacity of these four projects generates 5,690 MW, which represents 11.2% of the current contracted capacity.
Figure 3.8 New IPP Power Plants from Gulf Source: GULF. (2022). Annual Report 2021
According to PDP2018 Revision 1, in order to meet future electricity demand and to replace power plants that will be withdrawn from the system. Thailand plans to add about 56,431 MW of new power generation. At the same time, PDP2018 Revision 1 stated that Thailand will focus on renewable energy in the future. This will result in a future capacity of renewable energy power plants of approximately 20,766 MW (Gulf, 2022).
Oman - According to the Oman Power and Water Procurement’s statement for seven years from 2019-2025. It shows that peak electricity demand in the Main Interconnected System (MIS) in the Omani capital Muscat is expected to increase from 6,770 MW in 2020 to 8,600 MW in 2025. And peak power demand is expected to grow at a CAGR of 3%-8%. The RAECO-Rural Areas Electricity Company (It is a power company wholly-owned by the government) expects electricity demand to grow by 23%
annually, a forecast that means RAECO's generating capacity is not sufficient to meet demand in rural areas. Therefore, in order to meet the electricity demand in all regions.
The Omani government plans to connect MIS to RAECO to improve transmission efficiency. Currently, the main fuels for power generation in Oman are oil and natural gas. However, the Omani government has issued policies to increase the use of renewable energy sources such as solar and wind to generate electricity, thereby reducing Oman's natural gas usage.
Vietnam - Vietnam's average annual GDP growth rate is 6% (Figure 3.9).
This is because Vietnam has a large population, which allows the continuous development and expansion of Vietnam's industry. At the same time, Vietnam's economic development and population growth have led to an ever-increasing demand for electricity. In order to increase Vietnam's power generation capacity and support domestic industrial development and growth, the government has issued relevant policies. According to the revised National Power Development Master Plan 2011-2020, with the vision extending to 2030 (Revised PDP VII), Vietnam is expected to generate
97,500 MW in total in 2025 and 129,000 MW in 2030, Its compound annual growth rate is 7.2%. In addition, the government also has policies on the development of solar power, wind power, hydropower and other renewable energy power plants. By 2030, Vietnam's renewable energy generation capacity is expected to reach 49,000 MW, which accounts for 38% of the total power generation.
Figure 3.9 Vietnam GDP Annual Growth Rate Source: TRADING ECONOMICS (2022)
Germany - Germany is the fourth largest economy in the world and the largest in the European Union. Germany's 2020 GDP is 3,806 billion USD, GDP Per Capital is 45,724 USD (Figure 3.10), Thailand's 2020 GDP is 501 billion USD, and GDP Per Capital is 7,189 USD (Figure 3.11). Germany's GDP is 8 times that of Thailand, and Germany's GDP Per Capital is 6 times that of Thailand. Higher GDP means a higher standard of living and greater purchasing power. Germany's electricity demand is the highest in Europe, at over 448,700 GWh, three times that of Thailand.
According to Germany's PDP or Energiewende 2010-2050, the German government will promote the development of renewable energy to replace nuclear and fossil fuel power plants. According to Fraunhofer ISE, the use of renewable energy accounts for 46% of Germany's total electricity consumption, and the installed renewable energy
capacity of wind and solar will exceed 183.0 GW in 2021 (Gulf, 2022). And likely with the EU's zero-carbon policy, the use of renewable energy will continue to increase.
Figure 3.10 Germany GDP 2001-2022 Source: Macrotrends (2022)
Figure 3.11 Thailand GDP 2001-202 Source: Macrotrends (2022)
Lao PDR - Although Laos' economy is largely based on agriculture and agriculture, its economic growth has recently been the fastest in Asia. Even if the GDP growth rate in 2020 is only 0.44%, the average growth rate per year more than 6.8% in the past 20 years (Figure 3.12). This growth comes mainly from natural resource exports, tourism, and hydropower. In particular, electricity exports benefited from high- profile foreign direct investment in the development of hydropower projects. Electricity du Laos and GE sign MoU to support long-term development of the nation’s energy sector in 2016. Therefore, the Lao government is accelerating the development and construction of power plants, especially hydropower projects. The government plans to generate a total of 24,000 megawatts of electricity by 2030, firmly establishing Laos as the “battery of Southeast Asia” – exporting 80% (Powering Up “The Battery of Southeast Asia”, 2016).
Figure 3.12 Lao PDR GDP 2001-2022 Source: Macrotrends (2022)
3.2.2 Industry situation for Gas Business
For the natural gas business in Thailand, the Gas Management Plan 2018- 2037 aims to provide Thailand with an adequate supply of natural gas at a fair price to support economic development. Environmental balance is also taken into consideration, and 4 Thailand gas management objectives have been specified:
Ø Support the use of natural gas in various sectors to reduce air pollution Ø Exploration and production of natural gas from the country's oil fields and joint development zones
Ø Develop natural gas drilling and extraction infrastructure to reduce air pollution to meet national needs and support absolute efficiency of infrastructure
Ø Improve the competitiveness of the national natural gas trading business (Gulf, 2022)
According to EPPO's database, Thailand's natural gas demand in 2021 is 4.395 billion cubic feet per day, an increase of 0.6% year-on-year. The 2018 Natural Gas Plan predicts that Thailand's natural gas demand will grow at an average annual rate of 0.7%, reaching 5.348 billion cubic feet per day by 2037. Of this, 67% was used for power generation, 21% for the industrial sector, 11% for gas separation units and 1%
for the transport sector. And with demand from both the power generation and industrial sectors showing a growing trend. According to Thailand's 2018 natural gas plan forecast, the government will have to increase the amount of imported liquefied natural gas from 10.9 million tons in 2021 to 26 million tons in 2037 to support the growth in natural gas demand. At present, 8 companies have obtained liquefied natural gas consignment licenses from the Energy Regulatory Commission, of which 2 companies with consignment licenses are GULF companies, namely Gulf LNG and HKH (Gulf, 2022).
3.2.3 Industry situation for Infrastructure and Utilities Business
Although Thailand has been developing infrastructure and utilities projects for some time, infrastructure and utilities are the cornerstone of Thailand's further development, and the government still needs to develop a large number of projects according to future policies. Thereby improving Thailand's competitive advantage in various aspects, such as the quality of life of residents, transportation network and economic development. This makes it necessary for the government to further seek joint investment projects between government agencies and the private sector to meet the country's needs for the development of infrastructure projects. Increase efficiency and improve the quality of public services through a specialized combination of government and private sector resource utilization, including cutting-edge innovations (Gulf, 2022).
According to Thailand's Public-Private Partnership (PPP) program, the number of projects under the joint strategic investment program of the government and the private sector is increasing every year. There are currently more than 60
infrastructure projects worth trillions of baht. Most of the public-private partnership (PPP) projects are in the road and public transport sector, such as intercity motorway projects by the Department of Highways, double track railway projects by the State Railway of Thailand, and other infrastructure projects in the Eastern Economic Corridor (EEC) (Gulf, 2022).
3.2.4 Industry situation for Digital Business
Since the outbreak of COVID-19, the way people live and work has changed dramatically, shifting from offline to online. COVID-19 has become a catalyst to accelerate digital life, leading to higher demands on digital infrastructure. The world seems to move on the screen, but it also exposes many deficiencies. To make life more convenient in the future, we also need to use the power of technology. Leverage 5G technology to speed up connections because 5G supports a large number of users and allows for intercontinental communications in fractions of a second. Because 5G builds the foundation for a full range of ultra-high-speed broadband, it will bring 4G or Wi-Fi 6 impossible possibility of comparison. The prospect of 5G is even more important today as business leaders consider how best to repair and reconfigure their businesses to adapt to the post-pandemic era. Digital technologies can also play a good balancing role by enhancing connectivity, financial inclusion, and access to trade and public services. For these reasons, it is undeniable that digital business is an emerging industry that will be very important in the future, and there are huge opportunities for all walks of life to participate in the development of new businesses.
3.3 Peers Selection
In this section, we have selected a total of five Thai domestic energy companies and international energy companies that have the same related business as Gulf and identified them as Gulf competitors.
Power Assets Holdings Ltd - Power Assets Holdings Limited is an investment holding company principally engaged in energy and utility-related businesses. The company operates its business through three segments. The Investment segment is engaged in investment in power and utility-related businesses. Investing in Hong Kong Power segment is engaged in investing in the power generation and supply business in Hong Kong. The All-Other Activities segment carries out other activities carried out by Power Assets Holdings Limited.
Power Assets Holdings Limited is a global investor in energy and utility- related businesses, investing in power generation, transmission and distribution, renewable energy from waste, gas and oil. The company distributes its products in the Chinese market and overseas, including the UK, Australia, New Zealand, Thailand, the Netherlands, Portugal, and Canada.
Acwa Power Co - International Company for Water and Power Projects is a Saudi Arabia-based company engaged in the development and operation of power and desalination plants. Acwa Power Co is a leading private developer, investor and operator of 64 power generation and desalination projects in operation, construction and advancing development. As the No. 1 energy company in Saudi Arabia, Acwa Power Co plays a central role in Saudi Arabia's energy transition, while conducting energy investment operations in 13 countries on three continents.
MNTK.OQ - Montauk Renewables, Inc. is a fully integrated renewable energy company specializing in the management, recovery and conversion of biogas to renewable energy. Montauk Renewables, Inc. is a leader in the use of biogas to develop renewable energy. It has over 30 years of experience in the development, operation and
management of biogas-fueled renewable energy projects. It is involved in the development, operation and management of landfill methane-fueled renewable energy projects. The company has 12 RNGs and three renewable power operating projects in California, Idaho, Ohio, Oklahoma, Pennsylvania, North Carolina and Texas.
EA.BK - Energy Absolute Public Company Limited is a Thai company engaged in renewable energy business headquartered in Bangkok, Thailand. The company manufactures and sells methyl ester biodiesel products, high-speed diesel and pure glycerol products. The company owns and operates wind and solar power project plants. Generate electricity from solar and wind energy and provide consultancy on alternative electricity in projects.
EA.BK offers products such as biodiesel and glycerin from animal fats, vegetable oils and other products. It provides services such as dry cleaning and filtration, electricity, refining, inverters, energy, power distribution, kinetic energy services and more. It also provides the conversion of kinetic energy to mechanical energy and supplies power to transmission lines.
Yunnan Wenshan Electric Power Co Ltd - Yunnan Wenshan Electric Power Co., Ltd. is a Chinese company principally engaged in the power generation and distribution business. The company produces hydroelectric power in Wenshan Prefecture, Yunnan Province. The company mainly generates electricity through hydropower. Its electricity is mainly used for wholesale, large-scale industry, life, general industry and commerce and other purposes. The company is also involved in the engineering design business. The company also operates the local distribution grid, mainly delivering electricity to Wenshan City, Yunnan Province, China and surrounding areas.
CHAPTER IV VALUATION OF GULF
In this chapter, we will use a relative valuation model to value GULF's share price. And use relative valuation multiples: P/E ratio, P/BV ratio and EV/EBITDA ratio to estimate GULF's target share price in 2022 and 2023. First, we will analyze the trailing ratio and forward ratio of these relative valuation multiples. Next, compare GULF to selected peer benchmark companies. Below are target price forecasts for GULF stock based on different relative valuation multiples. Finally, suggestions are given through the above analysis of the relative valuation model of GULF.
4.1 Relative Valuation Model
In this chapter, all the relative valuation multiples are based on following trailing and forward financial data. The trailing value is the ratio of the current price of GULF to the actual data for the last 12 months, while the forward value is the ratio of the current price of GULF to the forecast data of GULF for the next 12 months.
Ø Historical share price
Ø Trailing and Forward P/E ratio Ø Trailing and Forward P/BV ratio
Ø Trailing and Forward EV/EBITDA ratio
4.1.1 P/E Ratio
Trailing P/E Band of GULF
Figure 4.1 Trailing P/E Band of GULF
Trailing P/E is a stock’s current market price divided by the most recent four quarters’ EPS. The figure 5.1 shows the trailing P/E band during the December 6, 2017 to March 1, 2022. The P/E ratio has fluctuated in five years. Between the May 2020 and July 2020, there had 3 times that the P/E ratio were higher than +2SD which is 129.29.
The higher P/E ratio shows that investors are willing to pay a higher share price today due to their expectations of future growth in GULF (Figure 4.1). The current trailing P/E on March 1, 2022 was 78.01, higher than 5Y P/E ratio average which was 71.11, which is lower than the +1SD band which was 100.20. Hence, in relation to itself, GULF is a little overvalued.
0 20 40 60 80 100 120 140
Dec-06-2017 Dec-06-2018 Dec-06-2019 Dec-06-2020 Dec-06-2021
12-M Trailing P/E
Trailing P/E Band
GULF - P/E +2SD (129.29) +1SD (100.20) Average (71.11) -1SD (42.02) - 2SD (12.93)
Forward P/E Band of GULF
Figure 4.2 Forward P/E Band of GULF
Rather than the trailing P/E of GULF, the P/E ratio also had fluctuated over five years. Both trailing P/E band and forward P/E band movement are not same, and the current forward P/E ratio on March 1, 2022 was 49.04. It is lower than the current forward P/E ratio (78.01), and it is indicates that GULF in the next 12 months will have s higher expectation EPS (Figure 4.2). The current forward P/E ratio lower than the average ratio, which was 59.73, and higher than the -1SD band which was 44.14.
Altogether, Gulf is undervalued to itself.
0 20 40 60 80 100 120
Dec-06-2017 Dec-06-2018 Dec-06-2019 Dec-06-2020 Dec-06-2021
12-M Forward P/E Forward P/E Band
GULF - Fwd P/E +2SD (90.92) +1SD (75.33) Average (59.73) -1SD (44.14) - 2SD (28.55)
4.1.2 P/BV Ratio
Trailing P/BV Band of GULF
Figure 4.3 Trailing P/BV Band of GULF
The current trailing P/BV on March 1, 2022 was 6.19, lower than 5Y P/BV ratio average which was 7.61, which is higher than the -1SD band which was 4.33. It is between the average P/BV ratio and -1SD P/BV ratio (Figure 4.3). So, in March 1, the P/BV ratio is over the -1SD (4.33) band, Gulf is undervalued.
0 2 4 6 8 10 12 14 16 18
Dec-06-2017 Dec-06-2018 Dec-06-2019 Dec-06-2020 Dec-06-2021
12-M Trailing P/BV Trailing P/BV Band
GULF - P/BV
+2SD (14.18)
+1SD (10.90)
Average (7.61)
-1SD (4.33) - 2SD (1.04)
Forward P/BV Band of GULF
Figure 4.4 Forward P/BV Band of GULF
The current forward P/BV on March 1, 2022 was 6.19, lower than 5Y P/BV ratio average which was 9.75. It is lower than the -1SD band, which was 6.20, on the other hand, it higher than the -2SD band which is 2.65 (Figure 4.4). Conclusion: “in relation to itself”, the firm (GULF) is undervalued.
0 2 4 6 8 10 12 14 16 18
Dec-06-2017 Dec-06-2018 Dec-06-2019 Dec-06-2020 Dec-06-2021
12-M Forward P/BV Forward P/BV Band
GULF Fwd P/BV +2SD (16.86) +1SD (13.31) Average (9.75) -1SD (6.20) - 2SD(2.65)
4.1.3 EV/EBITDA Ratio
Trailing EV/EBITDA Band of GULF
Figure 4.5 Trailing EV/EBITDA Band of GULF
The current trailing EV/EBITDA on March 1, 2022 was 43.48, higher than 5Y EV/EBITDA ratio average which was 41.76. Which is lower than the +1SD band which was 49.44. During most parts of the historical EV/EBITDA timeline, the valuations fluctuated significantly between the -1SD and +1SD bands (Figure 4.5).
Altogether, Gulf is a little overvalued to itself.
0 10 20 30 40 50 60 70 80
Dec-06-2017 Dec-06-2018 Dec-06-2019 Dec-06-2020 Dec-06-2021
12-M Trailing EV/EBITDA Trailing EV/EBITDA Band
EV/EBIT DA +2SD (57.11) +1SD (49.44) Average (41.76) -1SD (34.08) - 2SD (26.41)
Forward EV/EBITDA Band of GULF
Figure 4.6 Forward EV/EBITDA Band of GULF
The forward EV/EBITDA band, compare with trailing EV/EBITDA band from the figure 5.5, their movement is mostly the same. The current forward EV/EBITDA on March 1, 2022 was 35.14, lower than average ratio which was 39.19.
And it is higher than the -1SD band which is 30.25. So, the current forward EV/EBITDA ratio is relatively cheap to itself as it is fell above -1SD (30.25) but not more than the average band (39.19).
4.2 GULF’s Performance Compared to Peers’
In a competitive market, companies in the same industry can be compared by company multiples. Our criteria for selecting these peer companies is that they are energy companies. These benchmark companies have the same main business in Thailand and overseas and provide the same services and products to customers. In addition, peer companies in this benchmark have roughly the same profitability, and their operating activities generate stable cash flow and income for the company.
0 10 20 30 40 50 60 70 80
Dec-06-2017 Dec-06-2018 Dec-06-2019 Dec-06-2020 Dec-06-2021
12-M Forward EV/EBITDA
Forward EV/EBITDA Band
GULF - TEV/EBITDA (forward) +2SD (57.05) +1SD (48.12) Average (39.19) -1SD (30.25) -2SD (21.32)
In order to value the stock price of GULF, we choose some peer companies to analysis GULF’s performance. We will use Bgrimm Power PCL (BGRIM), Global Power Synergy PCL (GPSC), Ratch Group PCL (RATCH), BCPG PCL (BCPG) and Electricity Generating PCL (EGCO) as a solid group of benchmarks of GULF.
4.2.1 GULF’s Market Capital Compares to Peers Table 4.1 GULF’s Market Capital Compares to Peers
The market capitalization of a company can gives investors a better idea of the size of the company, and it can also be used to compare the size of one company to another (Table 4.1). GULF has the highest corporate market capitalization among the six energy companies, with a market capitalization of 16,838,123,709 USD. Companies with market capitalizations in excess of $10 billion are often referred to as large-cap companies. GULF market capitalization is more than 18 billion dollars, so GULF is also a large-cap company.
Two of the five rival companies with a market cap of more than $10 billion, Power Assets Holdings Ltd and Acwa Power Co are large-cap companies. Large-cap companies tend to produce high-quality goods and provide high-quality services. In addition to this, large-cap companies have steady dividend payments and steady company growth. Large-cap companies tend to dominate their mature industries.
Therefore, through the comparison of the company's market value, GULF, Power Assets Holdings Ltd and Acwa Power Co, as a large-cap company which are more worthy of
investment than the other competitors. Investing in GULF is a relatively conservative investment and will not generate too much risk.
4.2.2 GULF’s Multiples Compares to Peers Table 4.2 GULF’s Key Ratio Compares to Peers
Compare from net profit margin. Power Assets Holdings Ltd has the highest net profit margin is 91.07%. It means Power Assets Holdings Ltd is more efficient at converting sales into real profits. The lowest net profit margin is Yunnan Wenshan Electric Power Co Ltd, which has a net profit margin of 11.49%. GULF's net profit margin is 27.55%, which is lower than the average net profit margin. The ratio is 27.55%, that means that the company's gross profit margin is 27.55 cents for every dollar in sales. So, GULF's profit margin in 2021 is also very good.
For debt-to-equity ratios, when the debt-to-equity ratio is in the range of 2 - 2.5, it is generally considered good. This ratio means that for every 100 baht invested in a company, about 66 baht comes from debt and another 33 baht comes from company equity. BGRIM has the highest debt-to-equity ratio, which has a ratio of 4.5, and the lowest is Power Assets Holdings Ltd, which has a debt-to-equity ratio of 0.04 (Table 4.2). GULF has a debt-to-equity ratio of 2.08, which is in the range of 2-2.5. So, GULF's debt-to-equity ratio is the best.
For dividend yield, GULF's dividend yield is 0.90% which is lower than the average. It means that GULF use more money to invest their business (expend business).
Power Assets Holdings Ltd has the highest dividend yield at 5.28%. But an exorbitant dividend yield can indicate that a company's payout is unsustainable. Or investors are selling the stock, driving down the share price and therefore raising the dividend yield.
For EPS growth, GULF's five-year EPS growth rate is 29.44%. When EPS growth is above 25%, it indicates strong demand for the company's product or service.
GULF's EPS growth rate has been increasing in recent 5 years, indicating that GULF energy products are very popular in the market.
For asset turnover ratio, Yunnan Wenshan Electric Power Co Ltd has the highest asset turnover ratio, which is 70%. The higher the asset turnover ratio the better use its asset. A high asset turnover ratio indicates that Yunnan Wenshan Electric Power Co Ltd is using the company's assets efficiently. Power Assets Holdings Ltd has the lowest asset turnover ratio (1%), which means Power Assets Holdings Ltd is inefficient in using the company's assets. The asset turnover ratio of GULF is 16%, which is lower than the average, indicating that GULF will not be efficient in using the company's assets in 2021.
For times interest earned, higher times interest earned indicates good profitability of the company. From table 4.2 we can see that the times interest earned of Power Assets Holdings Ltd is the highest (11.89). It means that Power Assets Holdings Ltd can handle debt repayment without consuming the income source. This is good for long-term solvency. GULF has a low times interest earned (1.93). It means GULF has a lot of loans, and GULF needs to spend a lot of income on interest expense in 2021.
4.2.3 Relative Multiples Compares to Peers Table 4.3 GULF’s Multiples Compares to Peers
After using each company’s data to calculate the peer average, peer high, peer medium and peer low. The peer median is more used than peer average since the peer median generally gives a more appropriate idea of the data distribution. The trailing, current and forward P/E ratio, P/BV ratio and EV/EBITDA ratio of GULF are all higher than the peer median and peer average (Table 4.3). These multiples for GULF are also the highest among the other five energy companies. This means that GULF stock may be overvalued. Meanwhile, GULF's high multiple means that investors expect higher growth in GULF compared to the other five companies in the energy sector.
4.2.4 Target Price from Different Multiple Table 4.4 GULF’s Target Price
In Capital IQ we can find GULF forecasts for EPS, EBITDA and BVPS in 2022 and 2023. We assume that the number of shares outstanding for GULF will be the same in 2022 and 2023 as in 2021 (Table 4.4).
Table 4.5 GULF’s Target Share Price from Different Multiple
According to the Table 4.4 data, then we have found the EPS, BVPS and EBITDA values forecasted by GULF in 2022 and 2023. What's more, we have calculated GULF trailing and forward P/E multiple, P/BV multiple and EV/EBITDA multiple through relative valuation model. Therefore, through the formula, we can calculate the target stock price of GULF in 2022 and 2023 under different multiples.
Finally, calculate the average price target for GULF in 2022 and 2023. The target share price in 2022 is 56.06, and the target share price in 2023 is 70.85 (Table 4.5).
We will use the average price as the target price for Gulf. Because Using the P/E ratio to value stocks has its drawbacks, including the possibility that management can manipulate the earnings portion of the metric, and the possibility of overly optimistic investors pushing up the stock price, resulting in an inflated P/E ratio. One downside to the EV/EBITDA ratio is that it can produce an overly favorable number because it doesn't include capital expenditures, which can be a huge expense for some companies. P/B ratios can be less useful for service and information technology companies with little tangible assets on their balance sheets. The 5G business is one of Gulf's main businesses, so just using the P/BV ratio may not be able to accurately predict Gulf's target share price. As mentioned above, we will use the average share price to forecast Gulf's share price in 2022 and 2023.