First of all, I would like to express my sincere gratitude to all my professors at CMMU who have taught me well about management and financial knowledge, which helps me to have an open general business view and a deep understanding of financial management from both business and capital market perspectives. This feature paper showed how to value the share price of The Global Power Synergy Public Company Limited (GPSC) using the concept of relative valuation model. I used the relative valuation method to express the value of a company's stock and compared the company's value to that of its competitors or similar companies in the industry to estimate the company's financial value.
As a result, the GPSC target price based on the relative valuation method with a one-year price target is THB 46.06, compared to the current price of THB 55.25. That is why we recommend HOLD.
VALUATION
Highlights
- New capacity to drive revenue growth
- Opportunity from investment in associate and joint-venture Company diversified its investment to 3 countries, USA, Laos and Japan
- Economic growth creates growing opportunity
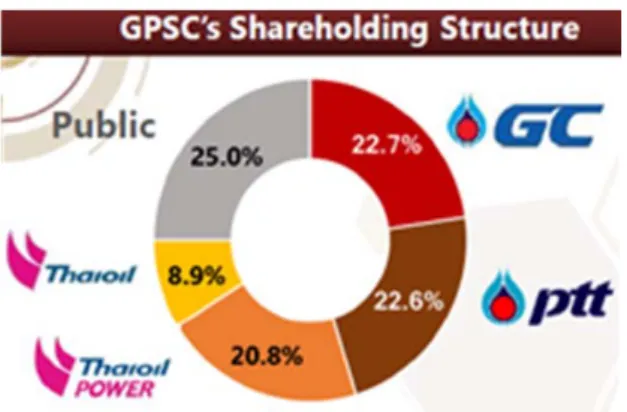
In addition, the company is investing in plant expansion in Rayong province, to support economy expansion from Eastern Economic Corridor (EEC) and also to support PTT Group's business growth. With Thailand's expected GDP in 2018 and 2019 at 4.4% and 4.2%, energy consumption is expected to grow at 1.5 times higher than GDP due to correlation between GDP and energy demand consumption in Thailand. Moreover, government policy supports more growth in demand in many projects; Electric Vehicle, High Speed Train and Eastern Economic Corridor (EEC).

Business Description
- Subsidiaries and Capacity
- Investment Opportunity
- Merger & Acquisition
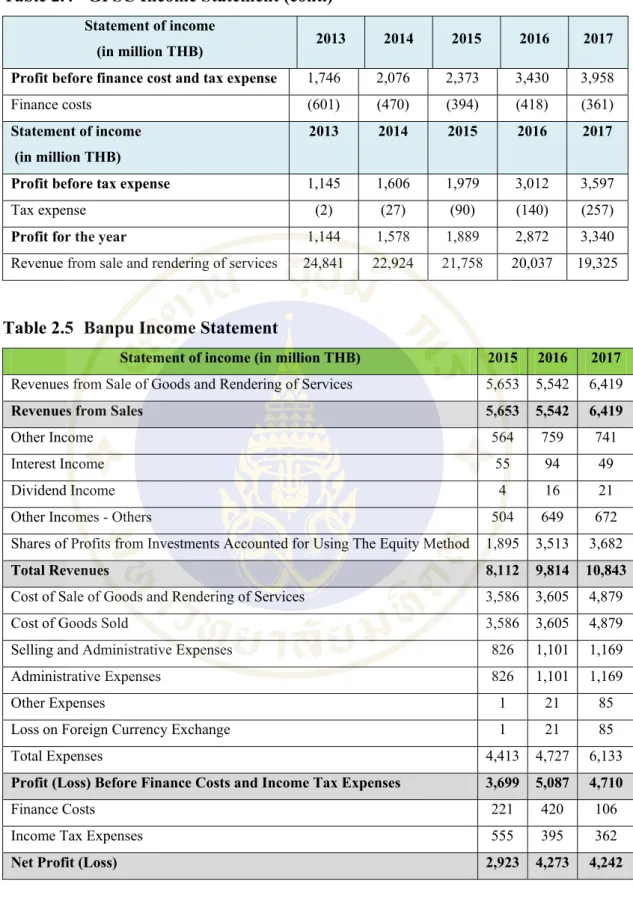
By 2020, another 4 plants (Rayong Power Plant CUP4, Navanakorn Electricity Generation expansion set, Xayaburi Power and Nam Lak 1 Power) will be fully operational. R&D is still ongoing, but at the commercial production start, GPSC will have the possibility of advanced battery with lower cost and gain a competitive advantage in Thailand. In 2018, PTT signed a share purchase contract for Glow Energy Plc, the second-ranked in terms of asset size in Thailand's electricity industry, the SET-listed company with major shareholding of Engie SA, giant French electricity utility operating in multinational.
After the merger, GPSC's power generation capacity will be the third largest in the industry with nearly three-fold increase in committed Electricity from 1,940 MW to 4,835 MW also with higher steam capacity from 1,585 ton/hour to 2,791 ton/hour.
Macro-Economic Analysis
- Macro outlook support industry growth
- Forecast of power consumption growth
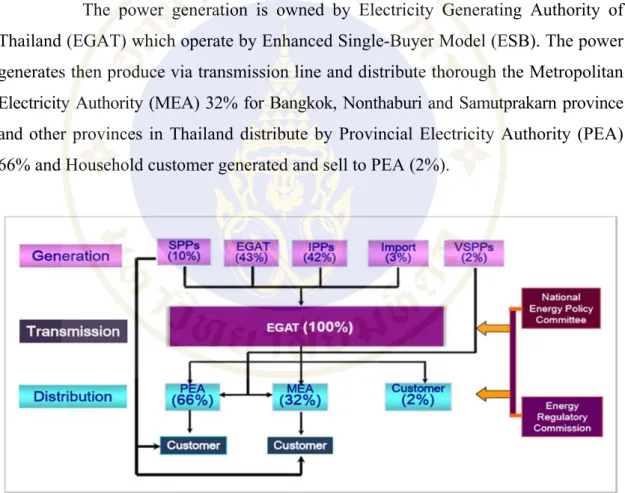
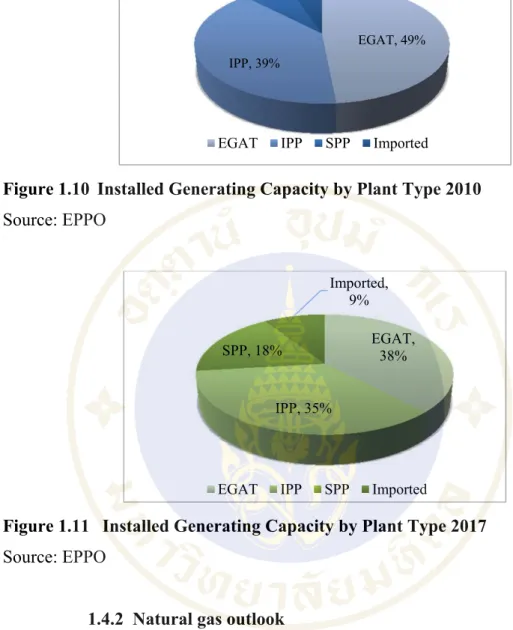
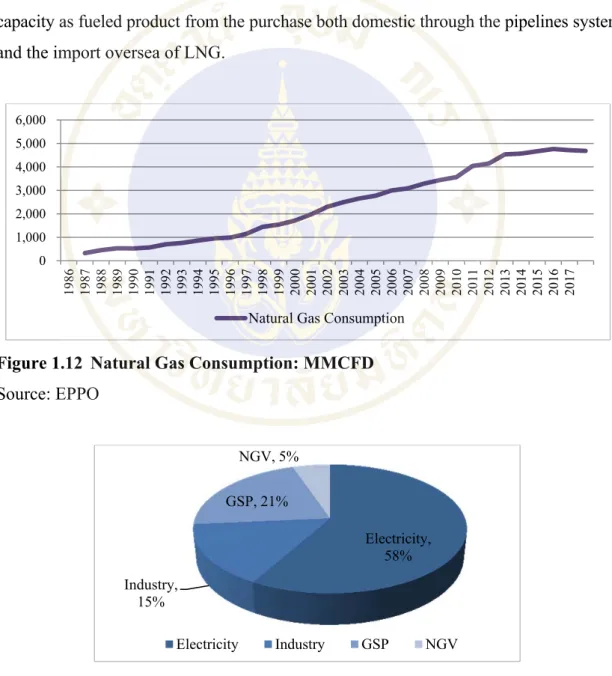
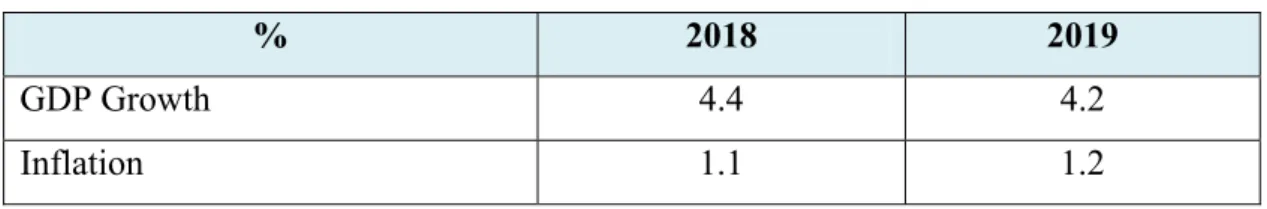
In 2017, energy consumption is lower than the GDP growth rate, which is illustrated by the energy produced in one's own household, and machine technology can work more efficiently, resulting in lower energy consumption from 2016 to 2017. From the energy consumption by sector in 2017 (Figure 1.6 Consumption of electricity by sector, 2017), the highest energy consumption comes from the industrial sector at 48%, the second is the business sector at 25% and the residential sector at a total of 24%. Electricity generation in Thailand classified by fuel type. Natural gas is the largest source of energy used in the country with 60% (Figure 1.7 Energy consumption classified by fuel type) from gas-fired power plants from natural gas coming from the Gulf of Thailand.
Once projects are operational, the power consumption from the high-speed train station will be used across the country.
Industry Analysis
- Thailand Power Industry
- Natural gas outlook
- Renewable situation outlook
- Tariff Structure
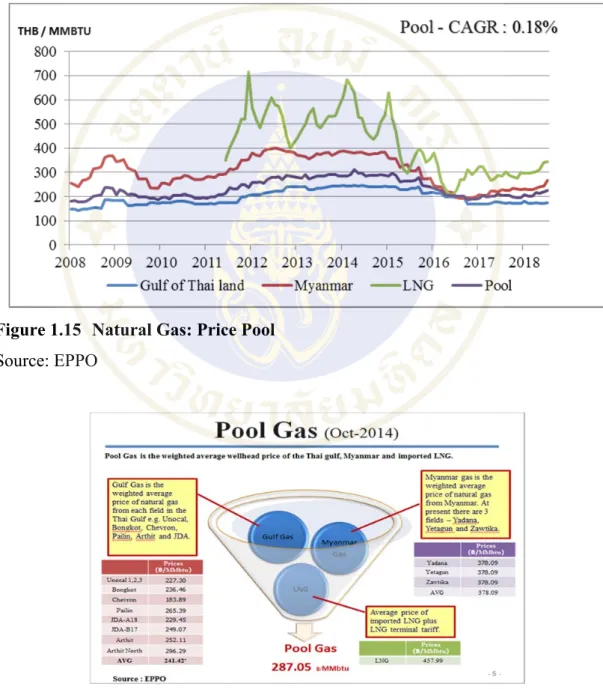
The domestic gas was distributed through the pipeline system and transported abroad and then stored in the form of liquefied natural gas (LNG). The increase was driven by escalating global oil prices and government subsidies for the use of natural gas vehicles (NGVs) also include household use of liquefied natural gas (LNG). The source of natural gas was separated between domestic supply from production in the Gulf of Thailand (73%) and the Andaman Sea.
For other services (cold water steam, etc.), the price based on the actual cost of production is the difference between the agreement with each customer.
Competitors Analysis
- Capacity
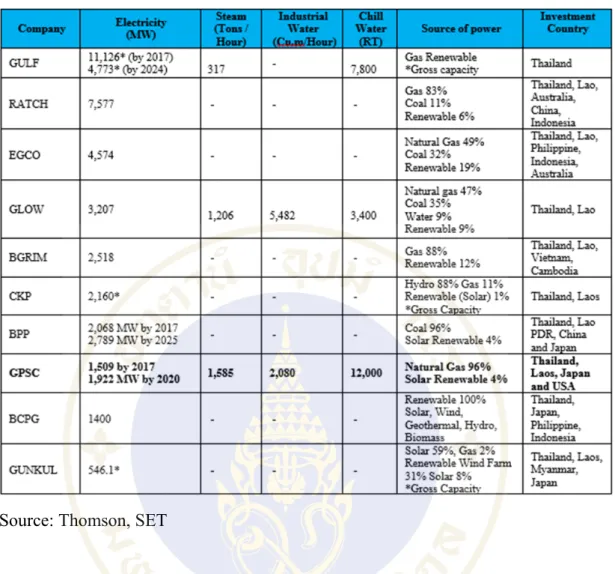
- Diversify Asset portfolio (Source of power, Renewable Power Plant) GPSC invested overseas to diversify assets portfolio. GPSC major operation
- Strength in Supply Chain
- Profit & Return on Investment
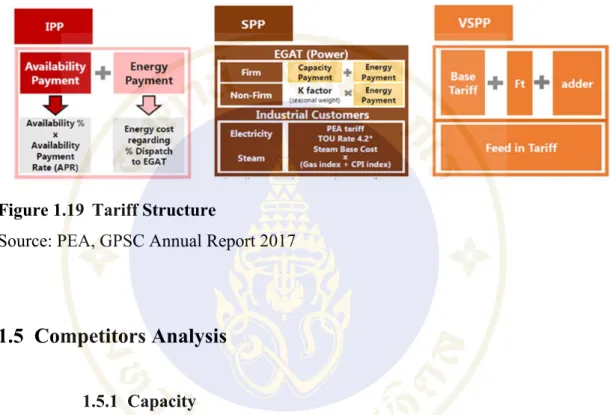
Very Small Power Producer (VSPP) Price agreement based on base tariff from EGAT plus with the Ft rate and plus adder for renewable energy production. For renewable energy, which is expected to have high growth in the future, GPSC has currently invested in 3 factories in Thailand and 1 in Japan. American investment is for the other company like R&D for battery, which expects better efficiency and advantage compared to others in the industry.
Similar to GPSC, other companies in the segment are invested in foreign country (Lao, Japan, Vietnam, Cambodia, PDR, Philippines, Indonesia and Myanmar) with the exception of Gulf based only in Thailand. Their portfolio also contained other energy sources to diversify their company, such as renewable energy from wind, solar and biomass. GPSC as a buyer can reduce the risk of raw material shortage along with lower cost advantage.
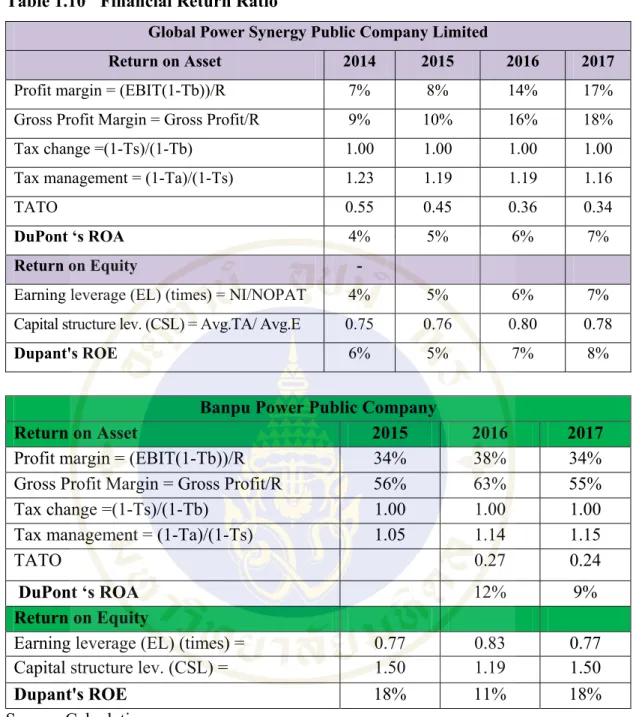
In contrast, the power plant that uses coal as an energy source will face the risk that coal cannot be supplied by a long-term contact supplier. The BCPG company has the highest net profit margin than other companies with 45.93% from their use of 100% renewable energy as energy source. Based on financial performance, the highest earnings per share EGCO is 22.45, compared to other companies in the industry they are between 0.09 and 0.62.
The return on equity (ROE), Glow, Gulf and BGRIMM have the highest range in the segment with the average ROE of 12, GPSC placed in the lower limit compared to the ratio of 8.9 below the average ROE. For the debt per equity, BPP is the lowest in peers, and GPSC and RATCH have the low D/E due to their lower financial leverage.
Relative Valuation
- Investment Summary
- Market Comparable Approach
- Trailing P/E and Forward P/E Band
- Peer Analysis
- Forecast EPS and EBITDA
- Rating Criteria
- Target price with forward P/E
- Target price with other multiples
- Sensitivity Analysis
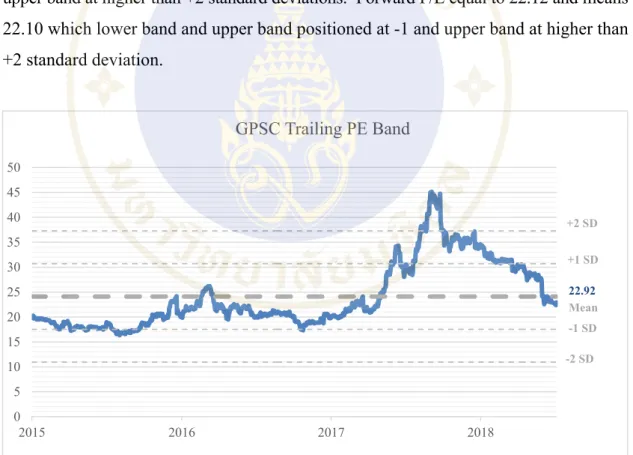
The trailing P/E equals 22.92 and means 24.11, which lower band between at -1 and upper band at higher than +2 standard deviations. Forward P/E equal to 22.12 and means 22.10 which lower band and upper band are located at -1 and upper band at higher than +2 standard deviation. Company performance and ratios are used to benchmark the equivalent of company sizes to use as a benchmark P/E.
Then calculate the standard deviation of market capitalization with lower bound -1 and upper bound +1 standard deviation. The company within the range of lower limit and upper limit determine use as the benchmark P/E where 6 companies remain. If the target price is more than 10% higher than the current market price, BUY will be recommended.
This following target share value does not take into account the differences of each comparable company, such as revenue structure, capital structure, future performance and future capacity, and therefore this valuation may not be recommended as the exact target value. Subsequent price per book value ratio (P/BV); the share valuation with the median of trailing P/BV from the comparable company equal to 1.81 times the book value per share per 23 November 2018, which corresponds to 47.77 THB per stock. The stock valuation with the median of the forward EV/EBITDA of the comparable company equal to 12.10 multiplied by the expected EBITDA in the year 2019 equal to 7,747 million THB then minus the debt 17,975 million and divided by the total number of shares 1,498 million shares.
This following target share value does not consider the differences of each comparable company such as revenue structure, capital structure, future performance and future capacity, so this valuation may not be recommended as the accurate target value. The range is through the increase and decrease of 50% from current assumption, factors are very important that influence in stock valuation.
Financial Analysis
Trend analysis , The income statement of GPSC grew revenue from sales increase 78% lower than the competitor BPP grew at 114% in the year 2017 but the net profit GPSC has higher growth at 292%% compared to BPP at 145% due to BPP has a high ratio of cost of goods sold and SG&A. The trend analysis of statement of financial position, the asset side, GPSC has an increase in cash and cash equivalents up to 62% and trading accounts increase up to 73%. BPP has an increase in cash and cash equivalents to 97.377% of long-term liabilities and trade accounts receivable to 103%.
The non-current asset GPSC increased the property, plant and equipment to 150% and investment in associates to 354% from their new power plant and the investment in Associates Company respectively. The BPP also increased the property, plant and equipment to 203% and the investment in associates and joint ventures increased to 209%. The BPP increased short-term borrowing to 517% and other current liabilities to 105%.
GPSC's equity, share capital increase to 133% and retained earnings to 142%. BPP also has an increase in authorized share capital to 156% and equity attributable to the equity owner to 360%. For financial risk ratio, GPSC has higher liquidity than current ratio which is 2.43 times compared to BPP which is equal to 0.84 times.
In terms of Cash Conversion Cycle (CCC), GPSC has 34.94 days which is slightly lower than BPP 37.46 days. In terms of solvency risk, debt to equity ratio BPP has lower debt to equity equivalent to 0.20 times compared to GPSC has 0.39 times respectively from part of long-term borrowing.
Investment Risks and Downside Possibilities
- Strategic and Business Risk .1 Investment Risk
- Market and Financial Risk
- Regulatory Compliance Risk
- Reputation Risk
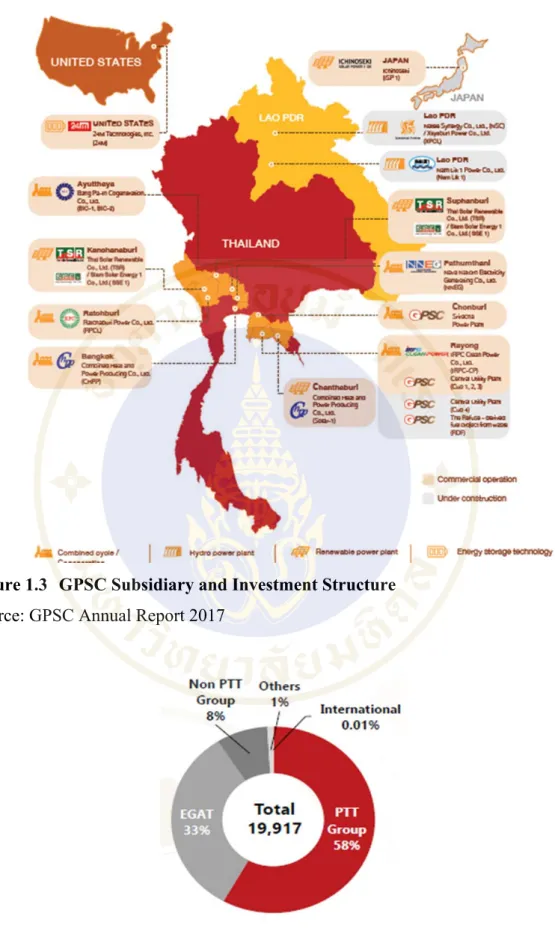
The main customers of GPSC are the petrochemicals group PTT and EGAT with a participation of 58% and 33% respectively, the industrial consumer (IU) which is considered to be only 8%. Likewise, if the demand for EGAT capacity decreases or if the EGAT transmission has any shutdown event, GPSC will lose its sales revenue. For IU, customers have long-term purchase agreements, but at expiration there is a risk of non-renewal.
The chances of the IU not being renewed are considered to be low to high conversion costs, including equipment, distribution system development, staff technical knowledge and opportunity costs for wasted time, until the overall operation is up and running. Furthermore, both income and expenses for the facility are in USD, so the risk is mitigated by natural currency matching. In a few years, the construction plan shows that there will be dividend income from investment in affiliate in Laos, Japan and the USA, which GPSC must be aware of and keep a close eye on the market.
In 2017, the company managed this risk by issuing debentures to investors to fix interest rate and repay part of floating rate loan. GPSC plans to raise capital from both the PTT group and borrow through the money market, which could be a loan or offer a new bond. So, interest rate risk may not be high depends on GPSC efficient capital structure management.
Under many regulations that must be complied with, actions that are not complied with will be presumed to be illegal by law. The unit specific function is to supervise all functions in the group to strictly comply with applicable rules and regulations.
DATA
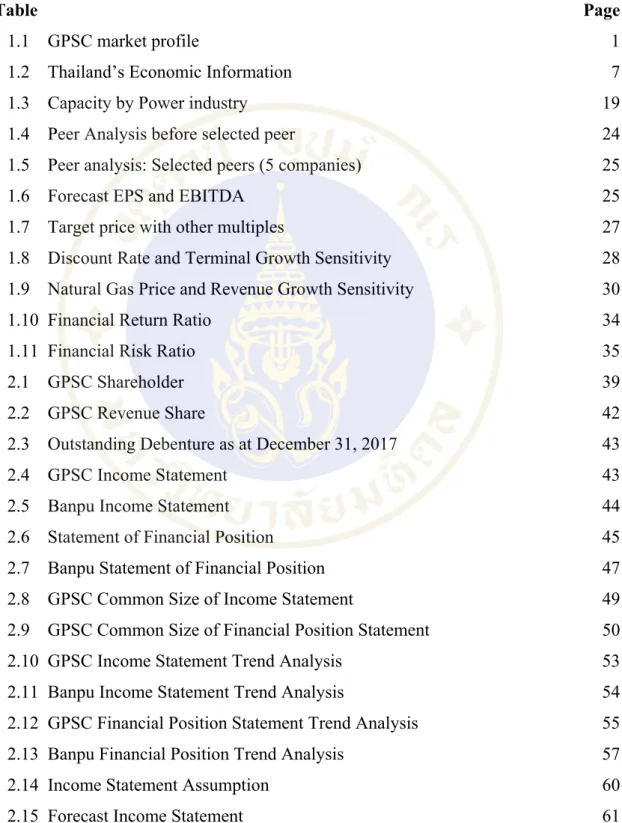
GPSC Shareholding Structure
GPSC Organization Chart
GPSC Business Portfolio
Capacity and Revenue Breakdown
GPSC Value Chain
History Natural Gas Pool Price
GPSC Revenue Share
Debenture
Financial Analysis
- Income Statement
- Statement of Financial Position
After deducting the current portion of the long-term liabilities. Long-term loans from financial institutions, after deduction of the current portion of post-employment benefits.
Common Size Analysis
- Income Statement Common size Analysis
- Common Size of Financial Position Statement
Trend Analysis
- Income Statement Trend Analysis
- Financial Position Statement Trend Analysis
Forecast Financial Statement .1 Income Statement