PUBLIC COMPANY LIMITED
KULRAT CHANOPAT
A THEMATIC PAPER SUBMITTED IN PARTIAL FULFILLMENT OF THE REQUIREMENTS FOR THE DEGREE OF MASTER OF MANAGEMENT
COLLEGE OF MANAGEMENT MAHIDOL UNIVERSITY
2022
COPYRIGHT OF MAHIDOL UNIVERSITY
ACKNOWLEDGEMENTS
I would like to express my gratitude to my advisor, Prof. Roy Kouwenberg, for his guidance and support through the process of this thematic paper. I would also like to thank Dr. Simon Zaby and Dr. Worapong Janyangyuen who are committee members for my thematic paper.
Special thanks to Ms. Kanokkwun Saengrut for helping and guiding me throughout this thematic paper and all the courses. I would also like to thank to my classmates for their helps and memorable experiences while studying at CMMU.
Finally, I would like to thank my family who support me throughout my study at College of Management Mahidol University.
Kulrat Chanopat
RELATIVE VALUATION OF JMT NETWORK SERVICES PUBLIC COMPANY LIMITED
KULRAT CHANOPAT 6449002
M.M. (CORPORATE FINANCE)
THEMATIC PAPER ADVISORY COMMITTEE: PROF. ROY KOUWENBERG, Ph.D., CFA, ASST. PROF. SIMON ZABY, Ph.D., WORAPONG JANYANGYUEN, Ph.D.
ABSTRACT
This thematic paper applied the relative valuation approach to derive the target value of JMT Network Services Public Company Limited (JMT). The historical multiple bands are applied to identify whether the current price of the company is under or overvalued compared to its 5-year average. By using P/E and EV/EBITDA, JMT is currently overvalued. However, the company is undervalued based on the P/BV band.
The peers group multiples are also applied together with financial ratios to check whether JMT has suitable peers. Even though JMT is similar to BAM and CHAYO in terms of the financial ratios, the most significant difference is due to their market capitalization and types of debts managed. Therefore, the historical valuation method is selected as the most appropriate approach for valuation of JMT. By using 5-year average multiples of JMT, it results in the target price of 54.10 baht for 2022 and 67.83 baht for 2023. These numbers show a downside of -29.28% and -11.33% accordingly compared to the current price on 3 August 2022 which is 76.5 baht. Therefore, JMT is recommended to “Sell” as the target price is lower than the current price for more than -10% in 2023 based on relative valuation. However, other factors such as business growth potential and strategy also have to be taken into consideration as well.
KEY WORDS: Relative valuation/ Historical Valuation Bands/ Peer Group Multiples
45 pages
CONTENTS
Page
ACKNOWLEDGEMENTS ii
ABSTRACT iii
LIST OF TABLES vi
LIST OF FIGURES vii
LIST OF ABBREVIATIONS viii
CHAPTER I INTRODUCTION 1
CHAPTER II BUSINESS DESCRIPTION 3
2.1 Company’s Group Structure 3
2.2 Products and Services Characteristics 4
2.3 Revenue Structure 7
2.4 Marketing and Business Strategy 9
2.5 Corporate Governance 11
2.5.1 Major shareholder 13
CHAPTER III MACROECONOMICS, INDUSTRY, AND
COMPETITION ANALYSIS 14
3.1 Macroeconomic analysis 14
3.1.1 Global and Thai GDP 14
3.1.2 Interest rate, Inflation rate and Exchange rate 15
3.2 Industry analysis 17
3.3 Competition analysis 20
CHAPTER IV VALUATION 21
4.1 Financial Analysis 21
4.1.1 Growth Analysis 21
4.1.2 Dupont Analysis 22
CONTENTS (cont.)
Page
4.2 Relative Valuation 23
4.2.1 Historical multiple bands 23
4.2.2 Peer group multiples 31
4.3 Valuation Recommendation 38
CHAPTER V INVESTMENT RISKS 40
CHAPTER VI CONCLUSIONS 42
6.1 Investment Recommendation 42
6.2 Triggers for Re-assessment 43
6.3 Limitations 43
REFERENCES 44
BIOGRAPHY 45
LIST OF TABLES
Table Page
1.1 Market Profile 1
2.1 Revenue Structure 7
2.2 Income Statement 8
3.1 JMT and Peers Summary 20
4.1 ROE Benchmark with Competitors 22
4.2 Target Price 29
4.3 Sensitivity Analysis 30
4.4 Expected Price Summary 31
4.5 Peer Group Trailing Multiples 32
4.6 Peer Group Forward Multiples 34
4.7 Peer Group Financial Ratios 36
4.8 Expected Price 37
4.9 Sensitivity Analysis and Expected Price Summary 38
LIST OF FIGURES
Figure Page
2.1 Company’s Group Structure 4
2.2 Major Shareholders of JMT 13
3.1 Global and Thailand GDP Growth 15
3.2 Global and Thailand Inflation 16
3.3 Thailand’s Interest Rate 17
3.4 JMT’s Net Profit 19
4.1 JMT’s Growth Rate 21
4.2 Trailing P/E Band 24
4.3 Forward P/E Band 25
4.4 Trailing P/BV Band 26
4.5 Forward P/BV Band 26
4.6 Trailing EV/EBITDA Band 27
4.7 Forward EV/EBITDA Band 27
LIST OF ABBREVIATIONS
BAM Bangkok Commercial Asset Management Public Company Limited
BV Book Value
CAGR Compound Annual Growth Rate CHAYO Chayo Group Public Company Limited
EBITDA Earnings Before Interest, Taxes, Depreciation, and Amortization
EPS Earnings Per Share
EV Enterprise Value
EV/EBITDA Enterprise Value to Earnings Before Interest, Taxes, Depreciation, and Amortization ratio
GDP Gross Domestic Product IMF International Monetary Fund
JMT JMT Network Services Public Company Limited KCC Knight Club Capital Asset Management Public
Company Limited
P/BV Price to Book Value Ratio P/E Price to Earnings Ratio
ROE Return on Equity
SET Stock Exchange of Thailand
TH Tong Hua Holding Public Company Limited
CHAPTER I INTRODUCTION
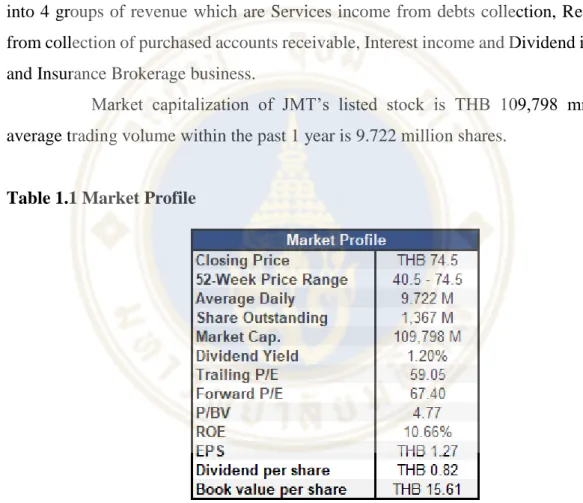
JMT Network Services Public Company Limited (JMT) has registered to be an asset-management company (AMC). The company’s services can be decomposed into 4 groups of revenue which are Services income from debts collection, Revenues from collection of purchased accounts receivable, Interest income and Dividend income and Insurance Brokerage business.
Market capitalization of JMT’s listed stock is THB 109,798 mn. The average trading volume within the past 1 year is 9.722 million shares.
Table 1.1 Market Profile
Source: SET and Capital IQ
Thailand's household debt has been rising for years. According to Bank of Thailand, household debt at end of the third quarter 2021 was 14.34 billion baht. This accounts for 89.3% of the country's GDP and grew by 300 billion baht year-over-year.
This indicates the economic slowdown caused by Covid-19 may increase future household debt.
Even though the Covid-19 pandemic slowed the economy in 2021, the company adjusted its operating strategy and management to account for economic risks, leading to significant performance growth in business operations. The company's performance has been outstanding for 6 years in a row, both for debt collection and operation.
In relative valuation analysis, the information about price to earnings (P/E), price to book value (P/BV), enterprise value to earnings before interest, taxes, depreciation & amortization (EV/EBITDA) are utilized to derive the target price of JMT in 2022 and 2023. The historical multiple bands with 5-year data are applied to plot the average and standard deviation to observe how the current multiple ratios perform. The results show that in terms of P/E and EV/EBITDA, the company is overvalued. On the other hand, the P/BV band shows that the company is undervalued.
Compared to the peers which are BAM, CHAYO, TH, and KCC, JMT has the highest trailing P/E ratio while BAM has the lowest. KCC has the highest trailing P/BV and EV/EBITDA while BAM and CHAYO have the lowest value accordingly.
On the other hand, KCC has the highest forward P/E ratio while BAM is the lowest. For forward P/BV and EV/EBITDA, JMT has the highest value while BAM and TH have the lowest value respectively.
The recommendation is based on the target price computed using historical valuation bands. The current price as of 3 August 2022 is 76.5 baht. The target prices 5- year average multiples are 54.09 baht for 2022 and 67.82 baht for 2023. This shows a downside of -29.29% and -11.34% accordingly compared to the current price. As the percentage of downside shows a continuing negative trend in 2023, JMT is recommended to “Sell”.
CHAPTER II
BUSINESS DESCRIPTION
JMT Network Services Public Company Limited (“the Company”) was established in 1994 with paid-up capital of 5 million baht by Jay Mart Group to operate a debt collection service, business prosecution, and execute lawsuits across Thailand.
The Jay Mart Group has expertise in selling various brands of electrical appliances before entering the mobile phone retail business. In 2006, the business expanded to the non-performing debt management services and service business for car-rent purchase loans, respectively. The Company registered its conversion to a public company limited on April 19, 2012 and registered to the Stock Exchange of Thailand on November 27, 2012. As of December 31, 2021, the Company has a registered capital of 764,571,745.00 baht and has a paid-up registered capital of 683,655,056.00 baht, divided into 1,367,310,111 common stocks with a par value of 0.50 baht per stock.
Vision of the company is to be the Number-One debt collection service provider across all areas. Mission is to be a leader in debt management and aim for excellence in ethics of human resource management and operation in accordance with the principles of good governance to shareholders, business partners, customers, employees and society. (JMT, 2021)
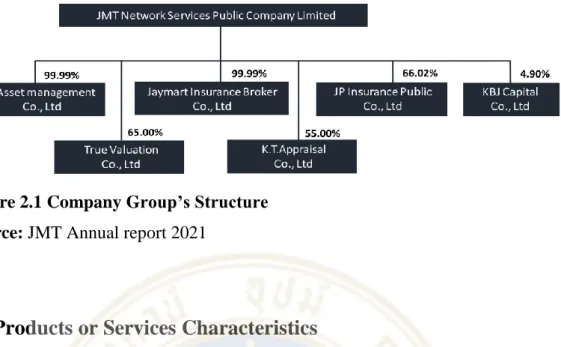
2.1 Company’s Group Structure
The core business of the company consists of 3 main businesses: debt tracking business, debt management and insurance, and insurance brokerage business, which are under the group of companies of JMT Network service, the major shareholder, The group structure of JMT Network Services Public Company Limited is as follows as of 31 December 2021;
Figure 2.1 Company Group’s Structure Source: JMT Annual report 2021
2.2 Products or Services Characteristics
At present, the company, its subsidiaries and investment companies, operate in 4 main businesses comprising debt collection service business, non-performing debt management business, insurance business, and insurance brokerage business.
The details are as follows:
1) Debt tracking and collection service business
The company is a debt collection service provider for the non-performing debt that the creditor cannot/ does not desire to track due to the cost. The service covers all types of debt such as personal loan debt, credit card debt, debt for utilities, service charges debt, and etc. Various creditors (clients) will send the names and information of debtors to the company. The company will search for additional debtor information, check and follow up with debtors, and negotiate with each debtor for debt repayment under the conditions that the company gets permission from the client at a percentage of the debt that the company is able to follow up and agree to allow the debtor to pay the debt.
As of December 31, 2021, the company has been assigned by the clients to follow up debts in the amount of 31,573 million baht. The main clients are financial institutions and hire purchase companies.
In addition, the company also provides other services related to the debt collection service business such as providing legal services on execution of all types of liabilities. The company received profits in the form of service charges and fees in percentage of the amount received from the debt repayment from the execution.
The debt tracking and collection services consists of three main process as follows:
A. Phone Collection
This is the first process of debt tracking and collection service. First, the company receives debtor’s information and inputs this information into the database of the debt tracking system. Then, the phone collector, who is responsible for each specific debtor of the client, will make a phone call to the debtor to negotiate for the debtor to pay back the debt.
B. Field Collection
This is the process where the company sends out the field collector to facilitate payment collection for certain types of clients or to track the debt in some important cases. The field collection is normally used with the debtors who have a considerably high amount of debt and are more difficult to track.
C. Filing a lawsuit for enforcement of debt repayment
This is the last step in the case that debtors do not wish to pay back debt.
The company will consult with the client in hiring a company’s lawyer to draft and send a suing request to prosecute against the debtors who are unable to pay the debt.
2) Non-performing debt management business
The company operates a non-performing debt management business by purchasing non-performing debt from financial institutions or companies that have general policy for non-performing debt sales. Normally, financial institutions will use debt auction methods. The creditors will allow companies that specialize in debt collection to bid for non-performing debts at a discounted price from the full debt, which the auctioneer has to administer and bear the risk of collecting the auctioned debts.
The company, with expertise in analysis for personal debt collection and expertise in debt collection for more than 20 years, has enabled the business to analyze and assess opportunities for effective debt collection and success in business operations by choosing to bid on the debt that the company has specialization in debt collection only. The company will compare the debt’s information with the company’s database from the debt tracking service to estimate the success rate and expenses throughout the target period of debt collection. The company also has to estimate the target rate of
return from investing in non-performing debt management in order to assess and determine the price for bidding.
In terms of debt management and debt collection, the company will estimate the amount of debt collected quarterly, then the company will compare this amount to the actual amount from debt collection. If the amount of debt collected is lower than the estimated amount, the company will impose a policy to increase debt tracking and collecting process as well as adjusting estimation of debt collection to be appropriate with the company’s policy and current situation.
As of December 30, 2021, the company has non-performing debt under management, with a total book value of investment equal to 16,381 million baht.
3) Insurance brokerage business
The company provides various types of insurance brokerage services. The income structure reflects the portion of the return commission from the customer’s insurance premium. This is a business that has low risk in terms of product impairment because it does not require inventories or policies from the business. The Company;
therefore, acts as a broker who points out insurance channels between customers and insurance companies.
4) Non-life Insurance business
The company’s products can be categorized into two types which are motor- insurance and non-motor insurance. The list of products for each category are as follows:
1. Motor Insurance
● Compulsory Motor Insurance
● Voluntary Motor Insurance 2. Non-Motor Insurance
● Fire insurance
● Marine/Cargo insurance, Inland transit insurance, Carrier liability insurance
● Miscellaneous
○ Accident insurance
○ Travel insurance
○ All risk insurance
○ Public liability insurance
○ Contract work insurance
○ Burglary insurance
○ Professional liability insurance
○ Engineering insurance including all types of risks of construction contractors, insurance for all risks of machinery installation contractors, boiler and pressure vessel explosion insurance, and machine insurance
○ Insurance for money
○ Billboard insurance
○ Product liability insurance
○ Insurance for the liability of directors and executive officer of the company
○ Statutory liability insurance arising from the operation of controlled business type 3 for petrol service station
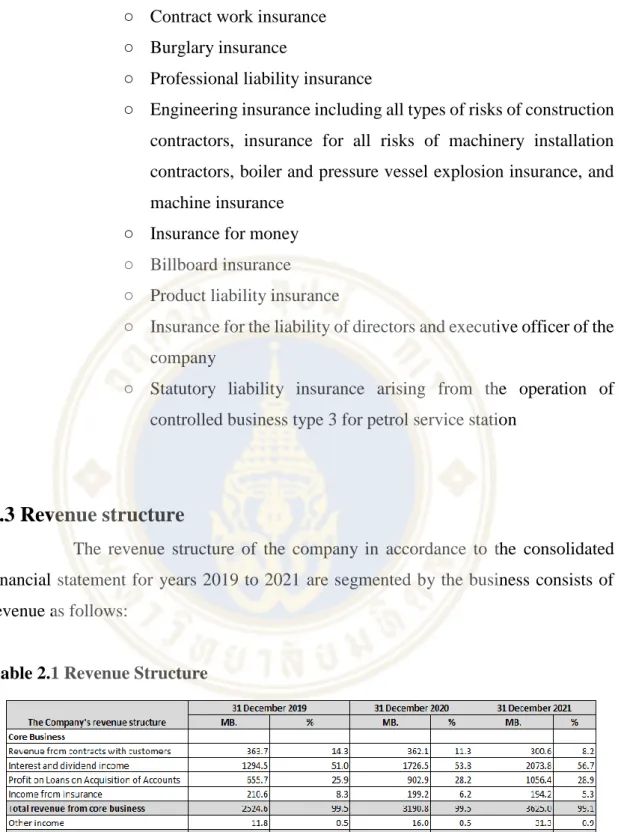
2.3 Revenue structure
The revenue structure of the company in accordance to the consolidated financial statement for years 2019 to 2021 are segmented by the business consists of revenue as follows:
Table 2.1 Revenue Structure
Source: JMT Annual report 2021
For the revenue from contracts with customers, this includes income from debt collection services, income from legal services and prosecution, and insurance
commission income which is the income from the main business of its subsidiary. For interest and dividend income, it includes interest income from loans from purchases of non-performing debtors and income from dividend income. For income from insurance, it includes insurance income from business operations of JP Insurance Public Limited Company, which is a subsidiary that the company has invested in the proportion of 60.02%. Other income includes interest received from back deposits and profit (loss) from investment in financial assets.
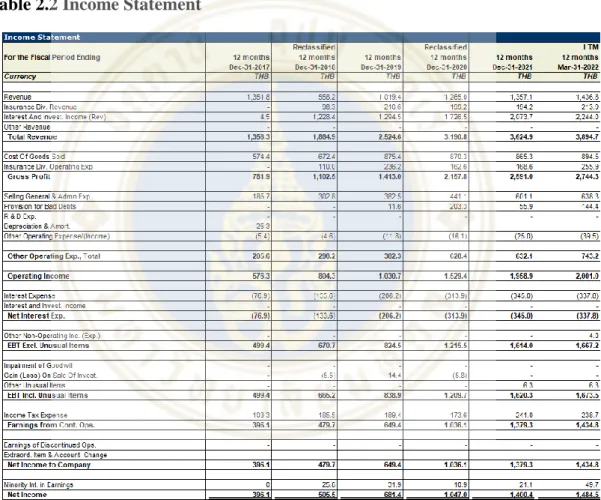
Table 2.2 Income Statement
Source: S&P Capital IQ
The table 2.2 shows the income statement of JMT which represents revenues and profits over the past five years. The figure shows that the total revenue of JMT has been increasing over the past few years. In addition, the gross profit and net income also increases as well. It can be seen that the amount of revenue and net income since 2019 has been increasing significantly more than the previous level. This is partly due to the
Covid-19 situation that caused an increase in non-performing debt amount from financial institutions.
2.4 Marketing and Business Strategy
1) Debt tracking and collection service business
Experience in debt tracking and maintaining the seller’s reputation
The company has more than 20 years experience in debt collection.
Therefore, the company has a database on debt collection and is able to manage debt collection by choosing the appropriate method that suits each type of debt and debtor’s behavior. Furthermore, the company also has training programs and policy to control the debt collectors and make sure that they treat the debtors with polite manner while still following the company’s standard strictly to maintain reputation of the company and sellers of debt to the company.
Distribution and Service and distribution channel
The company clearly categorizes employees into each specific department of service, one is for debt tracking and another one is for non-performing debt management. For debt tracking and collection service, the debt tracking employees will negotiate with debtors to pay back debt through the specified channel set by the client.
For non-performing debt management, the debtors will be able to pay back debt at different channels provided by the company such as at commercial banks and other payment service providers.
The Company aims to maintain its leadership in the debt collection service business with a plan to keep the balance of receivable debtors of 10,000 million baht.
The Company is mainly focusing on expanding services to financial institutions customers both in the existing customers and new customer groups. A guideline to achieve its goals is as follows:
Focusing on the quality of debt collection services that meet the standard and are efficient to customer satisfaction. There must be no complaints about the quality of service from customers.
Developing information systems and collecting up-to-date information for the system to be updated in every circumstance.
2) Non-performing debt management business
The Company has a goal to buy more non-performing debt to manage, with a short-term goal to buy the full amount of debt in an average of no less than 30,000 million baht per year. The main focus and implementation are as follows:
Bidding conservatively at auctions under careful growth policy.
Developing a database for carefully monitoring and evaluating debt collection before proceeding and conducting an auction bid.
Using capital and tracking costs carefully and thorough evaluation of debt collection and costs on a quarterly basis.
In 2021, the company bought debts to manage in the amount of 32,561 million baht from various financial institutions that contain a policy in selling more non- performing debt portfolios.
3) Insurance broker business and Non-life insurance business
Market condition of the insurance and non-life insurance broker in 2021 is considered to have high competition. Due to the high number of players in the market, the company has a strategy to expand its sales channels through telemarketing and social media platforms through brokers both small and large. Also, the company directly sells insurance through the company’s platforms such as Facebook and Line applications.
The company also plans to expand further because of the potential that non-life insurances are mostly sold through social media platforms, especially compulsory insurance such as motor insurance. Moreover, technology nowadays also plays a significant role in insurance sales, especially for InsurTech, which will be an upcoming trend of insurance business in the future.
Moreover, the company aims to expand the insurance business by increasing the proportion of insurance customers, or adding insurance plans with a damage rate that the company can manage to create positive returns for shareholders. The company aims to increase the proportion of outside car insurance and use distribution channels through companies in the company's group.
To conclude, the company intends to proceed as follows:
Expanding marketing business channels to respond to both internal and external customers.
Expanding to online markets via websites.
Expanding channels through Jay Mart mobile phone stores across branches.
Expanding channels through company’ partners.
Expanding channels through telephone sales agents (Telesales).
The company sees it as an interesting business because there is no risk of impairment of goods and services in the insurance brokerage business.
2.5 Corporate Governance
According to the JMT Annual Report in 2021, the company perceives an importance in efficient management which emphasizes transparency and accountability.
This helps boost the confidence of all parties involved and result in sustainable business growth under ethical operation in accordance with relevant laws and regulations. The company, therefore, has established a policy of good corporate governance to enhance existing operations to have a clear standard system and spread the practice to employees of the company at all levels. This is to foster a true corporate governance culture. The company has also adopted Good Corporate Governance guidelines for listed companies in year 2006 as set by the Stock Exchange of Thailand which covers 5 categories as follows (JMT, 2021):
The First Category: Rights of shareholders
The company places an importance on the rights of shareholders which may not be limited to the rights stipulated by laws. This is to not act in a manner that violates or deprives the rights of shareholders. The company also encourages shareholders to exercise their rights. The fundamental rights of shareholders are such as purchasing, selling, or transferring shares, obtaining sufficient news and information of the company, and attending the meeting to exercise rights to vote.
The Second Category: Approach to the shareholder equity
The company has a policy to provide shareholders with equal and fair treatment.
The Third Category: The role of interest person
The company places high importance on taking care of all the stakeholders both internally and externally. The internal interest persons are such as shareholders,
employees, and administrators. The external interest persons include customers, creditors, competitors, business partners, society, communities, and government sectors.
This is because the support and opinion from all the stakeholders will be beneficial in the business process and development of the company. Therefore, the company will follow the related laws and regulations to maintain rights of interest persons. Also, the company will not behave in any manners that violates rights of interest persons.
The Fourth Category: Information disclosure and transparency
After the company has been listed on the Stock Exchange of Thailand, the board of directors will place importance on the disclosure of information that is accurate, complete, timely and transparent. The company will also report both financial and general information that is important and has an effect on stock price and other information in accordance with the regulations of the Securities and Exchange Commission and the Stock Exchange of Thailand. Furthermore, the company has a policy to disclose information to shareholders, investors, and the public through various channels including the company’s website which will frequently update the information.
The Fifth category: Responsibility of committee 1. Board of directors structure
The company’s board of directors has a role to determine the organization’s policy including accessing and evaluating company’s operations to be in accordance with the plan. The committee will consist of 7 members who will hold the position for 3 years. Out of these 7 members, 4 of the members will come from the administrative department, and the other 3 members from non-administrative departments. There will be 3 independent committee members in accordance with the rules imposed by the Securities and Exchange Commissions that the listed company board must consist of independent committees greater or equal to one third of the total board members. The company’s directors consist of experts from various industries including business, accounting, and finance which are all related and support all of the company’s business.
2. Roles and Responsibility of the board of directors
The board of directors is responsible for considering and approving important matters of company operations including vision and mission, strategy, goal, plan, and budget. The board of directors also has to supervise the management to efficiently and effectively operate in accordance with policies and plans.
2.5.1 Major shareholder
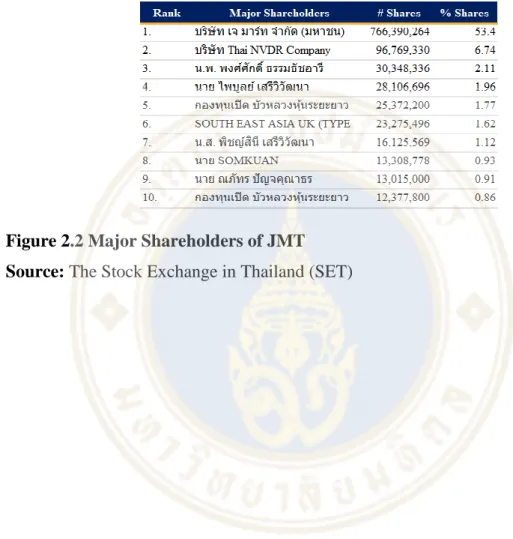
Following the latest information from the Stock Exchange in Thailand (SET), Percent Shares in Minor Shareholders (% Free float) is 45.93% of total shareholders. The top 10 of major shareholders follows the table below.
Figure 2.2 Major Shareholders of JMT Source: The Stock Exchange in Thailand (SET)
CHAPTER III
MACROECONOMICS, INDUSTRY, AND COMPETITION ANALYSIS
3.1 Macroeconomic Analysis
3.1.1 Global and Thai GDP
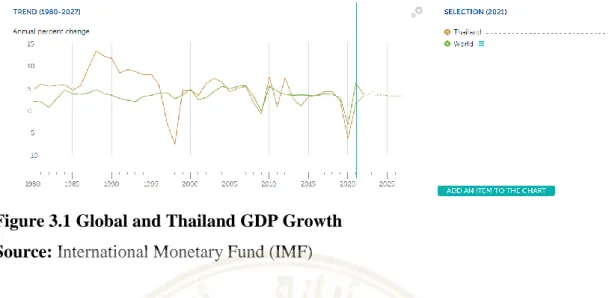
According to the International Monetary Fund (IMF), it can be seen from figure 3.1 that the historical GDP growth of both global and Thailand declined significantly from 2019 to 2020, which is the impact from Covid-19. In 2020, the global GDP growth rate fell to about -3.1% while it was about -6.2% for Thailand. However, the growth started to rise again to about 3.6% for global and 3.3 % for Thailand in 2021.
For the future forecasted growth, the International Monetary Fund (IMF) forecasted that the GDP growth of both global and Thailand from 2022 onwards will remain relatively stable at the level it was at the end of 2021 of about 3% to 4%.
The Coronavirus disease 2019 (Covid-19) pandemic negatively impacts every segment around the world. From the company’s annual report, it is also stated that the Covid-19 is having an impact on all businesses and industries. On one hand, the impact of Covid-19 which leads to economic downturn seems to be positive for JMT as the demand for bad debt collection by banks will increase. On the other hand, the pandemic also negatively affects the company in terms of uncertainties in the operations as well as the company’s ability to receive payment from debtors. Hence, it possibly leads to an impact on the company’s future performance and cash flow.
Figure 3.1 Global and Thailand GDP Growth Source: International Monetary Fund (IMF)
3.1.2 Interest rate, Inflation rate and Exchange rate
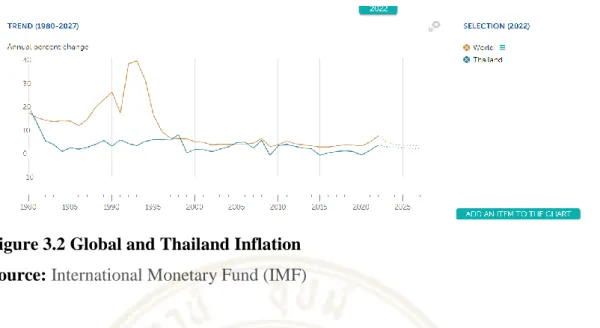
The historical rates of inflation for the global economy were about 2 to 3 percent during the past few years, and the rates were 1 percent or below for Thailand.
According to figure 3.2 from the International Monetary Fund (IMF), the inflation rates since 2020 have been increasing significantly to about 7.4 percent for global inflation and 3.5 percent in Thailand in 2021. In terms of forecasted inflation rates, the forecast from the International Monetary Fund (IMF) shows that the inflation rates from 2022 onwards will fall down slightly from the previous year.
Due to the fact that inflation is high recently, it is also expected to increase further throughout 2022 from the factors of energy and food price which put higher pressure on purchasing power of households. High inflation, when the income is in slow recovery phase due to the fragile labor market, will affect real income and purchasing power which will lower debt payment ability. In particular, low income people who spend more than half of their total expenditure on food and energy may need to incur additional debt when their income is inadequate as their expense accelerates from inflation. This means the company might be negatively affected from high inflation as debt paying ability will be lower. However, as the amount of debt increases, the demand for debt collection from the banks will also increase as well and this is beneficial for the company.
Figure 3.2 Global and Thailand Inflation Source: International Monetary Fund (IMF)
There is a relationship between interest rate and inflation. To clarify, the policy interest rate affects inflation control, and it is also considered as an important tool in reducing the severity of inflation. Although the interest rate does not directly affect inflation, the way that the interest rate affects incentives in depositing and borrowing can cause interest rate adjustments to affect inflation. By raising interest rates, this will cause more money to flow into the banking system, which means money or liquidity circulating in the economy will decrease. This leads to a decline in price of goods and services which ultimately lead to lower inflation. Hence, when there is high cost of living or inflation, a rising interest rate is one of the methods that can be used to deal with the situation.
In addition, an adjustment in interest rates can also imply the rise or fall of deposit and borrow rates. The policy interest rate tends to have a positive relationship with the deposit and borrow rates as they tend to move in the same direction. Therefore, an increase in interest rate incentivizes more bank deposits as the return from deposit is higher. This, at the same time, will also lower incentives for borrowing as the cost of interest to be paid is higher. On the other hand, a reduction in policy interest rate has an opposite effect as it will encourage more borrowing and less of depositing.
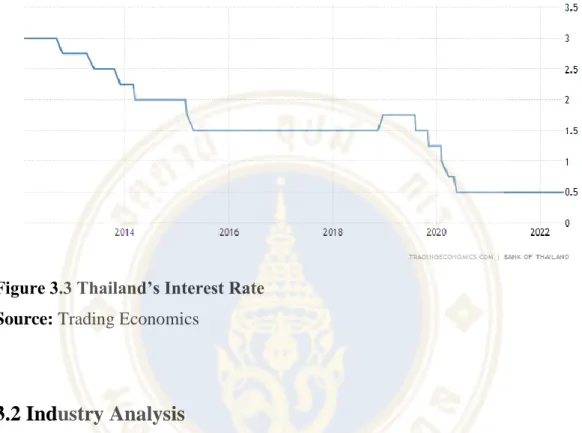
According to the Bank of Thailand, the interest rates of Thailand started to fall in 2019 and it remained at about 0.5% from the early of 2020 until now as can be seen in the figure 3.3. It can be seen that the interest rate is relatively low compared to the past few years. By having a low interest rate, the company might be able to benefit from an increase in borrowing amount in which it might increase the amount of debt in
the system. However, inflation is also a factor that should be considered together with interest rate as it might also affect the ability of debtors to pay back debt. Therefore, the next direction of the Bank of Thailand in adjusting an interest rate to deal with inflation is also important for JMT as the company business relies heavily on the interest rate.
Figure 3.3 Thailand’s Interest Rate Source: Trading Economics
3.2 Industry Analysis
In terms of industry, JMT operates in the financial sector and the company is considered to be one of the asset management businesses in Thailand. The trend of asset management business tends to have relatively few large players within the industry due to the type of business that is very specific.
Over the past few years, the situation of household debt in Thailand has been increasing continuously. According to the Bank of Thailand, household debt at the end of quarter 3 in 2021 was about 14.34 billion baht. This accounts for about 89.3% of total GDP of the country in which it increased by 3 hundred billion baht on a year on year basis. This means the economic slow down due to the situation of Covid-19 might increase the chance that the household debt will rise further in the future.
With the current economic condition that results in a high household debt, businesses that operate in the industry can consider this as an opportunity to generate more revenue and profit. This is because the asset management business has become an
important mechanism for stabilizing the financial institution system in Thailand through the role of purchasing and managing non-performing loans (NPLs) from financial institutions. Thus, financial institutions do not have to set additional reserves and can provide loans to the business sector smoothly which leads to a positive impact on the circulation of the economy in the country.
An increase in non-performing debt will be an opportunity for asset management companies that are well prepared in terms of operation and investment system to act as an intermediary to help debtors who are facing financial problems to have credit back to normal level in order to enter the financial system again. Hence, JMT Network Service Public Company Limited is one of those asset management companies that can enjoy this opportunity and help improve the health of the financial system in Thailand.
The company also expects that in the second half of the year 2022, financial institutions, especially banks, will release large amounts of non-performing debt as debtors are unable to pay back debt due to the fact that they are negatively affected by the Covid-19 pandemic. By considering the household debt alone, it is expected that the level of debt will be approximately 300,000 million baht. This amount of debt is still currently not a bad debt yet. However, if the debtor assistance measure is terminated by the government and there is no further assistance, this amount of debt will turn to be bad debt that the company expects the banks to release.
This prediction is also in line with JMT’s investment strategy for debt management in 2022. Initially, JMT plans to set an investment budget of about 10,000 million baht to buy debt to manage. However, the company also has to wait and see the amount of bad that will come out in the second half of the year. The company’s investment potential has reached the level of 30 billion baht due to the fact that debt-to- equity (D/E) is still low. Therefore, if in the second half of the year or continuing in 2023, there is a large amount of bad debt released to the market, the company can use other financial channels to raise funds.
In addition, the company’s plan for the next three years aims to invest in buying bad debt for corporate customers because the company’s potential at that time will allow the company to buy these amounts of bad debt. However, there is still no sign
of bad debt from the corporate group at this time because there is still a policy to suspend debt for customers.
Even though the Covid-19 pandemic caused the economy to slow down in 2021, the company has also adjusted the operating strategy and management that concern about economic risks which lead to significant performance growth in the operation of business. Moreover, the company is also confident to be a leader in Thailand in the debt management business for unsecured loans.
In 2021, the company’s performance is outstanding and has a highest record for 6 years consecutively both for debt collection and operation. In terms of debt collection, JMT has a cash flow of 4,590 million baht, which is 15% growth from 2020.
This is a result from higher efficiency in debt collection and the company’s investment in a debt portfolio that has a high potential. The company’s net profit in 2021 is approximately 1,400 million baht, which grew from 2020 by 34%. This is the highest net profit for the company for 6 consecutive years since the inception of the company as can be seen on figure 3.4.
Figure 3.4 JMT’s Net Profit Source: JMT Annual report 2021
In terms of operation for a non-performing debt management business in 2021, the company was able to purchase distressed debt with an investment amount of
8,516 million baht. The company used this amount to purchase both secured and unsecured distressed debt.
3.3 Competition Analysis
The debt issue remains a major concern for financial institutions and the Bank of Thailand (BOT) as a result of the coronavirus's impact. Therefore, they had to come out with measures to help debtors during the past 1 year. As a consequence, after the debt reduction program expires and the trend of increasing interest rates is coming, these positive factors will drive this business growth this year from higher debt volume.
The market is projected to see a huge spike in NPLs requiring financial institutions to sell nonperforming loans in order to maintain asset quality and this presents an opportunity for AMC firms to acquire at a lesser cost. It also assists financial institutions in providing credit in an efficient manner combined with strong asset quality and assisting small debtors with debt restructuring to ease their payback burden.
There are five asset management companies listed on the Thai Stock Exchange, namely BAM, JMT, CHAYO, TH and KCC, with total assets of 185,813 million baht, with BAM being the market leader that owns the highest amount of NPL- NPA Portfolio. It buys secured poor loans, whereas JMT and CHAYO buy unsecured loans. TH and KCC are new competitors that have just entered the market and which still have small market capitalization.
Table 3.1 JMT and Peers Summary
Source: Efinance Thailand
CHAPTER V VALUATION
4.1 Financial Analysis
4.1.1 Growth Analysis
Figure 4.1 JMT’s Growth Rate
According to the above figure, it shows the growth trend of Total revenue, Gross profit, EBIT and Net income of the company in the period 2017-2021. The growth rate of revenue is dropping each year while gross profit and EBIT are upside each year.
It could be implied that the company had the lower cost of goods sold each year and effectively controlled their Selling General & Admin Exp. Even though the revenue grows slowly, they still generate higher profitability each year.
4.1.2 Dupont Analysis
Table 4.1 ROE Benchmark with Competitors
This section will analyze DuPont's ROE, its growth over the past five years, and some industry-specific financial ratios. Bangkok Commercial Asset Management Public Company Limited (BAM) and Chayo Group Public Company Limited (CHAYO) are JMT's main competitors.
Before covid impact, the company's CARG 2017-2019 ROE growth is 5%, which is lower than BAM, the market leader, but higher than CHAYO, a company of comparable size. The company has a positive trend of increasing its net profit margin from 29 percent in 2017 to 39 percent in 2021, whereas the trend of its competitors is declining. Total asset turnover is equal to net sales divided by a company's total or average assets; it measures an organization's ability to generate income efficiently from its assets. JMT is more efficient than its competitors because the company maintains its
efficiency well. BAM's total assets turnover is very low, whereas CHAYO's growth of efficiency in using their assets to generate income is marked by declining.
4.2 Relative valuation
4.2.1 Historical multiple bands
The first part of relative valuation is the historical valuation bands method.
In this part, the 5 years historical information of the company will be utilized to plot the graphs for both trailing and forward P/E, P/BV and EV/EBITDA bands. To begin with, the information about price, earnings per share (EPS), book value (BV), enterprise value (EV), and EBITDA of JMT are gathered from the main source which is Eikon. This information is then used to compute the average and standard deviation for each trailing and forward P/E, P/BV, and EV/EBITDA bands to observe the trend of each multiple.
These historical multiple bands will then be analyzed further in this section.
The first historical multiple band that will be analyzed is the price to earnings ratio (P/E ratio). To clarify, the P/E ratio indicates how much the company is worth. It is a widely used ratio as it gives investors signals about the value of the company. Trailing P/E focuses on historical performance of the company. It is calculated by using the current share price divided by EPS for the past 12 months. On the other hand, forward P/E is computed by dividing the current share price with EPS for the next 12 months.
From Figure 4.2, it can be seen that the current trailing P/E as of 21 July 2022 is 58.26. It is higher than the 5 years average P/E of 34.47. It is also slightly higher than the +2SD band which is at 56.20. This shows that relative to its own history, the company is strongly overvalued now. On the other hand, Figure 4.3 which is forward P/E band shows that the current forward P/E as of 21 July 2022 is 39.59. This is higher than the average of 25.83. It also is higher than the +1SD band of 33.45 but slightly lower than the +2SD band of 41.07.
To compare between trailing and forward P/E, it can be seen from Figure 4.2 and Figure 4.3 that the trailing P/E ratio is higher than the forward P/E ratio. This is because the estimated forward earnings per share for the next 12 months is higher than
the trailing earnings per share. Hence, it means analysts expect an increase in earnings.
In addition, there is a sharp decline in both trailing and forward P/E ratio during the beginning of 2020. This is due to the fact that there was a decline in price during that period to about 11.50 in March. As a result, the P/E dropped to nearly -2SD for both trailing and forward P/E ratios. After that both Figure 4.2 and Figure 4.3 show an overall upward trend to be even higher than the average of 5 years. This is due to the fact that JMT operates in an industry that can benefit during an economic downturn. In addition, due to the company’s strategy, it has acquired a considerably large amount of NPLs worth 1,122 million baht in the first two quarters of 2022 to manage. The company’s net profit also increased significantly by 50 percent in the second quarter of 2022 compared to the same period last year.
Figure 4.2 Trailing P/E Band
Figure 4.3 Forward P/E Band
Next, Price to Book value (P/BV) is a method used to compare a company’s market value together with its book value of equity. It is a ratio used to indicate whether the stock is properly valued. From Figure 4.4, the current trailing P/BV as of 21 July 2022 is 4.57 which is lower than the average of 5.56 and only slightly higher than the - 1SD band of 3.95. Hence, this indicates that relative to JMT’s own history, the company is undervalued. From Figure 4.5 which shows the historical band for forward P/BV, the current P/BV as of 21 July 2022 is about 4.59. It is lower than the average of 5.08 but still higher than the -1SD band of 3.61.
After comparing between the trailing P/BV and forward P/BV, the comparison shows that both trailing and forward P/BV move in a similar direction.
However, the trailing P/BV ratio fluctuates more compared to forward P/BV ratio.
Moreover, there is a sharp decline in the P/BV ratio in the beginning of 2020 as the price dropped. Even though there is an upward trend for price since April 2020 until now, book value per share also increased significantly since the end of 2021 as well.
Figure 4.4 Trailing P/BV Band
Figure 4.5 Forward P/BV Band
The next historical multiple band that will be analyzed is EV/EBITDA.
EV/EBITDA is a multiple that can be used to compare the value of the company to the company’s earnings before interest, tax, depreciation, and amortization.
For trailing EV/EBITDA, Figure 4.6 shows that the current trailing EV/EBITDA as of 21 July 2022 which is 48.66 is much higher than the average of 27.53.
In addition, it is slightly higher than +2SD which is 47.64. This means relative to the
company’s own history, the company is overvalued. For forward EV/EBITDA, it can be seen from Figure 4.7 that the current forward EV/EBITDA of about 25.49 is also above the average value of 17.09. Moreover, it is slightly higher than the +1SD band which is about 23.60.
When comparing both trailing EV/EBITDA and forward EV/EBITDA, it can be seen that both of the current values are higher than the average. However, trailing EV/EBITDA is much higher than forward EV/EBITDA. The reason is because the trailing EBITDA is much lower than the forward EBITDA which is based on the estimation from analysts.
Figure 4.6 Trailing EV/EBITDA Band
Figure 4.7 Forward EV/EBITDA Band
Comparing between the three multiples, the results show that P/E and EV/EBITDA multiples indicate that the company is overvalued while P/BV multiple shows that the company is undervalued compared to its average from the last 5 years historical data.
When comparing between each multiple, the P/E ratio is a widely used ratio that can reflect how much investors pay for a stock. However, there are some drawbacks of this multiple. This is because the P/E ratio does not take into account the debts of the company. Also, P/E might be affected by some unusual events which lead to abnormal earnings. This makes the P/E ratio unrealistic during that period of time. In addition, the P/E ratio is not appropriate to evaluate losses because a negative P/E cannot be used to interpret anything.
For the P/BV ratio, it is undeniable that the ratio is relatively more stable than the P/E ratio. Hence, this ratio is useful when the P/E ratio fluctuates. However, P/BV can sometimes be misleading in the case that the company makes a loss or negative earning. This is because P/BV can still be positive for the company that makes a loss and has a negative P/E. In addition, a positive P/BV might convince investors that the stock is cheap while it might not actually be attractive. This is because as the price drops due to the fact that the company makes a loss, it will make P/BV lower as well.
Furthermore, P/BV does not actually capture the value of intangibles.
EV/EBITDA is one of multiples that also can be used to identify whether the stock is cheap or expensive. However, it does not take into account capital expenditures which are significant for some industries.
Based on information stated previously, to increase robustness to errors, the relative valuation for this thematic paper will be based on the average value of the 3 multiples to derive the target price for JMT.
In this section, the historical multiple bands will be utilized to compute the expected price of JMT in 2022 and 2023. To compute the expected price, the 5-year average multiples as of 22 July 2022 are used. The forecasted information by analysts of EPS, book value, and EBITDA of 2022 and 2023 are also obtained. For the expected price using P/E multiple, it is calculated by multiplying trailing P/E multiple with EPS.
For the expected price using P/BV multiple, it is calculated by multiplying P/BV multiple with BV. For expected price using EV/EBITDA multiple, it is calculated by
multiplying EV/EBITDA with the EBITDA then dividing it with the number of shares.
Then, expected prices from all multiples are averaged to find the average expected price for each forecasted year.
Table 4.2. shows the expected price of 2022 and 2023 using historical multiple bands. It can be seen that the expected price of 2022 using 5-year average multiples as of 22 July 2022 is 54.10 baht, which shows a downside of -29.28%
compared to the current price on 3 August 2022 of 76.5 baht. For the average expected price of 2023, the price is 67.83 baht, which also shows a down side of -11.33%. This means relative valuation based on historical multiple method shows that the expected price in the future will be lower than the current price. The reason for this is that in a recent year, JMT has been performing relatively better than the past few years because the company operates the business that can benefit during the economic downturn. This means since the period of Covid-19, the amount of debt increases significantly in which this also benefits JMT. As mentioned, net profit also increased rapidly, to about 50% in the second quarter this year compared the same period in the previous year. Hence, this is the factor that leads the price of JMT to skyrocketed during this recent year. This rapid increase in price also affects the multiples used to calculate in the valuation. In addition, the average value of the 5-year historical multiples is also affected when incorporate these changes. Therefore, this is the possible reason that causing a relatively low target price compared to the current price.
Table 4.2 Target Price
The information about EPS, book value, and EBITDA are also used to perform a sensitivity analysis to show the possible range for expected price of 2022 and 2023. To clarify, the value of EPS, book value, and EBITDA are adjusted by 20% and
-20% as a sensitivity range. Table 4.3 shows that by increasing EPS, book value, and EBITDA by 20%, the upper bound average expected price for 2022 is 64.92 baht and it is 81.40 baht for 2023. This shows a downside of -15.14% and an upside of 6.41%
respectively. Then, EPS, book value, and EBITDA are also adjusted by -20% lower.
Table 4.3 shows that the lower bound average expected piece for this sensitivity is 43.28 baht for 2022 and 54.27 baht for 2023. This shows a downside of -43.42% and -29.06%
accordingly.
Table 4.3 Sensitivity Analysis
To summarize, Table 4.4 shows a clear illustration of the expected prices for 2022 and 2023 together with their sensitivity range of 20% and -20%. It can be seen that the average expected price for 2022 is 54.10 baht. The upper value of 2022 average expected price is 64.92 baht while the lower value is 43.28 baht. For the average expected price of 2023, the average expected price is 67.83 baht. The average expected upper value of 2023 is 81.40 baht and the lower value is 54.27 baht.
Table 4.4 Expected Price Summary
As the current price on 3 August 2022 is 76.5 baht, the results of expected prices show that the average expected prices for 2022 and 2023 using a 5-year average multiple are lower than the current price.
4.2.2 Peer group multiples
4.2.2.1 Selection of peers
In order to do a peer group multiple analysis, suitable peers of JMT are first selected. To conduct the analysis, the four peers that will be used are Bangkok Commercial Asset Management Public Company Limited (BAM), Chayo Group Public Company Limited (CHAYO), Tong Hua Holding Public Company Limited (TH), and Knight Club Capital Asset Management Public Company Limited (KCC). To clarify, the industry that JMT operates in has many small competitors and relatively few large competitors in the market. There are two main competitors that are direct competitors for JMT which are BAM and CHAYO. The main business operation of BAM is to acquire and manage non-performing loans and non-performing assets. For CHAYO, the company’s main business operation relates to management of non- performing loans and debt collection services. Hence, these two companies have the business operations that match with the main operation of JMT. On the other hand, TH and KCC are the competitors that have recently entered into the market. Apart from expertise in technology and media, TH also recently expanded into the financial area to provide service regarding non-performing loans management. KCC is considered as a peer for JMT because it provides non-performing loans and assets management.
4.2.2.2 Peer group comparison of multiples
The information of the trailing P/E, P/BV, and EV/EBITDA of each peer are collected as listed in Table 4.5 as of the date 3 August 2022. The peer group comparison of multiples shows that in terms of P/E multiple, JMT has the highest P/E of 60.63 among its peers while the lowest is BAM which its P/E is 20.65. This means JMT is the most expensive stock among its peers based on this ratio while BAM is the cheapest. In terms of P/BV multiple, KCC is positioned as the company that has the highest P/BV of 6.33 among its peers while the lowest is BAM of 1.28. P/BV of JMT is about 4.75 which is above the median and average of its peers. Then in terms of EV/EBITDA multiple, KCC also has the highest value among its peers of about 66.67.
The EV/EBITDA multiple of JMT is 52.77 which is the second highest while the lowest among peers is CHAYO, whose EV/EBITDA multiple is 31.76. Hence, it can be seen that JMT has the highest value in P/E multiple while it has the second highest values in P/BV and EV/EBITDA ratios compared to its peers.
Table 4.5 Peer Group Trailing Multiples
Source: www.settrade.com, Eikon
Then, the trailing P/E, P/BV, and EV/EBITDA multiples of JMT and its peers are used to compute the peer average multiple, peer median multiple, maximum multiple, and minimum multiple. To elaborate, the peer average and median are computed by considering only the multiple values of peers. This means the multiples of JMT are excluded when computing these values. On the other hand, the maximum and minimum values of multiples will include both JMT and its peers in the computation.
According to Table 4.5, trailing P/E multiple has a peer average of 41.71 and peer median of 43.48. The maximum multiple value for P/E multiple is
60.63 and the minimum value is 20.65. In terms of trailing P/BV multiple, the peer average is 3.79 while the peer median is 3.78. The maximum value of P/BV multiple is 6.33 and the minimum is 1.28. In terms of EV/EBITDA multiple, the peer average is 46.95 and the peer median is 44.69. Trailing EV/EBITDA multiple has the maximum value of 66.67 and the minimum value of 31.76.
JMT looks overvalued compared to the peers based on all 3 trailing multiples. The 3 multiple ratios of JMT are also above the median P/E, P/BV, and EV/EBITDA values of 43.48, 3.78 and 44.69 respectively. JMT is the most expensive stock in terms of P/E ratio as it has the highest value. In terms of P/BV and EV/EBITDA, KCC is the most expensive. However, JMT looks expensive as well compared to its peers as it has the second highest values in these two multiples.
The information of the forward P/E, P/BV, and EV/EBITDA of each peer are collected as listed in Table 4.6 as of the date 3 August 2022. The peer group comparison of multiples shows that in terms of P/E multiple, KCC has the highest P/E of 55.00 among its peers while the lowest is BAM which its P/E is 14.96. In terms of P/BV multiple, JMT is positioned as the company that has the highest P/BV of 4.78 among its peers while the lowest is BAM of 1.26. Then in terms of EV/EBITDA multiple, JMT also has the highest value among its peers of about 26.32 while the lowest among peers is TH, whose EV/EBITDA multiple is 6.59. However, the information of the forward EV/EBITDA of KCC is unavailable. So, this might possibly affect the average, median, maximum, and minimum value of this multiple. Hence, it can be seen that JMT is expensive in terms of P/BV and EV/EBITDA multiples while it has the second highest value in P/E multiple compared to its peers.
According to Table 4.6, forward P/E multiple has a peer average of 27.60 and peer median of 20.22. The maximum multiple value for P/E multiple is 55.00 and the minimum value is 14.96. In terms of forward P/BV multiple, the peer average is 2.65 while the peer median is 2.94. The maximum value of P/BV multiple is 4.78 and the minimum is 1.26. In terms of forward EV/EBITDA multiple, the peer average is 12.14 and the peer median is 14.69. Forward EV/EBITDA multiple has the maximum value of 26.32 and the minimum value of 6.59.
JMT looks overvalued compared to the peers based on all 3 forward multiples. The 3 multiple ratios of JMT are also above the median value. JMT
is the most expensive stock in terms of P/BV and EV/EBITDA ratios as it has the highest values. In terms of P/E, KCC is the most expensive. However, JMT seems expensive as well as it has the second highest values in this multiple.
Table 4.6 Peer Group Forward Multiples
Source: www.settrade.com, Eikon
It can be seen that the values of forward P/E, P/BV, and EV/EBITDA multiples are relatively lower compared to trailing multiples. This is possibly due to the fact that analysts forecasted high growth in value of earnings, book value, and EBITDA.
4.2.2.3 Peer group comparison of fundamentals and outlook To analyze and understand more about peer multiples, the financial ratios of JMT and its peers are obtained as shown in Table 4.7. To begin with, beta is the indicator that can tell sensitivity and volatility of the stock to the market. It is also known as systematic risk. When comparing beta to peers, all of the companies have beta which is greater than one. This means that the stocks tend to be more volatile than the market. From Table 4.7, TH has the highest beta of 2.80. JMT and BAM have a beta of 1.43 and 1.41 respectively which are the lowest compared to its peers. The next ratio that will be analyzed is return on equity (ROE). ROE is a metric to compare the profit generated to the shareholder’s equity. The company that has the highest ROE is KCC of 12.22 while BAM has the lowest ROE of 6.26. JMT has an ROE of 9.94 which is second lowest with ROE slightly higher than the peer average of 9.77. In terms of debt ratio, JMT has a debt ratio of 0.34 which is below 1. CHAYO, TH, and KCC also have debt ratios lower than one. The only company among the peers that has a debt ratio greater than 1 is BAM with the highest debt ratio of 1.90. For payout ratio, the highest
ratio among the peers is JMT of 0.70. However, KCC has the highest net profit margin of 65.92 while JMT is 30.90 which is below the average. For 5 years EPS growth, CAGR of JMT is 27.70% which is the second highest. The only company among the peer group that has a negative value is BAM which has a CAGR of -14.80%.
From the peer group financial ratios, even though JMT’s beta is below the peer average, it is greater than one which means that the company is still sensitive to market risk. In addition, ROE, payout ratio, and EPS growth of the company is also above the peer average. On the other hand, the debt ratio and net profit margin of the company is below the peer average.
Based on the data in Table 4.7, JMT and BAM are quite similar in terms of beta and payout ratio. In terms of ROE, debt ratio, and net profit margin, JMT is more similar to CHAYO. Then, the multiple values of JMT, BAM and CHAYO can also be used to compare. JMT and CHAYO also have relatively close values in terms of P/E and P/BV multiples. It can be seen that CHAYO and BAM could be the peers that are closely matched for JMT. However, other factors also have to be taken into consideration in order to compare between JMT and its peers. Although BAM and CHAYO are similar to JMT in several financial ratios, the significant difference is their market capitalization. To clarify, JMT’s market capitalization is about 107,224.78 million baht while BAM is only 52,682.29 million baht and CHAYO is 10,983.82 million baht. Hence, the market capitalization of JMT is much larger than the other two companies. In addition, the type of debt managed by the companies are also different.
BAM is specialized in managing secured loans while JMT is specialized in unsecured loans. This means although they offer the similar type of services, they are still different and not fully matched.
Table 4.7 Peer Group Financial Ratios
Source: www.setsmart.com, Eikon
In the following section, the peer group multiples will be used to calculate the expected price range for JMT. To clarify, the information of EPS, book value per share, EBITDA, and number of shares which are shown in Table 4.8 are obtained from the forecasted data of the year 2022 and 2023 by analysts. The average maximum, median, and minimum value of each multiple will also be used to compute the expected price. From Table 4.8, the maximum and minimum expected price will also be computed to use for sensitivity analysis.
To compute the expected price, all 3 multiples are utilized. For expected price using P/E multiple, it is calculated by using the P/E multiple multiplied by forecasted EPS for 2022 and 2023. To calculate the expected price for P/BV multiple, P/BV is multiplied with the forecasted book value. For expected price using EV/EBITDA multiple, the EV/EBITDA multiple is multiplied with the forecasted EBITDA. Then, it is divided with the number of shares to derive to the expected price.
This process is then repeated for median, maximum, and minimum values of all 3 multiples to be used as sensitivity analysis. The median is used instead of average because it is not affected by the outliers much compared to the average value.
According to Table 4.8 it shows the expected price for 2022 and 2023 of both forward and trailing multiples together with the maximum and minimum value for each. The median, maximum, and minimum expected prices of both trailing and forward multiples are then used to calculate the average expected price for 2022 and 2023. The results from the table below show that the average median expected price of 2022 using peer group multiples method is 48.33 baht. The average maximum expected price is 82.09 baht and the minimum is 25.33 baht. For 2023, the average median
expected price is 63.26 baht while the maximum is 107.64 baht and the minimum is 34.41 baht.
Table 4.8 Expected Price
Source: www.capitaliq.com
It can be seen from the results when compared to the current price as of 3 August 2022 which is 76.5 baht that the average expected prices of both and trailing forward multiples are significantly lower than the current price. Table 4.8 above shows that the expected price of 2022 using peer group multiples method which is 48.33 baht results in a downside of -36.83%. Also, the average expected price of 2023 which is 63.26 baht also shows a downside of -17.31% compared to the current price.
By comparing the expected price from historical valuation method and peer group multiple method, it shows that the expected price of 2022 and 2023 calculated by using the peer group multiples are relatively lower than the historical valuation method. However, the valuation based on peer group multiples may not fully reflect the current valuation of the company as the peers chosen although are closet match with JMT, they are still some significant differences which may affect the valuation of the company.
4.3 Valuation recommendation
After computing the expected price for 2022 and 2023 using both historical valuation bands and peer group multiples methods, it is more appropriate to base the recommendation on historical valuation bands method. The reason is that this method is relatively sound and although the peers used in the peer group multiples method have several financial ratios that are relatively close to JMT, the main factor to take into consideration is that they are much different in terms of market capitalization as JMT has a much larger market capitalization compared to peers selected. To clarify, JMT’s market capitalization as of 3 August 2022 is 107,244.78 million baht. This is about two times larger than BAM, and it is approximately 9 to 27 times larger than the other peers.
Also, BAM is more specialized in managing secured loans, which is different from JMT as the company purchases loans which are mainly unsecured loans to manage.
Therefore, the expected prices from historical valuation bands method are compared with the actual current price of JMT. As of 3 August 2022, the price of JMT is 76.5 baht.
When comparing this to the expected price, it can be seen from Table 4.9, which is the result from in the historical valuation bands section, that the average expected price of 5-year average multiples is 54.09 baht for 2022 and 67.82 baht for 2023 are much lower than the current price. This implies that the current price is overvalued compared to the expected price of 2022 and 2023.
Table 4.9 Sensitivity Analysis and Expected Price Summary
It can be seen that the relative valuation based on historical multiple bands provides the expected price for 2022 and 2023 that are -29.28% and -11.33% lower than the current price as of 3 August 2022. So, based on relative valuation, JMT is recommended to “Sell” as the expected price in 2023 is still lower than the current price, and -11.34% of downside in 2023 is still considered to be relatively risky. Therefore, it is better to sell based on the decision from relative valuation.
CHAPTER V INVESTMENT RISKS
In this section, the possible investment risks of JMT will be clarified for each type of service that the company provides.
Debt tracking and collection service business
1) The risk from the changes in the non-performing debt management policy and the bargaining power of the customer
In the past, the customer group had a policy to hire the company to track non-performing debts due to the need to reduce the burden and costs in tracking debts.
However, recently many customers adjust their policy to do debt tracking and collection by themselves or even sell the non-performing debts. This is due to the fact that many customers now place more importance on debt tracking and collection processes to reduce the risks. These risks are especially in terms of image risk. Also, the customers are also willing to minimize the bad debts to total loans rate. Therefore, this is a factor that can possibly cause the company to be at risk of loss of revenue from debt collection services.
2) Risk of competition in the industry
Debt collection service business is a business with a large number of operators, which may result in competition in commission rate from debt collection fee.
In addition, such a business does not require much investment and has a simple business structure. Therefore, there is a risk that new entrepreneurs will compete in the business more and more. The competitors may be international firms or a related business operator such as the litigation, law firms, and non-performing debt executives.
Therefore, the company may face high competition and this may affect the operating results negatively.
3) The risk of reliance on major customers
The company operates the business of debt collection services with the revenue of debt tracking and collection from the customer who is a financial institution.