TAPANAT KOSINANONDH
A THEMATIC PAPER SUBMITTED IN PARTIAL FULFILLMENT OF THE REQUIREMENTS FOR THE DEGREE OF MASTER OF MANAGEMENT
COLLEGE OF MANAGEMENT MAHIDOL UNIVERSITY
2022
COPYRIGHT OF MAHIDOL UNIVERSITY
ACKNOWLEDGMENTS
I would like to first express my gratitude for the professors and faculty members of CMMU for giving me the opportunity to work on my thematic paper and for being supportive of the project throughout the semester. I was only able to complete and refine the project to this extent from the advice and revisions from my advisor, Prof.
Dr. Roy Kouwenberg, whose guidance led me in the right direction and allowed me to complete my research within the given timeframe.
Next, I would also like to thank my family for providing the best support I could have asked for and for being in my corner throughout my experience at CMMU.
It would not be an understatement to say that I would likely not be able to graduate without their help and encouragement.
Lastly, Ms. Rattanatorn Jongjarasporn has been a cooperative and helpful project partner throughout the term. I am glad to have such an exceptional friend who I can rely on in times of need and be supportive of me when I need assistance. The completion of this thematic paper is in large part thanks to her substantial contributions of knowledge and work experiences.
Tapanat Kosinanondh
RELATIVE VALUATION OF PRIMA MARINE PUBLIC COMPANY LIMITED
TAPANAT KOSINANONDH 6349113
M.M. (CORPORATE FINANCE)
THEMATIC PAPER ADVISORY COMMITTEE: ASST. PROF. SIMON ZABY, Ph.D., PROF. ROY KOUWENBERG, Ph.D., CFA, WORAPONG JANYANGYUEN, D.B.A.
ABSTRACT
The relative valuation assessment on Prima Marine Public Company Limited in this paper is conducted using several multiples-related methods with the intent of finding an appropriate target price for the company by which we could use to determine the undervaluation or overvaluation of the company. The historical multiples method compares the multiples of the firm with that of its own in the past, while the peer group multiples method exhibits the multiples of the company in comparison with comparable peers from similar industries of within reasonable overlap in regards to their business segments. In this thematic paper, the target price we acquired in our investment recommendation comes from using the historical multiples, of which we constructed 6 multiple bands including the trailing and forward figures of P/E, P/BV, and EV/EBITDA. The reason for this is attributed to the difference in firm market capitalization and different nature of the business segment between PRM.BK’s peer, making it more suitable to make use of the target price from our calculation of the historical multiples band instead of peer multiples. We then calculate the average target price using the trailing EPS for the company in order to determine the final target price of 8.27 Baht, which is an upside of the current price (as of 26th of July 2022) of PRM.BK stock of over 35.90%. As such, the investment recommendation we provided here is to BUY the stock.
KEY WORDS: PRM.BK/ Relative Valuation/ Marine Transportation/ Floating Storage Unit/ Oil Tank
43 pages
CONTENTS
Page
ACKNOWLEDGEMENTS ii
ABSTRACT iii
LIST OF TABLES vii
LIST OF FIGURES viii
CHAPTER I INTRODUCTION 1
CHAPTER II BUSINESS DESCRIPTION 3
2.1 Business overview 3
2.2 Corporate strategy and long-term goals 3
2.2.1 Vision of the company 3
2.2.2 Objective of the company 3
2.2.3 Long-term goal and strategies 4
2.3 Business Segments 5
2.4 Business Segment Revenue 6
2.4.1 Impact from the COVID-19 Global pandemic 7
2.5 Management and Governance 8
2.5.1 Major Shareholders 8
2.5.2 Corporate Governance 8
CHAPTER III ANALYSIS OF MACRO ECONOMY, INDUSTRY,
AND COMPETITORS 10
3.1 Macro-economy Analysis 10
3.1.1 The Global and Thailand’s GDP 10
3.1.2 The Global and Thailand’s Inflation rate 11
3.2 Industry Analysis 12
3.2.1 Overview of Oil & Petrochemical Tanker Business 12
CONTENTS (cont.)
Page 3.2.2 Overview of Fuel and Crude Oil Price in Thailand 13 3.2.3 Overview of the Floating Storage Unit 14
3.3 Competition Analysis 15
3.3.1 VL Enterprise PLC. 15
CHAPTER IV VALUATION 16
4.1 Financial Analysis 16
4.1.1 Growth analysis 16
4.1.2 Dupont’s analysis 20
4.2 Relative Valuation 22
4.2.1 Historical Multiple bands 22
4.2.2 Peer group multiples 27
4.2.3 Target Price 30
4.2.4 Sensitivity Analysis 31
4.3 Valuation Recommendation 32
CHAPTER V INVESTMENT RISKS 34
5.1 Macro and Industry Risks 35
5.1.1 Risk from the possibility of Coronavirus (COVID-
19) pandemic resurgence 35
5.1.2 Risk from the fluctuations and volatility in demand
and supply of oil consumption 36
5.1.3 Risk from possible drastic change in transportation
service business 37
5.2 Company-specific Risks 37
5.2.1 Risk from difficulty regarding the purchase and
selling of vessels 37
CONTENTS (cont.)
Page
CHAPTER VI CONCLUSION 39
6.1 Investment Recommendation 39
6.2 Limitations 40
6.2.1 Differences from comparable peers 41 6.2.2 Outliers from extraordinary events 41
REFERENCES 42
BIOGRAPHY 43
LIST OF TABLES
Table Page
2.1 Business Segment Revenue 6
2.2 The fleets utilized by the company 7
2.3 Major Shareholders 8
4.1 Dupont’s Analysis of PRM 21
4.2 Dupont’s Analysis of VL 21
4.3 Peer Group Multiples 28
4.4 Peer Group Financial Ratios 29
4.5 Target Price Calculation 30
4.6 Calculation of Sensitivity Analysis 31
5.1 The impact on the revenue of the first quarter of 2021 as indicated by the Management Discussion and Analysis of the first quarter of
PRM.BK. 35
5.2 The impact of COVID-19 on the revenue of the first quarter of 2021 36
LIST OF FIGURES
Figure Page
2.1 Major Shareholders 8
3.1 The Global and Thailand’s GDP 10
3.2 The Global and Thailand’s Inflation rate 11
3.3 Quantity of the Refined Oil Consumption in Thailand during Jan-
Nov 2021 13
3.4 Fuel and Crude Oil Price in Thailand 14
4.1 Operating revenue trend of PRM and VL 17
4.2 Cost of goods sold trend of PRM and VL 17
4.3 Cost of goods sold trend (%) of PRM and VL 18
4.4 Net profit trend of PRM and VL 18
4.5 Net profit margin trend of PRM and VL 19
4.6 EPS trend of PRM and VL 19
4.7 Free cash flow of PRM and VL 20
4.8 Trailing P/E Band 23
4.9 Forward P/E Band 23
4.10 Trailing P/BV Band 24
4.11 Forward P/BV Band 25
4.12 Trailing EV/EBITDA Band 26
4.13 Forward EV/EBITDA Band 26
5.1 Risk assessments 34
6.1 Investment Recommendation 39
6.2 The average target price for PRM.BK 40
CHAPTER I INTRODUCTION
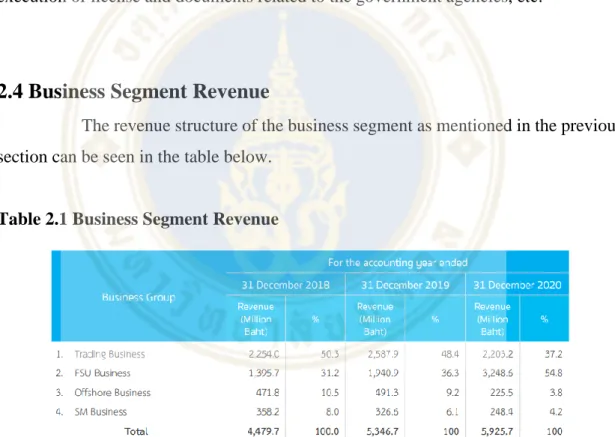
Prima Marine Public Co.,Ltd (PRM) is a marine transportation company that also provides storage for crude oil and other petroleum products. The company is a key player in the petrochemical industry both domestically and internationally. Its primary customers for their trading business are firms with oil refineries and major oil traders. The company has 4 business segments including trading business, both domestic and international, floating storage unit, offshore vessel business, and ship management business.
The company’s primary source of revenue derives from their Floating Storage Unit business, having accounted for more than half of their total revenue (54.8%), followed by their trading business at 37.2%. Its offshore business accounts for 3.8% of the revenue, while its Ship Management unit is attributed to 4.2% of the revenue.
The result of the COVID-19 pandemic and the war in Ukraine has quite an effect on the demand and the price of oil, which by extension affects Prima Marine to a considerable extent in 2021. However, 2022 sees a gradual recovery in economic activities and less stringent traveling restrictions as vaccine coverage increases, resulting in a revenue increase of about 3.5%. Moreover, the business expansion as a result of the acquisition of Truth Maritime Company was able to offset the impact of the pandemic to an extent and allow the company to remain profitable amidst the circumstances.
However, the floating storage unit is still affected by the market downturn with the rising oil price and an increase in average bunker cost, having a reduction of 35.2% in QOQ revenue for the first quarter.
As the situation continues to improve, it is likely that Prima Marine is enroute to see further revenue increase and business growth.
The relative valuation assessment in this paper utilizes the historical multiples bands in order to draw comparisons between the company’s current multiples
with that of its past. Moreover, peer multiples are also used to compare the company’s performance relative to its peers. We ultimately opt to draw our conclusion on our recommendation based on the target price we obtained from the historical multiples, which is 8.27 Baht. This means we recommend a BUY for the stock of Prima Marine, seeing as our valuation indicates a 35.9% upside from its current price as of 26th of July.
CHAPTER II
BUSINESS DESCRIPTION
2.1 Business overview
Prima Marine Public Co.,Ltd (PRM), established 2007,was successfully listed in Stock Exchange of Thailand (SET) in 2017. PRM engages in maritime transportation services with expertise in transportation of fuel oil, crude oil, refined oil, liquid petrochemical, and floating storage. Also, PRM provides maritime supported business and ship management to offshore exploration and production. Main customers are leading petroleum companies and major oil traders i.e. PTT, Shell, Chevron, IRPC.
2.2 Corporate strategy and long-term goals
2.2.1 Vision of the company
According to the company, the vision of Prima Marine is to strive to be ‘the leading organization in the integrated business of shipment and offshore support business for petroleum exploration and production in Asia Pacific Region, with excellency of operations and services of shipment and floating storage unit that are reliable and fair for all groups of stakeholders and fulfill customer satisfaction.’ (PRM, Annual report, 2021).
2.2.2 Objective of the company
The objective of the company is to generate and maintain a sustainable and satisfactory profit for stakeholders while simultaneously ensuring that the company is shaping itself to become a market leader in energy transportation of Thailand with a strong emphasis on sustainable growth. To achieve this target, the company is eager and determined to connect with all parties to develop communities and society in general
with the intent of creating a better quality of life for people while operating a sustainable and successful business operations.
2.2.3 Long-term goal and strategies
In order to operate with optimal efficiency and effectiveness, Prima Marine sees fit to categorize their strategic operations into two aspects: Service Strategy and Marketing Strategy. The intent is to provide a clear direction for both aspects and ensure that they are achievable and in accordance with the vision of the company.
1. Service Strategy
The service strategy section aims to fulfill customer demands while maintaining a satisfactory level of quality for the service they provide. The details of the strategy are as follows:
1. Emphasis on One-stop shipment of chemical products, petroleum, and logistics. This includes maintaining a quality fleet and having expertise in ship management that meets the law and regulations. Stringent care for service quality, punctuality, and safety of vessel operation are also top priorities for the company.
2. Emphasis on producing personnel teams with high expertise; having the capabilities and knowledge to operate the company’s daily operation in an effective manner that complies with the law and regulation.
3. Maintaining domestic shipment leadership while ensuring continuous growth of revenue and shipment volume, while simultaneously choosing suitable staff with satisfactory work performance to facilitate growth support.
4. Aims to expand and enhance their reputation and operation in the foreign market business while complying with international operating standards.
5. Emphasis on customer care in terms of long-term partnership by making effective use of human resources and capital, leading to a more expansive navigating routes in both domestic and international regions.
6. Striving to have an effective operating cost management. Emphasis on stringent planning of the purchase of materials and equipment, while constantly keeping in mind as to the price and quality. The same also applies to decisions regarding the selection of potential business partners.
2. Marketing Strategy
The marketing strategy section aims to expand their customer base and form long-term business alliances with potential business partners with the intent of long- term sustainability.
1. Emphasis on retention of a brokerage network that supplies vessels or cargo for both domestic and international markets.
2. Striving for improvement in marketing management to enhance efficiency of ship utilization and competition potential.
3. Emphasis on customer satisfaction via conducted surveys on services for all stages: before, during, and after shipment of cargo. (PRM, Annual report, 2021).
2.3 Business Segments
The core businesses of the PRM are classified into four types of businesses as follows
1. Oil and Petrochemical Tanker Business (“Trading Business”) - provides transportation service of crude oil, refined oil products, and liquefied petrochemicals (“Products”) to the customers that operate oil refinery businesses, and the major oil trader to transport the cargo to the destination specified by the customers. It gives precedence to safety, occupational health and environment, quality control of the products as determined by customers without contamination and alteration of chemical property of the transported products, and punctuality of transportation. Trading Business consists of domestic oil and petrochemical tankers, and international oil and petrochemical tankers.
2. Floating Storage Unit (“FSU”) Business (“FSU Business”) - provides Floating Storage Unit (FSU) services of crude oil and fuel oil by using a vessel which has a big cargo storage tank as storage place. The company group has a duty to store cargo of the customer to have quality, property and quantity as determined by the customer in agreed period, and also provide oil blending service on broad based on specification of oil as required by the customer for cargo distribution to other customers in the region in accordance with regulations of laws.
3. Offshore Support Vessel Business (“Offshore Business”) - provides offshore support vessel service for petroleum exploration and production to the customers which are mostly the offshore oil exploration and drilling companies. The vessels for services include Floating Storage and Offloading Unit (FSO) for oil drilling platform, Accommodation Work Barge (AWB) Vessel for oil drilling platform staff, and Crew Boat vessel for the ship crew transportation etc.
4. Ship Management Business (“SM Business”) - the main scope of work consists of navigation conning (steering) and controlling, supply of crews, training organizing pursuance to the international regulations and standards, and health and safety care of crews, maintenance of vessel hull, engine, and tools and equipment, execution of license and documents related to the government agencies, etc.
2.4 Business Segment Revenue
The revenue structure of the business segment as mentioned in the previous section can be seen in the table below.
Table 2.1 Business Segment Revenue
Source: PRM Annual Report
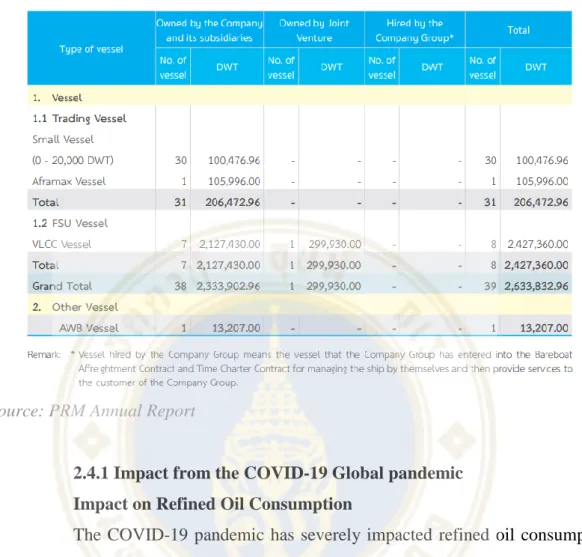
The fleets utilized by the company for their business operations in these segments are also divided into the table as follows:
Table 2.2 The fleets utilized by the company
Source: PRM Annual Report
2.4.1 Impact from the COVID-19 Global pandemic Impact on Refined Oil Consumption
The COVID-19 pandemic has severely impacted refined oil consumption volume on a global scale, which by extension also significantly impacts the company as well.With prolonged preventive measures put in motion by the government, it is severely difficult to facilitate both domestic and international travels. With restrictions on air travel, there has been a drastic decrease in fuel oil consumption for most of the first half of 2020. In the latter half, with the ease of travel restriction comes the resumption of economic activity, and refined oil consumption requirement volume has begun to climb back to normal level. (PRM, Annual report, 2021)
2.5 Management and Governance
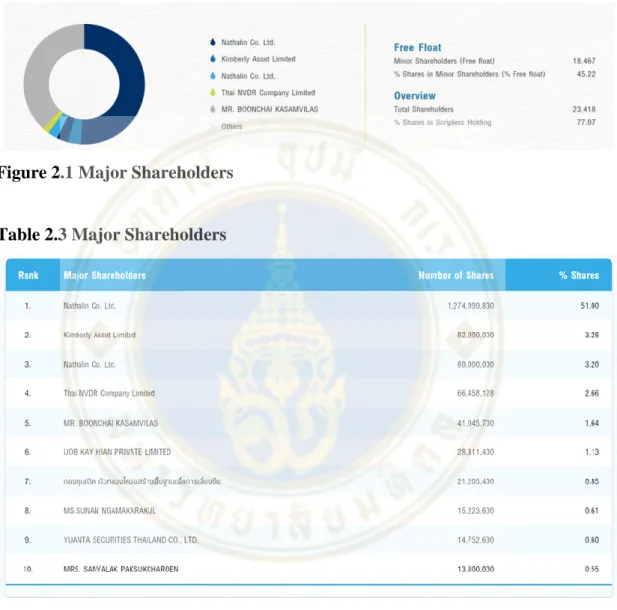
2.5.1 Major Shareholders
Figure 2.1 Major Shareholders
Table 2.3 Major Shareholders
Source: PRM Annual Report
As of current, the primary major shareholder of Prima Marine is Nathalin Company Limited, which holds approximately 51% of the shares issued.
2.5.2 Corporate Governance
To achieve those targets set by the company and accomplish the vision they have along with ensuring the smooth operations of daily business activities, the Board
of directors of PRM put a lot of priority in the corporate governance policy , seeing that it is regarded as the key maximum success factor, with the intention of shaping the company into an effective organization both in its operation and the responsibilities on all stakeholders.
In order to achieve effective performance and maintain a satisfactory level of transparency to raise confidence among investors, the corporate governance policy of the company will cover 5 sections of different aspects of shareholders as follows.
These are subjected to revision by the Board of Directors on a regular basis in order to strive for continuous improvement and ensure compliance with the Corporate Governance Code for Listed Companies 2017 (CG Code 2017) issued by the Office of Securities and Exchange.
Section 1: The Right of Shareholders Section 2: The Equality of Shareholders Section 3: The Role of Stakeholders
Section 4: Information Disclosure and Transparency Section 5: Responsibilities of the Board of Directors
CHAPTER III
ANALYSIS OF MACROECONOMY, INDUSTRY, AND COMPETITORS
3.1 Macro-economy Analysis
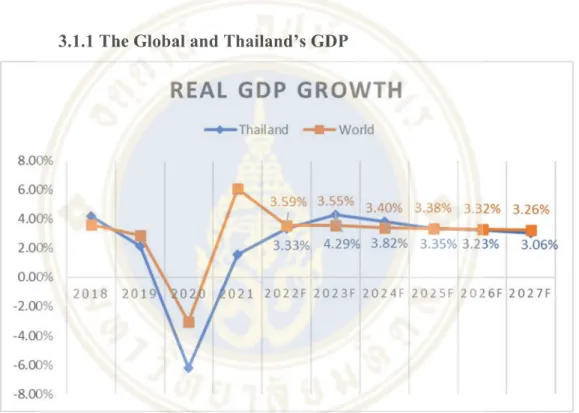
3.1.1 The Global and Thailand’s GDP
Figure 3.1 The Global and Thailand’s GDP Source: IMF
The global GDP growth is expected to slow down from its initial high post- COVID growth in 2021. For 2022, the figure is projected to drop from 6.1% to 3.59%
and maintain this level of growth for the foreseeable period. Such a significant drop despite its previous gradual recovery from the pandemic can be attributed to the war in Ukraine which caused economic damage from war-induced price changes in certain commodities, resulting in a rapid increase in fuel and food price. Moreover, the Omicron variant was also discovered in November of 2021, and its impact, while not as severe,
will affect air travel and by extension slow down both domestic and international tourism for quite some time.
On the other hand, Thailand’s real GDP was impacted slightly more severely compared to the global GDP by the pandemic and the imposed lockdown restrictions. Its GDP growth percentage change dropped to as low as -6.2%, which is more than doubled that of the global GDP. Despite that, economic growth picked up following the ease of the lockdown measures, as exports and private consumption are expected to rebound. Similar to the global GDP, however, the growth is expected to slow down slightly from the impact of the war in Ukraine as well as high inflation and ongoing travel restrictions in countries like China.
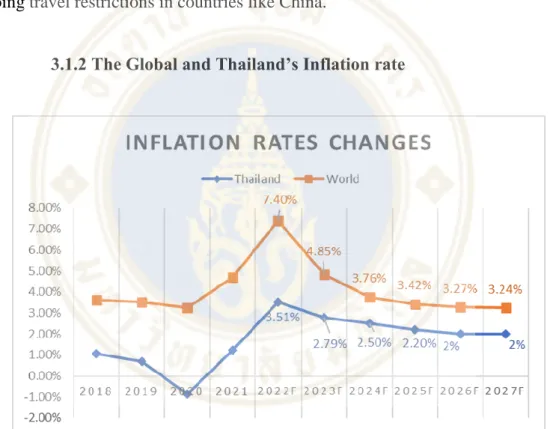
3.1.2 The Global and Thailand’s Inflation rate
Figure 3.2 The Global and Thailand’s Inflation rate Source: IMF
Supply chain disruptions due to COVID-19 and the war in Ukraine have elevated the inflation rate to as high as 7.4% as commodity prices significantly surge continuously. With oil and gas being underinvested from previous years due to the impact of the pandemic, the added issue of geopolitical uncertainty only drives inflation to unprecedented levels. There is also an issue of supply bottleneck, which results from
recurrent lockdowns and other varying issues related to the aftermath of the pandemic such as port restrictions and shipping congestions. As such, the inflation rate is expected to maintain an abnormally high growth rate and remain elevated for the foreseeable future, while gradually declining.
3.2 Industry Analysis
3.2.1 Overview of Oil & Petrochemical Tanker Business
The tanker industry in general is a very capital-intensive industry. Not only does it require a significant amount of investment for vessel and vessel equipment, the operating expense is just as high due to the cost of fuel oil and insurance expenses.
Moreover, the personnel involved in the transportation of domestic and international tankers must be well-versed in the operation of oil shipment and are experienced with the equipment on-board. They also must be certified by the domestic regulatory agencies, and with such a high bar of prerequisites comes high personnel expenses.
Refined petroleum use in Thailand
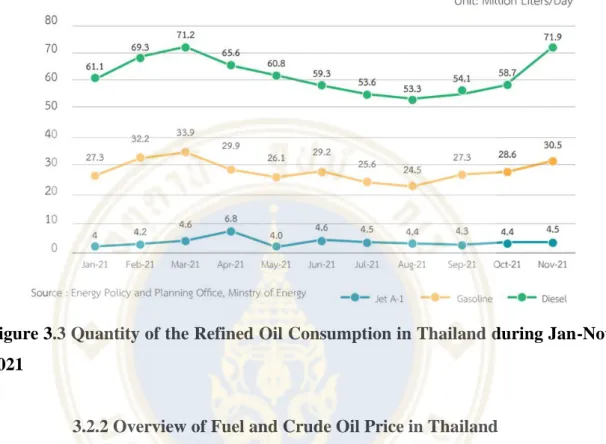
The impact of the COVID-19 pandemic situation has been relatively significant on the usage of refined-oil related products, especially for the first half of 2021; this can be primarily attributed to the government measure that emphasizes working from home and strict curfew and regulation, leading to a much lower demand for refined petroleum. The impact also further extends to the demand for Jet A-1 fuel, seeing as how air travel was also drastically hindered by the restriction. The latter half of 2021 was troubled with even lower consumption of petroleum products, and this is a direct result of the intensified pandemic issue that leads to harsher lockdown measures.
Fortunately, the situation seems to moderately improve during November, and lockdown restrictions are no longer as strict, which leads to a slight rebound of domestic consumption of refined fuel products. The same, however, cannot be said for air travel, as there are still relatively high limitations with commercial airlines. With stringent limitations on domestic and international tourism, demand for commercial jet fuel (Jet A-1) still stands in relatively low level and is expected to maintain this range for as long as the Omicron variant of the virus still pose a threat to the general public,
and travel restrictions remain in place in important tourism markets for Thailand such as China and Japan.
Figure 3.3 Quantity of the Refined Oil Consumption in Thailand during Jan-Nov 2021
3.2.2 Overview of Fuel and Crude Oil Price in Thailand
With stringent travel restrictions placed on several countries, the worldwide oil consumption requirement volume has dropped significantly in 2020. As a result, there has been an excess supply of crude oil, which leads to a reduction of crude oil price in the market on a global scale. Despite that, there are some upsides that come with the decrease of oil price. Initially, oil trading companies take this opportunity to speculate profit from oil reserving, leading to an increase in requirement for using FSU (Floating Storage Unit) Vessels. In addition, the low cost of fuel oil also leads to lower cost in the business operation part of FSU for the company as well.
In the following year, however, crude oil prices had been increasing continuously since the first month of 2021, but this upward trend in price was suddenly halted by the resurgence of a new variant, the Omicron variant, which hindered the demand for oil due to fear of lockdown measures returning. The global market begins to experience an excess supply of oil once again. In 2022, similar to the trend in oil
consumption, however, with the ease of the lockdown restriction, the oil prices have rebounded and increased to a relatively similar level as that of the price prior to the arrival of COVID-19.
Figure 3.4 Fuel and Crude Oil Price in Thailand
3.2.3 Overview of the Floating Storage Unit
As of current, Prima Marine currently provides its Floating Storage Unit service in both domestic and overseas. They are stationed at their respective docks with the intent of providing storage and mixing service for a variety of oils such as crude oil or low sulfur fuel oil. 5 of the FSU Vessels are docked in Malaysia, while the remaining vessel is docked in Ko Si Chang, Chon Buri, Thailand. Similar to the tanker industry, operating FSU vessels requires a high investment fund to operate in the field. Moreover, entrepreneurs who choose to do so must have the sufficient knowledge in oil mixing under the necessary requirements as provided by their customers without loss of goods.
An anchorage license is also needed from the government and must be renewed on an annual basis, making it an arduous task to enter the competition.
Because the demand for storage units correlates directly with utilization of oil, primarily within Singapore and Malaysia due to the fact that they are the regional oil trading hubs, the impact of COVID-19 also affects the industry as a whole due to reduction in Asia Pacific oil consumption requirements. The volatility of global crude oil price as a direct consequence of the War in Ukraine has resulted in decreased demand for FSU vessels in general. When oil prices are high, there is less demand to store them.
With the rebound of oil price and rising average bunker costs, it is likely that this business unit will be taking a slight hit for the foreseeable future.
3.3 Competition Analysis
While Prima Marine possesses 4 business units, the revenue of the company primarily derives from the Oil and Petrochemical Tanker Business and the Floating Storage Unit. The FSU business unit has no direct and comparable competitors in Thailand, while there is one comparable peer in the market for the Tanker Business: VL Enterprise PLC.
3.3.1 VL Enterprise PLC.
Similar to PRM, VL Enterprise PLC operates a transportation service for petroleum and chemical products both domestically and internationally. The company currently has 8 vessels for its domestic operations and 5 vessels for international operations. Their transportation revolves around transporting oil and petrochemicals such as crude oil, petroleum benzine, diesel fuel, and bunker oil. The company both offers transportation in the form of a contract of affreightment, which is a contract for transportation of approximately 1-3 years in duration, and spot charter, which centers around a ‘by-trip’ basis for its calculation of price and selection of the appropriate vessel. The details regarding the company’s finance can be seen below.
CHAPTER IV VALUATION
4.1 Financial analysis
In this section will look at Dupont's analysis of ROE, growth analysis over the previous five years, and industry-specific financial ratios. The key competitor for PRM is VL ENTERPRISE PCL (VL). As PRM's primary revenue comes from (1) oil and petrochemical tanker business (tanker) and (2) floating storage unit (FSU), which has no direct competitor because PRM is the only player in the FSU business in Thailand, we chose VL as its primary competitor because both PRM and VL are major players in the tanker business, and although VL is approximately 12 times smaller than PRM, it is the only publicly traded company that operates in the tanker business.
4.1.1 Growth analysis
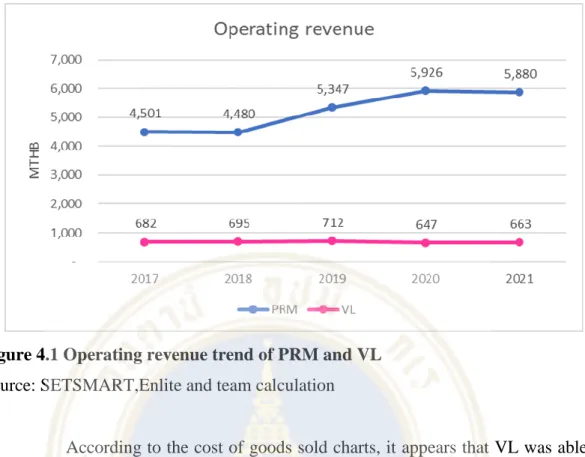
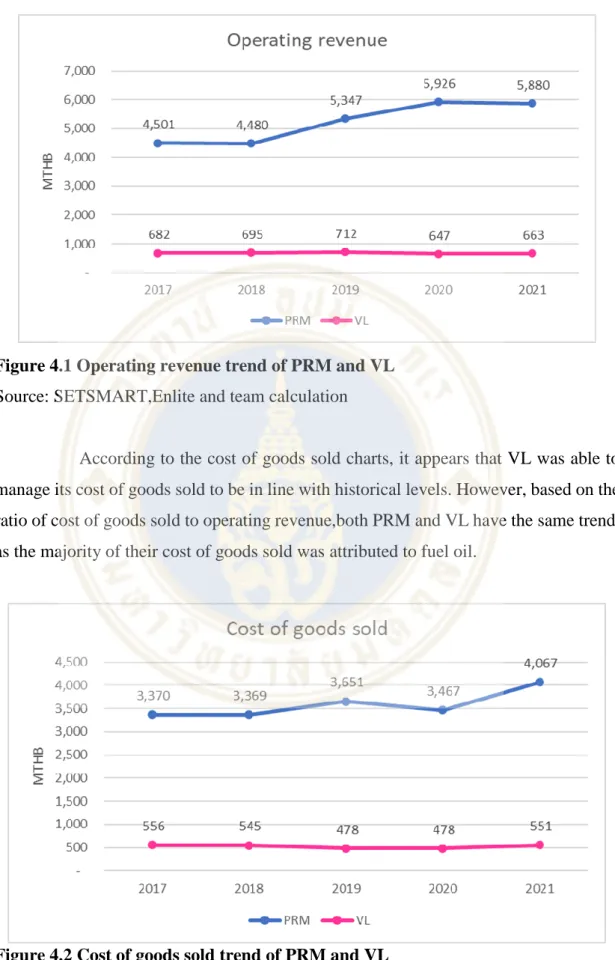
From 2017 to 2021, PRM's operating revenue increased at a CAGR of 6.9%, while VL's operating revenue decreased at a CAGR of -0.7%. In fiscal year 2020, PRM's operating revenue peaked at THB 5,926. million due to an increase in FSU demand during COVID. During COVID, oil production remained normal, but demand was drastically reduced, resulting in a downward trend in crude oil prices, which decreased to 39.2 US dollars per barrel on average in 2020 from 57.0 US dollars per barrel in 2019 and 75.4 US dollars per barrel on average in 2018. In order to store cheap crude oil, there was a high demand for oil storage, which benefited PRM's FSU in terms of full utilization and price increase, whereas VL has maintained a stable income over the past five years.
Figure 4.1 Operating revenue trend of PRM and VL Source: SETSMART,Enlite and team calculation
According to the cost of goods sold charts, it appears that VL was able to manage its cost of goods sold to be in line with historical levels. However, based on the ratio of cost of goods sold to operating revenue,both PRM and VL have the same trend, as the majority of their cost of goods sold was attributed to fuel oil.
Figure 4.2 Cost of goods sold trend of PRM and VL Source: SETSMART,Enlite and team calculation
Figure 4.3 Cost of goods sold (%) trend of PRM and VL Source: SETSMART, Enlite, and team calculation
According to charts of net profit and net profit margin, PRM and VL appear to have an upward trend in net profit with CAGR at 11.39% and 34.57% respectively.
The sharp increase in PRM's net profit in 2020 was due to the sale of two FSUs.
Figure 4.4 Net profit trend of PRM and VL Source: SETSMART, Enlite, and team calculation
Figure 4.5 Net profit margin trend of PRM and VL Source: SETSMART, Enlite, and team calculation
PRM's earnings per share have steadily increased since 2017, with a CAGR of 14.13%, while VL's earnings per share have been steadily declining from 2017 to 2020, with a significant decline in 2021, resulting in a CAGR of -40.54%.
Figure 4.6 EPS trend of PRM and VL
Source: SETSMART, Enlite, and team calculation
It is evident that VL's free cash flow to firm is highly volatile, whereas PRM's free cash flow to firm has increased over the past four years and peaked at 954 million baht in the most recent year.
Figure 4.7 Free cash flow of PRM and VL Source: SETSMART, Enlite, and team calculation
4.1.2 Dupont’s analysis
To determine how profitable a company is relative to its equity, we employ Dupont's analysis to analyze PRM's performance compared to its primary competition, VL. PRM's return on equity increased from 11.29% in 2018 to 17.51% in 2021, indicating that for 100 baht invested in equity, shareholders will receive a return of 17.51 baht in the form of net income in 2021, whereas VL's return on equity has decreased from 12.92% in 2018 to 2.67% in 2021, indicating that for 100 baht invested in equity, shareholders will receive a return of 2.67 baht in net income in 2021. Even VL has had a higher asset turnover than PRM over the previous five years (2017-2021), but PRM has a higher NPM and equity multiplier. PRM's NPM in 2021 is 7.44 times that of VL's, and PRM's equity multiplier is 4.14 times that of VL's. Thus, PRM has a greater ROE than VL. The formula used to calculate the Dupont ROE is shown below;
ROE = Net Profit Margin × AT × EM where:
Net Profit Margin = Net Income / Sales
Asset Turnover (AT) = Sales/ Average Total Assets
Equity Multiplier (EM) = Average Total Assets / Average Shareholders’ Equity
Table 4.1 Dupont’s analysis of PRM
PRM 2017 2018 2019 2020 2021
Net profit
margin 16.87% 16.66% 20.99% 28.72% 25.96%
Asset turnover 0.42 0.45 0.44 0.38
Equity
Multiplier 1.63 1.68 1.71 1.78
ROE 11.29% 15.75% 21.81% 17.51%
Source: SETSMART, Enlite and team calculation Table 4.2 Dupont’s analysis of VL
VL 2017 2018 2019 2020 2021
Net profit
margin 10.79% 8.78% 11.34% 13.05% 3.49%
Asset turnover 4.05 2.15 1.50 1.79
Equity
Multiplier 0.36 0.55 0.53 0.43
ROE 12.92% 13.48% 10.41% 2.67%
Source: SETSMART, Enlite and team calculation
4.2 Relative Valuation
Relative valuation consists of several methods by which a firm’s financial worth can be evaluated and assessed, whether it be via comparing with those of contemporary peers or appraising it by evaluating it based on the firm’s historical performance.
4.2.1 Historical Multiple bands
The historical multiple band method focuses on comparisons of multiples of the company with that of its own: in other words, the valuation made in this section are those that are compared with the historical performance of the firm itself to determine whether its current figures are undervalued or overvalued. Historical data are used to draw comparisons, and the trailing and forward of PE ratio, Price to Book Value, and Enterprise Value to EBITDA are utilized in assessing the firm’s performance relative to that of its past. Normally, 5 years of data are used in the calculations, but we opted to exclude 2018 from our calculations of the multiple bands for the reason that the valuation for the year was too high due to the period being directly after the IPO of the company.
4.2.1.1 Trailing and Forward PE ratios
The first multiple bands are those of the trailing and forward PE ratios. It depicts the movement of the company price to earnings per share compared to its changes throughout the last 4 years. For trailing PE, this particular band makes use of the historical earnings of PRM relative to its price throughout the period. As indicated in the graph (Figure 4.8), the trailing PE of PRM went through a rather significant drop.
From the middle of 2019 to 2020, the figure dropped below the -2SD band. Since then, there have been moderate fluctuations throughout the period, but the figure eventually rebounded and moved around just below the average band.
Currently, it stands at 12.33, which is slightly below its historical average of 13.94. The implication here might be that the company is slightly undervalued compared to its own historical performance, albeit to only a slight degree since it still lingers above the -1SD band.
Figure 4.8 Trailing and Forward PE ratios Source: Refinitiv and team calculation
Using future earnings to construct the band (Figure 4.9), we can observe that the overall movement of the figure does not differ much from that of the trailing PE band. There was also a significant drop where the figure dipped below the - 2 SD band in 2020. After that, it rebounded and has since lingers between the average and the -1SD band, and as of now, it stands at 11.68.
Figure 4.9 Forward P/E Band Source: Refinitiv and team calculation
4.2.1.2 Trailing and Forward Price/Book Value ratios
The Price to Book Value ratio represents the ratio of the price of the stock of PRM over the book value. Similar to the previous band multiples, the overarching pattern of the trends are relatively similar for both trailing and forward. For trailing, (Figure 4.10) we can observe a rather significant drop in stock price from the latter half of 2019, where the P/BV plummeted to almost at the -2 SD band level. This can be attributed to the stock price which had been on a consistent downward trend for the period even after the IPO in 2018. As of current, the ratio stands approximately just above the -2 SD band.
Figure 4.10 Trailing P/BV Band Source: Refinitiv and team calculation
For the forward band (Figure 4.11), while there are some differences throughout the period, the general direction of the ratio seems to resemble that of the trailing band. There was a moderate drop in the latter half of 2019 where it decreased to the -2SD band, but managed to eventually rebound and went back to its previous level. Despite that, the ratio as of current illustrates a downward trend, and it now stands slightly above the -2 SD band at 1.289.
Figure 4.11 Forward P/BV Band Source: Refinitiv and team calculation
4.2.1.3 Trailing and Forward EV/EBITDA ratios
The EV/EBITDA ratios for both trailing and forward also depict a downward trend over the 4-year period. The figure (Figure 4.12) initially stood at above the +2SD band at the beginning of the period, but fluctuated and eventually dropped significantly to just below the -2SD band at the end of 2019. Since then, it had recovered and bounced back above its historical average level, but dropped back to tread around the -1SD band slightly after. It now stands at just below the -1SD line at approximately 6.54. The EBITDA of the firm has been on an upward trend since 2018, rising from 1251.3 to 2859.16. As such, this can be the primary reason why the figure has been dwindling below the -1SD band for the period.
Figure 4.12 Trailing EV/EBITDA Band Source: Refinitiv and team calculation
For the forward band (Figure 4.13), a similar drop is illustrated toward the beginning of 2020. The overall movement seems to be a bit more gradual for the forward band, seeing as how it fluctuated within the threshold of the +1SD band and the -1 SD Band. As of now, it stands at 6.39, just above the -1 SD band.
Figure 4.13 Forward EV/EBITDA Band Source: Refinitiv and team calculation
Overall, the historical multiple bands seem to illustrate that PRM seems to be slightly undervalued relative to its historical valuation ratios over the last 4 years. However, results from the multiple bands seem to vary between the figures moving around its -1SD band or even moderately above the -2 SD band in certain bands.
Seeing as how in most bands it moves at approximately just above the -1SD band, there is not enough evidence to conclude that the firm is undervalued, as the fact that it has been fluctuating slightly below the average in most cases might just be a result of the aftermath of COVID-19 and the war in Ukraine (high energy price inflation), and the repercussions that it has had on the stock market in general.
4.2.2 Peer group multiples
The peer group multiples are valuation methods that compare the company in question with comparable peers from similar industries or with reasonable overlap in terms of business segments. Doing so allows us to determine the financial
performance of PRM relative to other firms.
The peers that we chose as a benchmark for comparison for PRM are VL, SUSCO.BK, AMAm.BK, PVG.HN.
4.2.2.1 Selection of peers
As previously mentioned in our competitive analysis segment in the prior chapter, Prima Marine main revenue derives from the Oil and Petrochemical Tanker Business and Floating Storage Unit. This means that in Thailand, there is only one directly comparable peer, which is VL Enterprise PC. Despite that, we cannot conduct a peer group multiples analysis with only one comparable peer, so we decided to also include companies with overlapping segments and also a direct competitor from other countries.
For other firms we have chosen as benchmark for peer group multiples, we opted for companies with sizable business segments in relation to Oil and Petrochemical as much as possible, and the peers we have chosen under this criteria are SUSCO.BK and PTG.BK. Peer analysis valuation data from Refinitiv also chose these 2 companies as comparable peers for PRM as well.
For SUSCO.BK, its associated company, Siam Mongkol Marine Co., Ltd., operates in an oil marine tanker business, which can be considered comparable to the FSU business segment of PRM.
As for AMAm.BK, the company operates 9 tankers and conducts its business in the transportation of palm oil,crude oil, and petrochemicals, the latter of which matches with the business operation of PRM. Similarly, they also operate primarily in Southeast Asia and Asia Pacific, meaning that it is rational to draw comparison between the two firms.
On the other hand, PVG.HN is a Vietnamese company, but with a relatively similar business operation as that of PRM. Its business operation centers around the trading of crude oil and petroleum products both domestically and overseas, meaning that the likelihood of its clients overlapping with that of PRM is high, and therefore can be considered as a comparable firm.
4.2.2.2 Peer group comparison of multiples
Table 4.3 Peer Group Multiples
Source: Refinitiv and team calculation
Table 4.3 exhibits the multiples of the peers of PRM that we have chosen from the criteria as stated in the previous segment. The data here shows the stock and company name along with other essential information such as the market capitalization, the closing price (as of 20th of July 2022), the trailing P/E, P/BV, and EV/EBITDA. Initially, the market capitalization for PRM.BK dwarfs those of others by quite a significant margin, indicating that the size of the firm is quite different from its peers in the group.
Additionally, the peer average and median are calculated using figures from peers, but excluding those of PRM.BK. We can see that the P/E of Prima Marine PCL is relatively lower than both the average and median, and is only second to SUSCO.BK, whose P/E is slightly lower. The P/BV ratio of PRM.BK, however, seems to be marginally higher than its peers, exceeding even that of VL, which is the highest among the peers. Lastly, the EV/EBITDA varies between 6 to 9, with the only outlier being PVG.HN, whose figure is in the negative. The EV/EBITDA of PRM.BK stands at 6.34, which is slightly below the peer median of 6.66, but surpasses the average of 4.42. However, due to the inclusion of PVG.HN’s EV/EBITDA of -5.36, it might be more accurate to base our comparison on the median rather than average, seeing as how the average would be more affected by the impact of an extreme outlier in this case.
4.2.2.3 Peer group comparison of fundamentals and outlook Table 4.4 Peer Group Financial Ratios
Source: Refinitiv and team calculation
Table 4.4 compares important financial ratios of PRM.BK and its peers in order to delve into further details regarding each company’s financial performance. First, the beta of the company represents the volatility of the stock relative to the market. Most peers in this particular benchmark possess a beta of 1 or higher with the only exception being PVG.HN, whose Beta is slightly lower. Looking at the peer average and median, we can see that the beta of companies within this industry or of comparable fields tend to be around 1.16 and 1.10 respectively. The beta of PRM.BK, therefore, can be considered slightly higher than usual, indicating that it is moderately riskier than other peers.It is second only to AMAm.BK whose beta lies at 1.61.
The Return on Equity for PRM.BK, however, is around 14.70%, which is substantially higher than its peer by a large margin and also exceeds
the average and median by a little under 10%. Additionally, the debt ratio also indicates that PRM.BK has a higher proportion of debt compared to its peers, having 41.09%
compared to the median of 32.99%. It is also more accurate to use the median as the benchmark for this criteria due to the outlier being PVG.HN, whose debt stands at 0%.
On the other hand, while PRM.BK has the lowest payout ratio of 52%, which is quite low based on both the average and median, its dividend yield is moderately higher than any other peers at 5.10%. In terms of net profit margin, PRM.BK also significantly exceeds others by a significant amount at 21.40%. Observing the average and median, we can see that the net profit margin average and median tend to be minimal.
The last two columns are the EPS growth and EPS compound annual growth for the period as indicated in the table. PRM.BK significantly outperforms others in these two aspects, as peers from similar industries tend to have a negative EPS growth rate and compound annual growth for the given period, with PRM.BK having the highest value in both criteria at 69.70% and 14.13% respectively.
4.2.3 Target Price
Table 4.5 Target Price Calculation
Source: Refinitiv and team calculation
The table above (Table 4.5) illustrates the calculation for the target price for the forecast of the stock price of PRM.BK for 2022 and 2023 using multiples acquired from the median of peer group multiples in section 4.2.2.2. The rationale for using median rather than the average is to mitigate the impact of outliers within the peer’s valuation on certain values with extremities such as in the case with VL drastically high P/E or negative EV/EBITDA from PVG.HN. By multiplying the multiples medians with figures from the average of the analyst estimates acquired from Refinitiv, we can estimate a target price with each of the multiples.
We can then calculate the average of the target prices we acquired from each band in order to determine the average target price for the year. Following this, the upside/downside percentages can be determined by subtracting the current price from the acquired target price, after which the resulting figure is divided by the current price.
The results as indicated here for both years depict an upside of 28% and 43% for 2022 and 2023 respectively, which is a positive indication to buy for PRM.BK stock.
4.2.4 Sensitivity Analysis
Table 4.6 Calculation of Sensitivity Analysis
Source: Refinitiv and team calculation
Worst Base Best
0.34 0.45 0.56
Worst 17.91 6.05 8.06 10.08
Base 22.39 7.56 10.08 12.59
Best 26.87 9.07 12.09 15.11
0.2 0.5 0.3
Current Price as of 26/7/22
Baht 5.300
EPS (Bht) Fair Price (Bht)
P/E
Probability Fair Price Calculation
Worst
10.781 Baht
Base Best
Upside/Downside (%) 103%
Fair Price Calculation
10.781 Baht
Utilizing the P/E multiples of 22.39 that we obtained from the peer median calculation as the Base P/E, we can conduct a sensitivity analysis to determine an average fair price via this method. The best-case P/E is assumed to be 1.2x of the base case, while the worst-case P/E is set to be 17.91 or approximately 0.8x of the base P/E.
We assume that the probability of a worst, base, and best case are 0.2, 0.5, and 0.3 respectively. The EPS we utilized as the base is 0.45, which is the forward EPS for the same year. In similar fashion, the best-case EPS is 1.25x the base, while the worst case is around 0.75x of the base case. From this calculation, the average fair price here is 10.781 Baht, which is considerably higher than the current price.
The upside compared to the current price as of 26th of July 2022 is approximately 103%, which also indicates that the stock price as of current is undervalued. However, the disparity between the average fair price and current stock price of PRM.BK might just be a result of a rather high P/E median, whereas the P/E of PRM.BK is only slightly higher than that of the minimum P/E we constructed in the multiples table.
4.3 Valuation Recommendation
Our team has made use of several valuation methods in order to ensure an accurate valuation from several methods. Despite that, we are of the opinion that the most suitable relative valuation method to draw a rational conclusion from would be via using historical multiple bands. The reason for this can be attributed to the lack of comparable peers for PRM.BK. Not only does the firm have significantly higher market capitalization compared to its peers, other firms apart from VL Enterprise are also slightly different in terms of its primary business operation from the company, which might result in large differences when peer group multiples are compared. For instance, AmaMarine deliveries consist primarily of palm oil and vegetable oil, which might contrast with the primary business operation of PRM.BK, whose primary customers lean more toward refineries.
Looking at the valuation from historical multiple bands, we can see that the figure for PRM.BK as of current varies between just under the average band or slightly above the -1SD band. As such, relative to its history, there is not enough gap between
its historical average and current valuation ratio to draw a conclusion to BUY. However, we have also discovered that the standard deviation band gaps are wider than they should have been, attributing to the strong fluctuations in the first 3 years of the given period, meaning that the undervaluation might just be more significant that what we initially have thought. Combined this with the mostly positive outlooks from the forecast we obtain via peer multiples and sensitivity analysis, we would recommend a BUY, but investors should also wait and anticipate possible rebounds following the recovery of pandemic or the impact of the war in Ukraine, especially now that the price of oil and its respective demand starts to show signs of recovering back to its prior level.
CHAPTER V INVESTMENT RISKS
Risk assessments provide a strong foundation for any sound investments.
This chapter, therefore, illustrates and describes the risks factors that could potentially be detrimental to the operations and by extension the profitability of the company. The risks factor as illustrated here will be primarily focused on industry risks, seeing as how PRM.BK has a solid liquidity position and strong debt serviceability.
Figure 5.1 Risk assessments
5.1 Macro and Industry Risks
5.1.1 Risk from the possibility of Coronavirus (COVID-19) pandemic resurgence
The impact of the COVID-19 pandemic had proven to be severe to myriads of industries worldwide on an unprecedented level. The Thai economy has suffered severely from the stringent regulations on travel and social distancing, resulting in a significant slowdown in economic growth. The Oil and Petrochemical Tanker Business of PRM.BK is no exception to the disruption from the pandemic. With the prevention measure regarding airline travel, fuel oil consumption took a rather significant dive on near global scales, leading to a strong drop-off in consumption requirement especially in Asia Pacific.
This is made clear by the impact on the revenue of the first quarter of 2021 as indicated by the Management Discussion and Analysis of the first quarter of PRM.BK.
Table 5.1 The impact on the revenue of the first quarter of 2021 as indicated by the Management Discussion and Analysis of the first quarter of PRM.BK.
Source: PRM Management Discussion and Analysis
We can see a rather moderate drop-off in both figures attributable to the COVID-19 pandemic in the first quarter of 2021.
Table 5.2 The impact of COVID-19 on the revenue of the first quarter of 2021
Source: PRM Management Discussion and Analysis
There is, however, a slight rebound in revenue following the next quarter, but this is not an indication that the firm is unaffected by the pandemic. The increase in revenue during this timeframe aligns with the company’s acquisition of additional vessels from Truth Maritime Company Limited, leading to an increase in revenue. We can see that the gross profit for the quarter is still at loss, and this is due to the continuous outspread of COVID-19.
The offshore business unit of PRM.BK is also affected by the pandemic as well, albeit to a lesser degree. There is a moderate increase in administrative expenses arising from stringent COVID preventive measures that necessitate the use and procurement of equipment that abide by the regulations, such as the Antigen Test Kit (ATK), protective gear, hygienic masks, hand sanitizers etc. Were there to be a resurgence in COVID-19, possibly attributing to new COVID variants or an influx of new cases, businesses in general are likely to suffer significantly, and the possibility of another economic downturn might not be out of the question.
5.1.2 Risk from the fluctuations and volatility in demand and supply of oil consumption
The business operations of PRM.BK is directly tied to the demand and supply of oil consumption, whether it be in regards to the transportation of petrochemicals or the storage of these substances. When crude oil price increases, people are less inclined to purchase and store them, while firms are likely to store more when the oil price drops. The second quarter of 2022 sees a rebound of oil demand and by extension its price, following the gradual economic recovery from the pandemic and
lighten preventive measures now that vaccine coverage is gradually improving. Despite that, it is possible that a fluctuation in demand and price is on the horizon for the oil and petrochemical market.
To begin with, a resurgence of new waves of COVID-19 could result in the return of stringent regulatory measures, leading to a possible drop-off in air travel. In addition, the turmoil from the Russia - Ukraine conflict was one of the primary reasons for the scarcity in oil, especially with Russia being heavily sanctioned despite being one of the major producers of oil. It is an arduous task to gauge how prolonged the war will be, and for that reason, it is reasonable to assume that fluctuations in demand and supply will be a given for the foreseeable future.
5.1.3 Risk from possible drastic change in transportation service business
As of current, the transportation of fuel oil for marine transportation primarily concerns crude oil and petroleum products. The company now, however, anticipates the arrival of other types of closely-related transportations energy sources, which could be battery, Liquefied Natural Gas, or Hydrogen Fuel. PRM.BK has expressed concerns over possible new entrants to the market from such occasions, and the difficulty by which their operations could be gauged relative to that of PRM.BK and whether they could be considered as competitors from the same industrial business.
5.2 Company-specific Risks
5.2.1 Risk from difficulty regarding the purchase and selling of vessels The primary business operations of PRM.BK require the need to both purchase additional vessels and sell accordingly depending on the current level of demand and circumstances regarding petrochemical marine transportation. As such, transactions involving vessels or fleets occur on a moderately frequent basis. However, there are some caveats when it comes to both buying and selling. The scope of businesses to buy or sell vessels from are rather limited, making negotiations and buying opportunities quite constrained. If the firm cannot sell a vessel, there is maintenance
cost to keep in mind for the freight or vessel in question. On the other hand, not having enough vessels leads to possible loss in opportunity from having inadequate vessels to meet demands, resulting in lower sales.
CHAPTER VI CONCLUSION
In prior segments of the thematic paper, we conduct an assessment on the company’s valuation in order to achieve a rational investment recommendation as to whether the prospect of PRM.BK indicates that it would be an appropriate decision to invest in the company under the current circumstances. With regard to the valuation methods, we have assessed the company using relative valuation and discounted cash flow model. For the former, historical multiples are conducted to assess the company relative to its historical performance. Both trailing and forward values of P/E, P/BV, and EV/EBITDA are utilized in our computation for this section. We also use peer multiples to provide a valuation of the company relative to firms we have deemed as comparable as peers to PRM.BK. We also use sensitivity analysis to gauge a fair price under different scenarios for the company’s stock price. Lastly, there is always room for reassessment considering the circumstances regarding fuel oil and petrochemicals. For instance, the lift on sanction on Russia could alleviate the scarcity of oil to an extent, resulting in potentially lower price point, which could affect our assessment of the industry as a whole.
6.1 Investment Recommendation
Figure 6.1 Investment Recommendation
EPS (Trailing 12 Months) 0.50 Trailing P/E Band
Average Trailing P/E 13.94
Target Price 6.97
Forward P/E Band
Average Forward P/E 13.38
Target Price 6.69
Average Target Price 6.83
For the reason we have obtained from our assessment of the firm via relative valuation we made primarily relative to its own history, while there is not enough gap between its historical average and current valuation ratio to draw a conclusion to BUY, we discovered that the gap in our standard deviation bands were wider than we anticipated as a result of strong fluctuations in the first 3 years of the given period, resulting in the undervaluation of the stock not being as apparent.
To this end, we calculate a target price we deemed appropriate for PRM.BK based on its historical multiple bands, specifically those of the trailing and forward P/E.
Using the average historical P/E of both bands, we can calculate the average target price for PRM.BK from our preferred multiples, and the target price we obtained via this method is 6.83 Baht.
Figure 6.2 The average target price for PRM.BK
This target price is an upside of 29% from the current stock price of PRM.BK as of 26/7/22, which indicates a signal to BUY.
As such, the recommendation we have regarding PRM.BK stock is to BUY and anticipate possible rebounds following the aftermath of the pandemic and the impact from the Russian-Ukraine conflict.
6.2 Limitations
There are a few aspects in our valuation that could be considered as limitations to our assessment and might lead to possible deviations from our target price that we have initially forecasted. These aspects will be listed in the following section.
Upside/Downside (%) 29%
Average Target Price Current Price as of 26/7/22
6.831 Baht 5.300 Baht
6.2.1 Differences from comparable peers
In our competition analysis, we highlight the fact that the business units of PRM.BK make it so that there are no direct and comparable competitors in Thailand except VL Enterprise PLC, which can be considered as a peer for the tanker business.
However, in our relative valuation, it is not feasible to conduct a peer multiple with only one competitor. As such, we opted for closely-related firms with relatively similar primary business operations and categorized them as comparable peers. However, this compromise we made led to significant differences between the multiples of PRM.BK compared to its peers, along with the market capitalization of the company, which completely exceeds that of others. This is one of the reasons why we based our target price forecast on the historical multiples rather than the peer multiples.
6.2.2 Outliers from extraordinary events
While we can anticipate the impact of extraordinary events like the COVID- 19 pandemic or the war between Russia and Ukraine to the financial standing and performance of PRM.BK to an extent, there is no denying that these events have an adverse impact on the economy as a whole and by extension the drop-off in financial performance of the company in certain areas. In our valuation, we are of the opinion that the historical average figures would likely be deviated by outliers from such events, leading to slight oddity in our valuation on a few occasions.
REFERENCES
Prima Marine Public Company limited (2021, May 13). Management discussion and analysis 31 March 2021.https://classic.set.or.th/set/pdfnews.do?
newsId=16208607450160&sequence =2021056211
Prima Marine Public Company limited (2021, August 11). Management discussion and analysis 30 June 2021. https://classic.set.or.th/set/pdfnews.do?
newsId=16286329394380& sequence=20210 87845
Prima Marine Public Company limited (2022, March 22), Annual Report 2021.
https://investor. primamarine.co.th/misc/flipbook/index.html?id=253887 SETSMART. Financial statement of Prima Marine Public Company limited.
https://www.set smart.com/ssm/financialStatement;symbol=PRM
Refinitiv (2022), Peer Analysis of Prima Marine Public Company limited.
https://workspace.refinitiv.com/web/Apps/Corp/?s=PRM.BK&st=RIC#/A pps/PeersRelVal
Refinitiv (2022), Valuation of Prima Marine Public Company limited.
https://workspace.refinitiv.com/web/Apps/Corp/?s=PRM.BK&st=RIC#/V aluation
Refinitiv (2022), Price History of Prima Marine Public Company limited.
https://workspace.refinitiv.com/web/Apps/Corp/?s=PRM.BK&st=RIC#/A pps/PriceHistory
Refinitiv (2022), Forecast Multiples of Prima Marine Public Company limited.
https://workspace.refinitiv.com/web/Apps/Corp/?s=PRM.BK&st=RIC#/c ms/forecast-multiples