S tudy on
JTEDs
J
uvenile andT
rashE
xcluderD
evices inM
yanmarSOUTHEAST ASIAN FISHERIES DEVELOPMENT CENTER
Study on Juvenile and Trash Excluder Devices (JTEDs) in Myanmar
Bundit Chokesanguan, Suppachai Ananpongsuk, Kin Manng Ae, Win Ko Ko and Weerasak Yingyuad
SEAFDEC Training Department, P.O.Box 97, Phrasamutchedi, Samut Prakarn, 10290, Thailand
Southeast Asian Fisheries Development Center Training Department
TD/RES/100
Printed by the Southeast Asian Fisheries Development Center, Training Department P.O.Box 97, Prasamutchedi, Samutprakan, 10290, Thailand
ISBN: 978-974-88196-4-8
Study on Juvenile and Trash Excluder Devices (JTEDs) in Myanmar
Bundit Chokesanguan, Suppachai Ananpongsuk, Kin Mong Ae, Win Ko Ko and Weerasak Yingyuad
SEAFDEC Training Department, P.O.Box 97, Phrasamutchedi, Samut Prakarn, 10290, Thailand
ABSTRACT
The SEAFDEC Training Department, in cooperation with the Department of Fisheries, Myanmar conducted experiments on Juvenile and Trash Excluder Devices in Myanmar. The objective of the experiment is to compare the efficiency for catch and release of juvenile and trash fishes using different escape openings of JTEDs. The rigid sorting grid with a bar space of 1, 2 and 3 cm was operated at 5 stations each.
The window shaped JTED and semi-curved JTED were operated at 4 stations and 3 stations, respectively. There were a total of 22 operations.
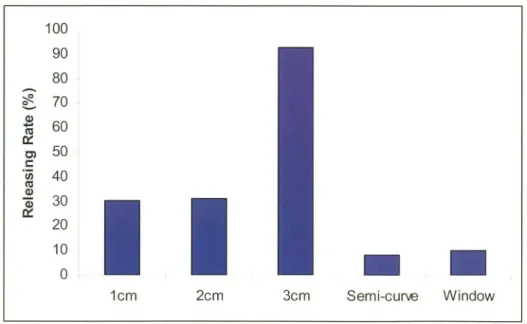
The CPUE of the fish trawl net operated in Myanmar waters was 99.75 kg/hr/haul. The escape rate of the trawl net catches using the rigid sorting grid JTEDs with 1, 2, 3-cm bar spacing, the window shaped and semi-curved JTEDs was 30.39, 31.26, 92.62, 8.43 and 9.87%, respectively. However, some large fish could escape the rigid sorting grid with bar spacing of 2 and 3 cm, window shaped and semi-curved JTEDs. The groups of escaped catches were trash fish, demersal fish, pelagic fish and cephalopod with escape rate of 43.49, 41.05, 10.24 and 5.22%, respectively. The major species of commercial-demersal catch that escaped from all JTEDs was Saurida tumbil and followed by Nemipterus sp. and Upeneus sp. Nemipterus sp. The size of the escaped species caught in cod-end was larger than those caught in cover net.
KEYWORDS: Bottom trawl, Escape rate, Juvenile and Trash Excluder Devices (JTEDs)
Introduction
Trawl net is one of the most efficient fishing gears used all over the world.
However, there are many discarded by-catch by trawl net in the Southeast Asian region because the Southeast Asian region is in the tropical zone with multi species.
The fishermen who operated trawl fishery do not want to lose any profit from their catch. Therefore, they used everything that caught by the trawl net including juvenile and small sized species. Sometime trawls operate in shallow coastal waters causing adverse effect on the areas where more immature juveniles of commercially important fish are caught. To avoid the rapid decrease in fish stock, many modifications of BRDs (By-catch Reduction Devices) have been developed to solve those problems.
Following the successful collaborative project with SEAFDEC member countries for responsible fishing on Turtle Excluder Devices (TEDs) in 1997, SEAFDEC/TD (Southeast Asian Fisheries Development Center/Training Department) in Thailand continued to promote responsible fishing by using selective devices, namely JTEDs (Juvenile and Trash Excluder Devices) in Thailand, Brunei Darussalam, Vietnam, Malaysia and Indonesia. The SEAFDEC/TD has carried out a series of experiments on releasing juvenile and trash fish by installing JTEDs in shrimp-trawl nets. The first experiment was conducted in the gulf of Thailand using the window-shaped and semi-curved JTEDs; the second in the waters off the coast of Maura Town, Brunei Darussalam using the better developed JTEDs with a rigid sorting grid; the third off Cat Ba Island in Hai Phong Province, Vietnam; the fourth in the waters off the coast of Alor Setar, Kedah State of Malaysia. From those four series of experiments it is found that the rigid sorting grid JTED has a better separating performance than the rectangular and semi-curved JTEDs. In May 2002, SEAFDEC/TD organized a Regional Practical Workshop on Selective Fishing Devices in association with the FAO/GEF project to promote the selective fishing devices under the responsible fishing technology and practices program. This was done through training and demonstrations to the participants from member countries.
Indonesia was selected as the first country to continue this project at Sorong in August 2002. This was the fifth series of experiments on JTEDs and was conducted in cooperation with the Indonesian fisheries department in the coastal waters off Bintuni Bay of Arafura Sea, Papua in Indonesia. The results were similar to other previous experiments. The sixth experiment was conducted in Manila Bay, the Philippines, in cooperation with BFAR/Philippines from April 28 to May 8, 2003. The results were satisfactory. The seventh experiment and demonstration were conducted the in Brunei Darussalam, in cooperation with the Brunei Darussalam fisheries department. That was the second series of experiments in Brunei Darussalam after the first set in 2000.
The ninth experiment was conducted in Myanmar in 2004 in cooperate with the Department of fisheries of Myanmar.
Materials and methods
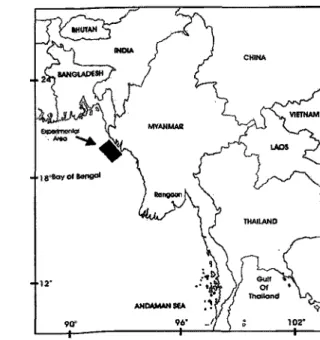
The experiment was carried out off coast the Thandwe City in northwestern coast of Myanmar from 18° 15.0’ N to 18° 28.5’ N and 94° 08.7’ E to 94° 19.0’ E (Fig. 1). The fishing operation employed a 97-ton and 356-horsepower double rig shrimp trawler with an overall beam of 6 m and length of 20 m. The towing speed varied approximately between 2.5 and 2.9 knots. Each type of JTED rigid sorting grid with a bar spacing of 1, 2 and 3 cm was operated 5 times, an hour for each trawling;
the semi-curved and window JTEDs was operated 4 and 3 times, respectively. The total number of operations was 22.
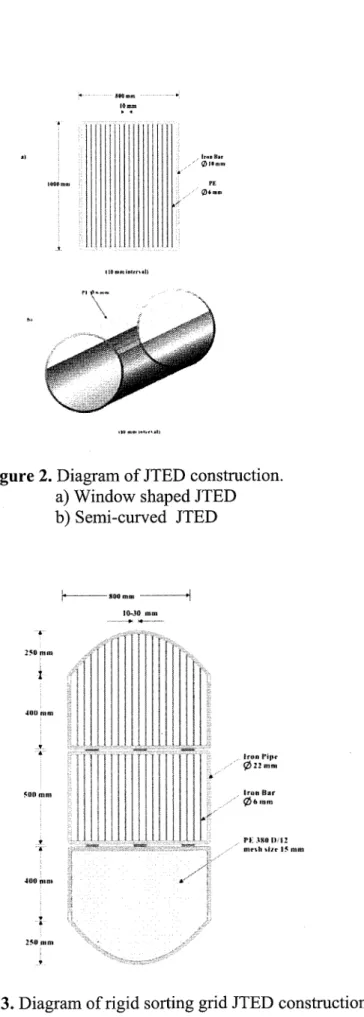
The modified JTEDs were designed to release juveniles, small fishes and trash fishes, meanwhile to retain bigger sized catches in the cod-end. There were three types of JTEDs used in these experiments: semi-curved, rectangular shaped window (Fig.2) and the rigid sorting grid (Fig.3) with bar spacing of 1, 2, and 3 cm. The size of the iron frame for semi-curved JTED and rectangular shaped window was 80 x 100 cm2 made of 10-mm diameter Rod, and the escape opening used 6-mm diameter polyethylene rope in the vertical soft grid. The rigid sorting grid JTEDs modified from the Norwegian NOFITRAOMSA/S Sort-X system were made in three sections.
The front and central sections were grids and the main frame was made of iron bar in 10-mm diameter, and the grids were also of iron with 6-mm diameter. Lastly, the rear section was a panel covered by PE 380d/12 net of 25-mm mesh size. The sides of the rigid sorting grid used a chain to connect the front and rear panels. The shape and angle of the JTEDs were set at 45° clockwise and 50° anti-clockwise against the horizontal plain. In these experiments net with PE 250d/12 of 15-mm mesh size was used to cover all escape openings and the cod-end. The latter was attached to supporting hoops with a diameter of 1.30 m.
Figure 1. Experimental area in Myanmar waters.
Figure 2. Diagram of JTED construction.
a) Window shaped JTED b) Semi-curved JTED
Figure 3. Diagram of rigid sorting grid JTED construction
Data collection and estimate of trawl net selectivity
The entire catch in the cod-end and the cover net were divided into species
components and weighed. Escaped fish from the trawl net using JTED devices were calculated as:
Escape (%) = W cover net x 100/( Wcod-end + Wcover net) ( 1) Where, Wcover net is the catch weight (kg) in the cover net
Wcod-end is the catch weight (kg) in the cod-end
The escape rate (E in %) from the cod-end is given by following equation.
E = (Wv X 100) / Wt (2)
Where, E is escape rate (%)
Wv is weight of catch in the cover net Wt is total weight.
The trawl net selectivity curve was estimated using a linear model described by Pope et. al. (1975) and Jones (1976). This method is the most commonly used by comparing the length compositions of the fish remaining in the cod-end and in the cover net, and the probability of escape through large mesh net can be estimated.
1. Linearized model
Trawl selection curve was approximated by the following equation.
S = 1 /{1 + exp(a + b*l)} (3)
Where, l is the total length of the fish and a and b are constants.
The equation is linearized by converting to logarithms:
ln(1/S– 1 ) = a + b*l (4)
In this model, the parameter is estimated by minimizing the following:
n
∑ [ ln {(1/S) – 1} – (a + b*l)]2 i= 1
(5)
From equation 4, the regression coefficient is obtained as:
b = ∑ [(l – l)(y – y) ] / ∑ (l – l ) (6)
Where y = ln[(1/S) – 1], and y is average. The intercept “a” is calculated by the following equation:
a = y – bl (7)
Results
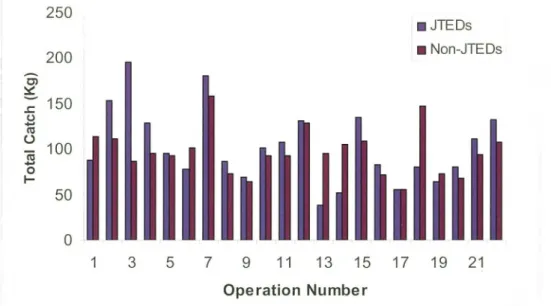
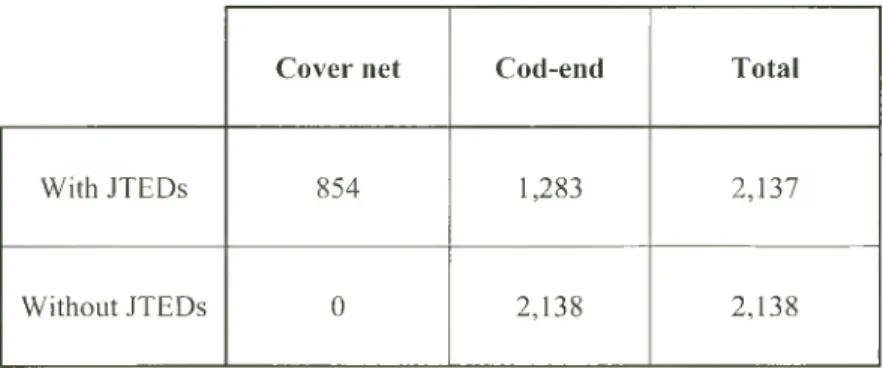
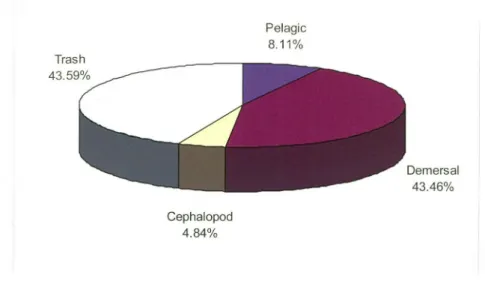
The experimental results show that the catch per unit effort (CPUE) of the trawl net in Myanmar is 99.75 kg/hr/haul. In total, 4,275 kg of catches were collected from 22 trawl operations (Figure 4); the catches in the cod-end of trawl net with and without JTEDs attached was 1,283 and 2,138 kg, respectively (Table 1). The portion of catches by the group of trash fish, demersal fish, pelagic fish and cephalopod was about 43.59, 43.46, 8.11 and 4.84%, respectively (Figure 5).
Figure 4. The total catches in the cod-end of trawl net from 22 operations
C over net C od-end Total
With JTEDs 854 1,283 2,137
Without JTEDs 0 2,138 2,138
Table 1. Total catches (kg) in cover net and cod-end in trawl net with and without JTEDs attached
Figure 5. Portion of catches from trawl net by various groups in 22 operations The results show that the rigid sorting grid with 3-cm bar spacing has the highest release rate at 92.62%; follow by 2 and 1-cm bar spacing at 31.26 and 30.39
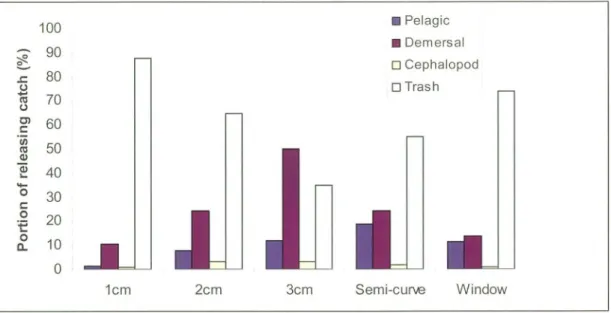
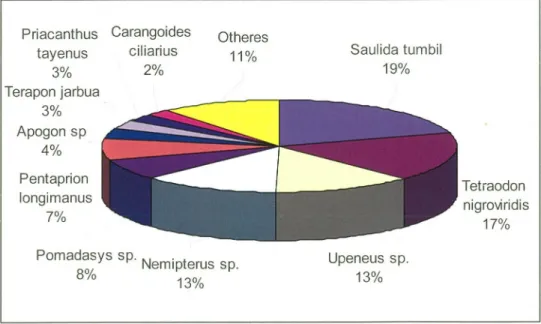
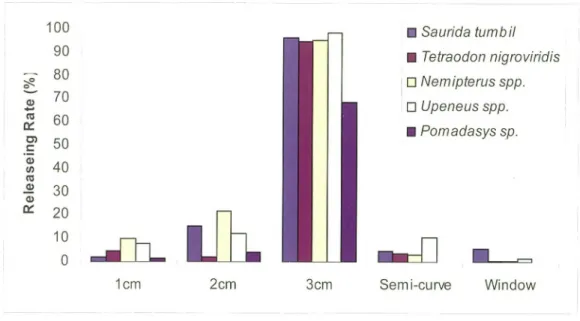
%, respectively. The escape rate of the semi-curved JTED and rectangular shaped window JTED is 8.43% and 9.87%, respectively. The escape rate for each type of JTEDs is shown in figure 6. The pattern of escaped group for each type of JTEDs is similar, i.e. the trash fish is the most released following by demersal, pelagic and cephalopod (Figure 7). The escape rate (%) of trash fish from the total catch is relatively high compared to other groups. The rank of escape rate among the four demersal fish is in order of Saurida tumbil, Tetraodon nigroviridis, Nemipterus sp and Upeneus sp. (Figure 8). But the most releasing species was Nemipterus spp. (Figure 9).
The average size of those four species caught in cod-end is larger than average size of the catch in the cover net (Table 2).
Figure 6. The releasing rate (%) for rigid sorting grid in 1, 2, 3-cm bar spacing, semi-curve and window JTEDs
Figure 7. Portion of releasing rate by group from each type’s of JTEDs
Figure 8. Portion of demurral catch by species from trawl net in the experiment
Figure 9. Releasing rate of demersal fish from various type of JTEDs
Table 2. The average total length (cm) of three main demersal species caught in cod- end and cover net
1cm 2cm 3cm S em i-cu rv ed W in d o w
Cod-end cover Cod-end cover Cod-end cover Cod-end cover Cod-end cover Saurida tumbil. 22.41 18.92 21 .2 9 18.83 24.35 22.39 23.26 22 .5 0 22.85 20.15 Nemipterus spp 11.64 8.90 13.43 11.17 12.63 12.55 12.78 11.59 11.76 11.50 Upeneus spp. 13.25 8.66 14.24 13.08 14.41 13.56 13.16 13.33 13.26 12.11
The relationship between total length (TL) and body width (BW) of Nemipterus spp., Saurida tumbil, and Upeneus spp. is shown in Figure 10. The selectivity curve of Nemipterus spp. can be calculated for the rigid sorting grid JTEDs with 1 and 2-cm bar spacing and semi-curved JTEDs (Figure 11), and Saurida tumbil can be calculated for the rigid sorting grid JTEDs with 2 and 3-cm bar spacing and semi-curved JTEDs (Figure 12). The selectivity curve of Upeneus sp. can be calculated for the rigid sorting grid JTEDs with bar spacing of 1 and 2 cm and semi- curved JTEDs (Figure 13).
Figure 10. The relationship between total length (TL) and body width (BW) of Nemipterus sp., Saurida tumbil and Upeneus sp.
Figure 11. The selectivity curve of Nemipterus spp. calculated for the rigid sorting grid JTEDs with 1 and 2-cm bar spacing and the semi-curved JTEDs
Figure 12. The selectivity curve of Saurida tumbil calculated in case of the rigid sorting grid JTEDs with 2 and 3-cm bar spacing and the semi-curved JTEDs
Figure 13. The selectivity curve of Upeneus spp. calculated in case of the rigid sorting grid JTEDs with 1 and 2-cm bar spacing and the semi-curved JTEDs
Conclusions and Discussion
This study shows the fishery resources is rich in Myanmar waters as indicated by the catch per unit effort (CPUE) of the trawl net about 100kg/hr/hual. This value is higher than other Southeast Asian countries except Brunei Darussalam with 283.27 kg/hr/haul. Cleary, those JTEDs affected the catches of trawl net as the total catch of the trawl net attached with JTEDs was reduced by about 38 %. The trash fish and demersal are the two main groups of the catch accounting for 43.59 and 43.46% of total catches. The escape rate of trash fish is 90% higher than demersal fish because most trash fish are small fish and small size species. The escape rate of demersal fishes is 10% in 1-cm bar spacing but it increases to 25% in 2cm and 50% in 3cm.
The escaped groups from both the Window shaped JTEDs and the semi-curved JTEDs are similar to the rigid sorting grid with a bar space of 2 cm.
The escape rate of trawl net catch using the rigid sorting grid JTEDs with 1, 2, 3-cm bar spacing, the window shaped JTEDs and semi-curved JTEDs is 30.39, 31.26, 92.62, 8.43 and 9.87%, respectively. However, some large fish are able to escape the rigid sorting grid with 2 and 3-cm bar spacing, window shaped and semi-curved JTEDs. In the case of the window shaped and semi-curved JTEDs, the filter function of selectivity gear is not clearly shown. As the vary size and number of escaped fishes found in the cover net, it’s likely to be selectivity function of cod-end net plus with a chance of escaped fishes from the opening window. Four main demersal fishes are Saurida tumbil, Tetraodon nigroviridis, Nemipterus sp. and Upeneus sp. But the selectivity of Tetraodon nigroviridis is not calculated because it is not a commercial species. The escape rate of Saurida tumbil, Nemipterus sp. and Upeneus sp. increased from 1 to 3-cm bar spacing of the grid. Those results show the efficiency of JTEDs.
The average size of fish retained in the cod-end and cover net (Table2) increases with bar spacing of Rigid sorting grid JTEDs.
The selectivity can not be calculated for semi-curved JTEDs because the filter function and vary size of escape fish are not clearly shown. The selectivity of rigid sorting grid can be calculated for bar spacing of 1 and 2 cm, but not for the 3 cm because it releases nearly all fish and no large fish to be sampled. Based on the calculated relationship between total length (TL) and body width (BW) of those three major species, it shows that the total length of Nemipterus sp. and Upeneus sp. with 3- cm body width is 21.7 and 22 cm, respectively. Those sizes of fishes could not found in this experiment. It means that using the rigid sorting grid JTED with 3-cm bar spacing will lose a large number of commercial catch.
In conclusion, the escape rate increases with bar spacing from 1 to 3 cm. in rigid sorting grid JTED; only small sized juvenile and trash escape with 1 and 2-cm bar spacing. However, it needs to be determined that which one is suitable for Myanmar waters.
Acknowledgements
The authors would like to thank the Secretary General of Southeast Asian Fisheries Development Center, Mr. Siri Ekmaharaj, for his support. Special thanks to the Fisheries Department of Myanmar, and staff, captain and crew members for contributing to the success of these experiments. And lastly thanks go to Dr. Chang- Kwei Lin, Technical Editorial Officer (TEO) for his advices on the manuscript and comments of this report.
References
Hoydal, K., C.J. Rorvik and P. Sparre, 1982. Estimation of effective mesh size and their utilization in assessment. Dana 2:69-95.
Jones, R., 1976. Mesh regulation in the demersal fisheries of the South China Sea area. Manila, South China Sea Fisheries Development and Coordinating Programme. SCS/76/WP/34. 75 p.
Kimura, D.K., 1977. Logistic model for estimating selection ogives from catches of cod-ends whose ogives overlap. J. Cons. CIEM, 38(1):116-9.
Pope, J.A., et al. 1975. Manual of methods for fish stock assessment. Pt3. Selectivity of fishing gear. FAO Fish. Tech. Pap., (41) Rev. 1. 65p.
Mastawee, P. and Y. Theparoonrat. 2002. Trawl Net Mesh Selectivity for Lizardfish (Saurida elongata) and Blackspotted Trevelly (Caranx leptolepis) Using Square and Diamond Mesh Cod-end. Thai Fisheries Gazette 55: 457-465.
SEAFDEC, 2000. Study on Juvenile and Trash Excluder Devices (JTEDs) in Thailand., SEAFDEC.TD/RES/47. Training Department, Samut Prakan.
SEAFDEC, 2001. Study on Juvenile and Trash Excluder Devices (JTEDs) in Brunei Darussalam. SEAFDEC.TD/RES/82. Training Department, Samut Prakan.
SEAFDEC, 2002. Study on Juvenile and Trash Excluder Devices (JTEDs) in Indonesia. SEAFDEC.TD/RES/83. Training Department, Samut Prakan.
SEAFDEC, 2002. Study on Juvenile and Trash Excluder Devices (JTEDs)in Malaysia. SEAFDEC.TD/RES/72. Training Department, Samut Prakan.
SEAFDEC, 2002. Study on Juvenile and Trash Excluder Devices (JTEDs) in Vietnam. SEAFDEC.TD/RES/84. Training Department, Samut Prakan.
SEAFDEC, 2003. Study on Juvenile and Trash Excluder Devices (JTEDs) in Philippines. SEAFDEC.TD/RES/81. Training Department, Samut Prakan.
SEAFDEC, 2003. Study on 2nd Juvenile and Trash Excluder Devices (JTEDs) in Brunei Darussalam. SEAFDEC.TD/RES/95. Training Department, Samut Prakan.
Sparre, P., E. Ursin, and S.C. Venema. 1989. Introduction to tropical fish stock
Appendix. 1
.
General information of the experiment Station DateHaul No.DurationLatitudeLongitudeDepth CourseSpeedWarp TypeCatch(Kg.)Escape (%)Non- JTEDs (Meter)(Knot)(Meter)CoverCod-endTotal CatchCatch(Kg.) 12/5/200419:1318°- 21.8 N94°- 16.0 E23.4000°2.760.00JTED 1 cm.13.0074.5087.5014.86113.7 22/5/2004210:3518°- 25.0 N94°- 15.8 E23.4350°2.760.0JTED 1 cm.67.9086.00153.9044.12111 32/5/2004313:2118°- 26.4 N94°- 10.4 E25.2180°2.775.0JTED 1 cm.47.5048.2095.7024.2786.5 42/5/2004414:5518°- 22.8 N94°- 12.0 E27125°2.775.0JTED 1 cm.52.0077.10129.1040.2895.5 52/5/2004516:2018°- 22.0 N94°- 14.8 E28.8090°2.780.0JTED 1 cm.27.0068.0095.0028.4292.5 63/5/2004112:5518°- 15.0 N94°- 13.1 E28.8100°2.790.0JTED2cm.24.0054.4078.4030.61101.8 73/5/2004214:2018°- 16.0 N94°- 14.8 E28.8145°2.790.0JTED2cm.57.50123.50181.0031.77158.5 83/5/2004315:4418°- 16.5 N94°- 14.5 E28.8282°2.790.0JTED2cm.25.0062.0087.0028.7473.5 93/5/2004417:0018°- 19.0 N94°- 13.6 E28.8350°2.790.0JTED2cm.25.0044.5069.5035.9764 104/5/200458:4718°- 20.4 N94°- 17.9 E28.8270°2.790.0JTED2cm.29.5071.50101.0029.2193 114/5/2004112:1518°- 20.6 N94°- 16.3 E27290°2.790.0JTED3cm.99.508.50108.0092.1393 124/5/2004213:3518°- 21.1 N94°- 13.4 E28.8205°2.790.0JTED3cm.121.5010.00131.5092.40129 134/5/2004315:1018°- 16.3 N94°- 13.1 E30.6180°2.790.0JTED3cm.33.505.0038.5087.0195 145/5/200449:0518°- 20.6 N94°- 15.8 E28.8270°2.7100.0JTED3cm.51.001.5052.5097.14105.5 155/5/2004510:3018°- 18.5 N94°- 13.2 E32.4190°2.9100.0JTED3cm.127.007.50134.5094.42108.5 165/5/2004112:3518°- 16.3 N94°- 12.2 E32.4020°2.5100Semi curve8.5074.0082.5010.3072 175/5/2004213:5518°- 19.4 N94°- 13.1 E28.8045°2.5100Semi curve5.5050.5056.009.9155.5 185/5/2004315:1518°- 21.2 N94°- 15.0 E27095°2.9100Semi curve15.0065.0066.5018.75147 195/5/2004416:4018°- 19.9 N94°- 16.3 E27000°2.990Semi curve7.5057.0064.5011.6373.5 206/5/200419:2518°- 21.0 N94°- 17.6 E25.2310°2.780.0Window11.0070.0081.0013.5867.9 216/5/2004210:4518°- 20.4 N94°- 16.0 E27180°2.780.0Window10.50100.50111.009.4694 226/5/2004311:5018°- 20.0 N94°- 16.0 E27090°2.780.0Window8.70124.00132.706.56108
THE SECRETARIAT
RO. Box 1046, Kasetsart Post Office, Bangkok 10903,
Thailand
Tel : (662) 940-6326 to 9 Fax : (662) 940-6336
E-mail : [email protected] In tern et : http://www.seafdec.org TRAINING DEPARTMENT (TD) P.O. Box 97, Prasamutchedi, Samut Prakan 10290, Thailand
Tel : (662) 425-6100
Fax : (662) 425-6110 and 425-6111 E-mail : [email protected]
In tern et : http://td.seafdec.org MARINE FISHERIES RESEARCH DEPARTMENT (MFRD)
2 Perahu Road, O ff Lim Chu Kang Road, Singapore 718915
T e l : (656) 790-7973 F a x : (6 5 6 ) 861-3196
E-mail : [email protected]
Internet : http://www.seafdec.org/mfrd/default.htm AQUACULTURE DEPARTMENT (AQD) Tigbauan, 5021 Iloilo,
Philippines
Tel : (63-33) 511-9171 and 336-2965 F a x : (63-33) 335-1008
E-mail : [email protected] In tern et : http://www.seafdec.org.ph MARINE FISHERY RESOURCES DEVELOPMENT AND MANAGEMENT DEPARTMENT (MFRDMD)
Fisheries G arden, Chendering 21080 Kuala Terengganu,
