NATARAT PATANAPEECHAI
A THEMATIC PAPER SUBMITTED IN PARTIAL FULFILLMENT OF THE REQUIREMENTS FOR THE DEGREE OF MASTER OF MANAGEMENT
COLLEGE OF MANAGEMENT MAHIDOL UNIVERSITY
2015
COPYRIGHT OF MAHIDOL UNIVERSITY
EXAMING SUSTAINABLE LEADERSHIP IN APPAREL INDUSTRY
was submitted to the College of Management, Mahidol University for the degree of Master of Management
on
August 29, 2015
……….….…..………
Assoc. Prof. Sooksan Kantabutra, Ph.D.
Advisor
……….….…..………
Assoc. Prof. Annop Tanlamai, Ph.D.
Dean
College of Management Mahidol University
……….………….…..………
Miss Natarat Patanapeechai Candidate
……….
Assoc. Prof. Roy Kouwenberg, Ph.D., CFA
Chairperson
……….….…..………
Asst. Prof. Astrid Kainzbauer, Ph.D.
Committee member
ACKNOWLEDGEMENTS
Firstly, I would like to express my sincere gratitude to my Assoc. Prof. Dr.
Sooksan Kantabutra, Ph.D., for the continuous support of my Master Degree study and research, for his time, motivation, and immense recommendations. His guidance helped me in all the time of research and writing of this thematic paper. I could not have imagined having a more supportive advisor for my thematic paper.
Besides my advisor, I would like to thank the rest of my thematic paper committee: Assoc. Prof. Roy Kouwenberg, Ph.D., CFA, Asst. Prof. Astrid Kainzbauer, Ph.D., for their perceptive comments and encouragement.
Last but not least, I would like to thank my family, especially my parents, for giving me an opportunity to study at College of Management Mahidol University.
Natarat Patanapeechai
EXAMINING SUSTAINABLE LEADERSHIP IN APPAREL INDUSTRY NATARAT PATANAPEECHAI 5649298
M.M. (GENERAL MANAGEMENT)
THEMATIC PAPER ADVISORY COMMITTEE: ASSOC. PROF. SOOKSAN KANTABUTRA, Ph.D., ASSOC. PROF. ROY KOUWENBERG, Ph.D., CFA, ASST. PROF. ASTRID KAINZBAUER, Ph.D.
ABSTRACT
This thematic paper adopts Honeybee’s 23 sustainable leadership practices and examine in Thai apparel industry. Honeybee framework has 23 sustainable leadership elements, which are developing people, labor relations, retaining staff, succession planning, valuing staff, CEO and top team, ethical behavior, long and short term perspective, organizational change, financial markets orientation, responsibility for environment, social responsibility (CSR), stakeholders, vision, decision making, team orientation, culture, knowledge sharing, trust, innovation, staff engagement, and quality. Data collection is adopted from Avery &
Bergstiener (2010), which obtained research from 50 companies in apparel industry.
Honeybee Sustainable Leadership allows organization to study with a framework.
These principles will help the organization to progress and maintain in the long run.
KEY WORDS: Sustainable leadership/ Honeybee/ Apparel/ Corporate sustainable
45 pages
CONTENTS
Page ACKNOWLEDGEMENTS ii
ABSTRACT iii
LIST OF TABLES v
LIST OF FIGURES vi
CHAPTER I INTRODUCTION 1
CHAPTER II LITERATURE REVIEW 2
CHAPTER III RESEARCH METHODOLOGY 6
CHAPTER IV FINDINGS & DATA ANALYSIS 14
CHAPTER V DISCUSSIONS 39
5.1 Discussion Findings 39
5.2 Managerial Implications 39
CHAPTER VI CONCLUSIONS 41
REFERENCES 42
APPENDICES 43
BIOGRAPHY 45
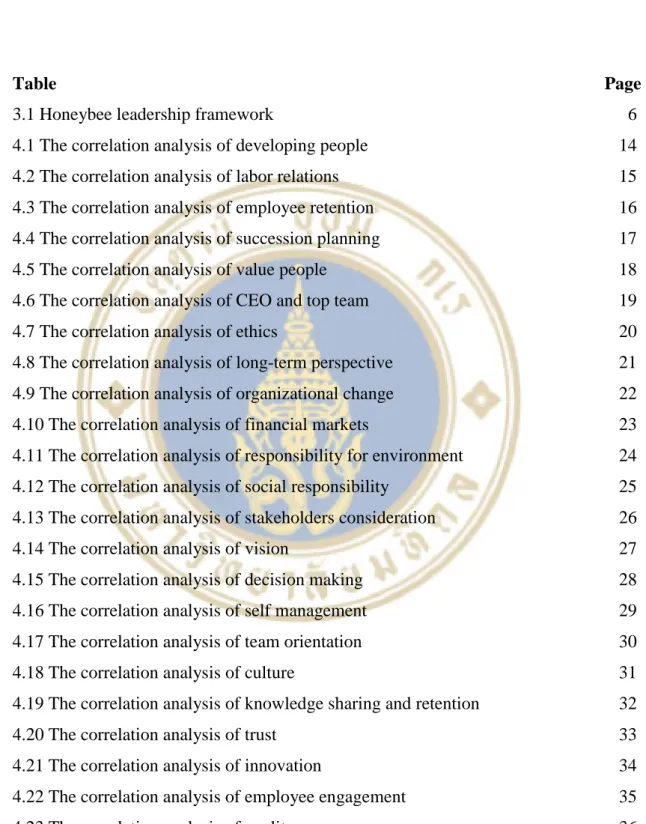
LIST OF TABLES
Table Page
3.1 Honeybee leadership framework 6
4.1 The correlation analysis of developing people 14
4.2 The correlation analysis of labor relations 15
4.3 The correlation analysis of employee retention 16 4.4 The correlation analysis of succession planning 17
4.5 The correlation analysis of value people 18
4.6 The correlation analysis of CEO and top team 19
4.7 The correlation analysis of ethics 20
4.8 The correlation analysis of long-term perspective 21 4.9 The correlation analysis of organizational change 22 4.10 The correlation analysis of financial markets 23 4.11 The correlation analysis of responsibility for environment 24 4.12 The correlation analysis of social responsibility 25 4.13 The correlation analysis of stakeholders consideration 26
4.14 The correlation analysis of vision 27
4.15 The correlation analysis of decision making 28 4.16 The correlation analysis of self management 29 4.17 The correlation analysis of team orientation 30
4.18 The correlation analysis of culture 31
4.19 The correlation analysis of knowledge sharing and retention 32
4.20 The correlation analysis of trust 33
4.21 The correlation analysis of innovation 34
4.22 The correlation analysis of employee engagement 35
4.23 The correlation analysis of quality 36
5.1 Significant Finding Result
LIST OF FIGURES
Figure Page
2.1 Honeybee leadership pyramid 4
3.1 The model and hypothesized relationship 13
4.1 The number of year of operation 14
4.2 The average percentage of domestic and international market and 15 number of employee
CHAPTER I INTRODUCTION
Corporate sustainability has been widely discussed among corporate leaders and scholars. Although it is an important issue, only a few approaches to corporate sustainability have been examined in the Thai context.
The present study therefore adopts Avery and Bergsteiner’s Sustainable Leadership concept that has been supported by previous studies as a relevant approach to corporate sustainability in Thailand. The study examines business practices of Apparel Industry to determine if there is a fit between Sustainable Leadership practices and those of the case company.
The hypothesis will be tested in “Apparel Industry” because fashions change rapidly so it’s difficult for organizations to maintain their businesses. Many fashion firms fail since new brands occur every day and there is a high competition in the market.
To determine the fit, the literature on Sustainable Leadership in Thailand is reviewed in Chapter 2. In Chapter 3, the methodology used to test the Sustainable Leadership concept is explained. This includes how to collect and analyze data. Chapter 4 presents findings, while Chapter 5 discusses the findings and concludes the study with practical recommendations to enhance the prospect of corporate sustainability for the case company.
CHAPTER II
LITERATURE REVIEW
Corporate sustainability is becoming a major part for business leaders concerned with energy and resource shortages, global warming, unethical business practices, and improvingcorporate reputations (Wong & Avery, 2009).
Due to the business breakdowns and failures, which is the cause of existing Anglo/US business model that concentrates on the shareholder value and short term.
Therefore, researchers search for the other preferences in order to support long-term management over the short-term, which seemingly lead to sustainable enterprises.
In contrast, Rhineland comes from Europe’s management principle, offering another approach as its focus on the long-term sustainability of enterprises.
Also, Rhineland values the relationship with other interest groups not only the shareholders (Albert, 1933). Throughout this model, corporate sustainability involves balancing the needs of the firm’s direct and indirect stakeholder (e.g. employees, clients, shareholders, pressure groups, and communities), not forgetting future stakeholder (Dyllick and Hockerts, 2002). Rhineland enterprises not only expect for growing and maintaining the economics, social and environment but also play a big role in the public domain. For instance, the firms attend in social needs and concern about the environment.
Apart from Rhineland, Avery and Bergsteiner introduce the concept of Honeybee leadership, which extend from Rhineland. Honeybee refers to a humanistic approach to corporate sustainability that builds on the Rhineland leadership based on Avery and others have found.
Within this paper, the sustainable enterprises require to meet three the following three conditions: (a) delivering strong financial performance (b) demonstrating the capacity to endure the economic and social difficulties, and (c) demonstrating the ability to maintain a leadership position in its relevant market.
SUSTAINABLE LEADERSHIP: THE RESEARCH FRAMEWORK
Nowadays, there are much more diversity in the world, so it is common to find a different leadership philosophies in each region, sometimes it’s conflicting, sometimes it aligns together. Avery (2005) utilizes 28 case studies from region from all over the world to identify two fundamentally different methods of leading organizations in the industrialized world. Together with Albert (1992,1993), she mentions to these as Anglo/US and Rhineland leadership principles. Research recommends that overall firms led by Anglo/US principles are less sustainable than Rhineland enterprises (Albert, 1992, 1993; Avery, 2005; Avery and Bergsteiner, 2010), and seem to perform less efficient than Rhineland organizations. Since the core aspect of the Anglo/US model only focus on increasing shareholder value. Rhineland –led companies also beat Anglo/US- led competitors on other criteria, including environmental and social measures. In fact, Rhineland enterprises need to achieve all three on dimensions such as financial, social, and environmental (Avery and Bergsteiner, 2010 and 2011;
Bergsteiner and Avery, 2006).
The more socially oriented Rhineland model stands in sharp contrast to leadership based on traditional Anglo/US capitalism (Avery, 2005). Nineteen criteria differentiate the two approaches, which support opposing sets of self-reinforcing leadership practices on each criterion. Even though each criterion may be found in non- Rhineland enterprises, the criteria are concentrated under Rhineland leadership. Avery (2005) obtained her 19 leadership practices initially from a major study of 13 European firms but tested the model in another 15 enterprises from all over the industrialized world.
However, Honeybee leadership is the most holistic approach to ensure corporate sustainability, as Honeybee is a resilient and humanistic approach, which consists of 23 practices as followed
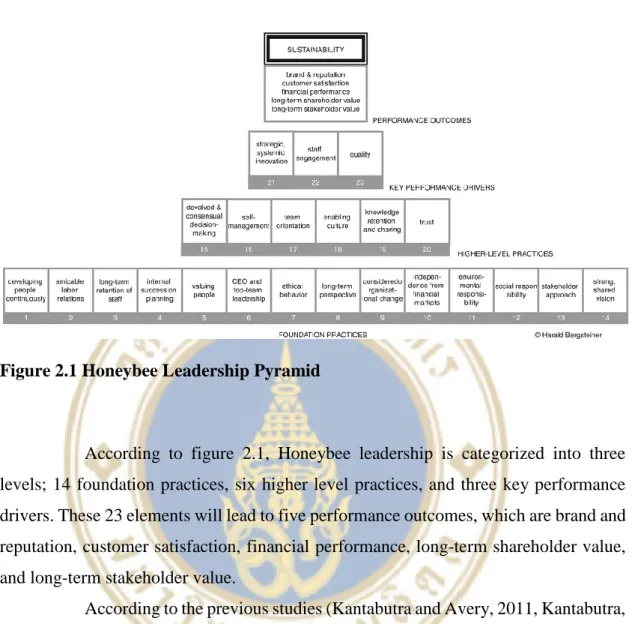
Figure 2.1 Honeybee Leadership Pyramid
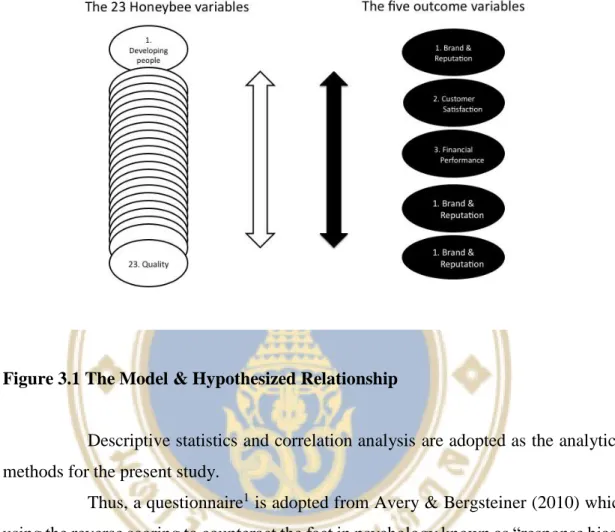
According to figure 2.1, Honeybee leadership is categorized into three levels; 14 foundation practices, six higher level practices, and three key performance drivers. These 23 elements will lead to five performance outcomes, which are brand and reputation, customer satisfaction, financial performance, long-term shareholder value, and long-term stakeholder value.
According to the previous studies (Kantabutra and Avery, 2011, Kantabutra, 2012, Kantabutra and Suriyankietkaew, 2013, Kantabutra and Thepa-Apiraks, 2014, Kantabutra, 2014, Kantabutra, 2011) of sustainable leadership by adopting Rhineland framework, there are six empirical evidences in Thailand. The large company cases are True Corp, Siam Cement Group and Thai President Foods. The three SME cases are Theptarin Hospital, Bathroom design and Sa paper Preservation House. The results of all six companies have the mutual significant findings, which are long-term perspective, quality, retaining staff, social responsibility and stakeholders. This means Thai company act accordingly with Sustainable Leadership.
Since Sustainable Leadership has gained support in Thailand as an approach to ensure corporate sustainability and few quantitative researches has been conducted into businesses in apparel industry, the present study adopts the Honeybee Leadership
as a framework to examine the relationship between business practices of businesses in the proposed industry and their corporate sustainability performance outcomes.
Methodology used for the present study is discussed in the next chapter.
CHAPTER III
RESEARCH METHODOLOGY
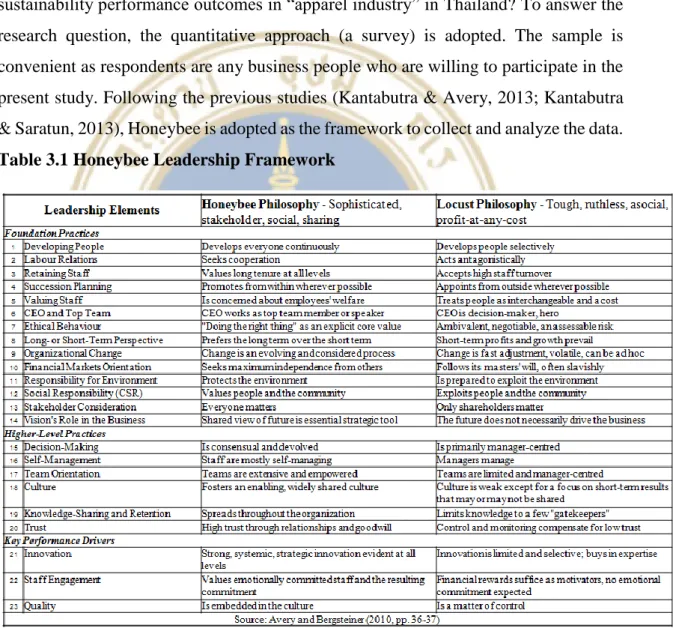
Are Honeybee leadership practices correlated with better corporate sustainability performance outcomes in “apparel industry” in Thailand? To answer the research question, the quantitative approach (a survey) is adopted. The sample is convenient as respondents are any business people who are willing to participate in the present study. Following the previous studies (Kantabutra & Avery, 2013; Kantabutra
& Saratun, 2013), Honeybee is adopted as the framework to collect and analyze the data.
Table 3.1 Honeybee Leadership Framework
Furthermore, Honeybee leadership practices drive five sustainability performance outcomes, which are following;
Brand and reputation
Customer satisfaction
Financial performance
Long-term shareholder value
Long-term stakeholder value
According to Honeybee leadership practices and sustainability performance outcomes, hypotheses for the present study are shaped.
H 1: The more people are developed in the organization, the better the sustainability performance outcomes:
H1.1 Brand and reputation
H1.2 Customer satisfaction
H1.3 Financial performance
H1.4 Long-term shareholder value
H1.5 Long-term stakeholder value
H 2: The more cooperative the relationship between labor and top management team, the better the sustainability performance outcomes:
H2.1 Brand and reputation
H2.2 Customer satisfaction
H2.3 Financial performance
H2.4 Long-term shareholder value
H2.5 Long-term stakeholder value
H 3: The longer the average tenure of employees at all level, the better the sustainability performance outcomes:
H3.1 Brand and reputation
H3.2 Customer satisfaction
H3.3 Financial performance
H3.4 Long-term shareholder value
H3.5 Long-term stakeholder value
H 4: The more people are promoted from within, the better the sustainability performance outcomes:
H4.1 Brand and reputation
H4.2 Customer satisfaction
H4.3 Financial performance
H4.4 Long-term shareholder value
H4.5 Long-term stakeholder value
H 5: The more company concerns about employees’ welfare, the better the sustainability performance outcomes:
H5.1 Brand and reputation
H5.2 Customer satisfaction
H5.3 Financial performance
H5.4 Long-term shareholder value
H5.5 Long-term stakeholder value
H 6: The more CEO works as a top team member, the better the sustainability performance outcomes:
H6.1 Brand and reputation
H6.2 Customer satisfaction
H6.3 Financial performance
H6.4 Long-term shareholder value
H6.5 Long-term stakeholder value
H 7: The more people behave ethically in the organization, the better the sustainability performance outcomes:
H7.1 Brand and reputation
H7.2 Customer satisfaction
H7.3 Financial performance
H7.4 Long-term shareholder value
H7.5 Long-term stakeholder value
H 8: The more the company prefers the long-term perspective, the better the sustainability performance outcomes:
H8.1 Brand and reputation
H8.2 Customer satisfaction
H8.3 Financial performance
H8.4 Long-term shareholder value
H8.5 Long-term stakeholder value
H 9: The more the chang is considered and managed in the organization, the better the sustainability performance outcomes:
H9.1 Brand and reputation
H9.2 Customer satisfaction
H9.3 Financial performance
H9.4 Long-term shareholder value
H9.5 Long-term stakeholder value
H 10: The more independent the company is from the stock markets, the better the sustainability performance outcomes:
H10.1 Brand and reputation
H10.2 Customer satisfaction
H10.3 Financial performance
H10.4 Long-term shareholder value
H10.5 Long-term stakeholder value
H 11: The more company protects the environment, the better the sustainability performance outcomes:
H11.1 Brand and reputation
H11.2 Customer satisfaction
H11.3 Financial performance
H11.4 Long-term shareholder value
H11.5 Long-term stakeholder value
H 12: The more the company values people and the community, the better the sustainability performance outcomes:
H12.1 Brand and reputation
H12.2 Customer satisfaction
H12.3 Financial performance
H12.4 Long-term shareholder value
H12.5 Long-term stakeholder value
H 13: The more the company is responsible for a wide range of stakeholder, the better the sustainability performance outcomes:
H13.1 Brand and reputation
H13.2 Customer satisfaction
H13.3 Financial performance
H13.4 Long-term shareholder value
H13.5 Long-term stakeholder value
H 14: The more people in the organizations share the corporate vision, the better the sustainability performance outcomes:
H14.1 Brand and reputation
H14.2 Customer satisfaction
H14.3 Financial performance
H14.4 Long-term shareholder value
H14.5 Long-term stakeholder value
H 15: The more consensual decision-making within the organization, the better the sustainability performance outcomes:
H15.1 Brand and reputation
H15.2 Customer satisfaction
H15.3 Financial performance
H15.4 Long-term shareholder value
H15.5 Long-term stakeholder value
H 16: The more self-managing staff in the organization, the better the sustainability performance outcomes:
H16.1 Brand and reputation
H16.2 Customer satisfaction
H16.3 Financial performance
H16.4 Long-term shareholder value
H16.5 Long-term stakeholder value
H 17: The more extensive and empower team are in the organizations, the better the sustainability performance outcomes:
H17.1 Brand and reputation
H17.2 Customer satisfaction
H17.3 Financial performance
H17.4 Long-term shareholder value
H17.5 Long-term stakeholder value
H 18: The more the culture is fostered and shared within the organizations, the better the sustainability performance outcomes:
H18.1 Brand and reputation
H18.2 Customer satisfaction
H18.3 Financial performance
H18.4 Long-term shareholder value
H18.5 Long-term stakeholder value
H 19: The more knowledge is shared and retained within the organizations, the better the sustainability performance outcomes:
H19.1 Brand and reputation
H19.2 Customer satisfaction
H19.3 Financial performance
H19.4 Long-term shareholder value
H19.5 Long-term stakeholder value
H 20: The more trust worthy relationship among employees within the organizations, the better the sustainability performance outcomes:
H20.1 Brand and reputation
H20.2 Customer satisfaction
H20.3 Financial performance
H20.4 Long-term shareholder value
H20.5 Long-term stakeholder value
H 21: The more evident strong, systematic, strategic innovation within the organizations, the better the sustainability performance outcomes:
H21.1 Brand and reputation
H21.2 Customer satisfaction
H21.3 Financial performance
H21.4 Long-term shareholder value
H21.5 Long-term stakeholder value
H 22: The more the company value emotionally committed staff and their commitments, the better the sustainability performance outcomes:
H22.1 Brand and reputation
H22.2 Customer satisfaction
H22.3 Financial performance
H22.4 Long-term shareholder value
H22.5 Long-term stakeholder value
H 23: The more quality is embedded in the culture, the better the sustainability performance outcomes:
H23.1 Brand and reputation
H23.2 Customer satisfaction
H23.3 Financial performance
H23.4 Long-term shareholder value
H23.5 Long-term stakeholder value
From the hypotheses, the model of hypothesized correlation between Honeybee Leadership
Figure 3.1 The Model & Hypothesized Relationship
Descriptive statistics and correlation analysis are adopted as the analytical methods for the present study.
Thus, a questionnaire1 is adopted from Avery & Bergsteiner (2010) which using the reverse scoring to counteract the fact in psychology known as “response bias”.
The questionnaire has been translated back and forth between English and Thai to ensure the legitimacy.
The hypothesis will be tested in “Apparel Industry” because fashions change rapidly so it’s difficult for organizations to maintain their businesses. Many fashion firms fail since new brands occur every day and there is a high competition in the market. This research paper will help business leaders to improve their firms.
1 The SLQ instrument is not for use or publication without prior permission in writing from Honorary Professor Harald Bergsteiner at the Institute for Sustainable Leadership in Australia, and acknowledged its source.
CHAPTER IV FINDINGS
The data has been collected from 50 companies in apparel industry. The data involves the descriptive statistics, which is a demographic information and correlation analysis. The correlation shows how the firms act accordingly to sustainable leadership.
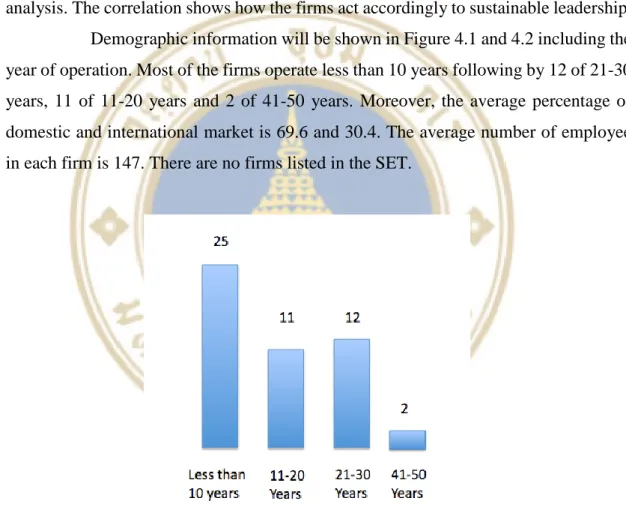
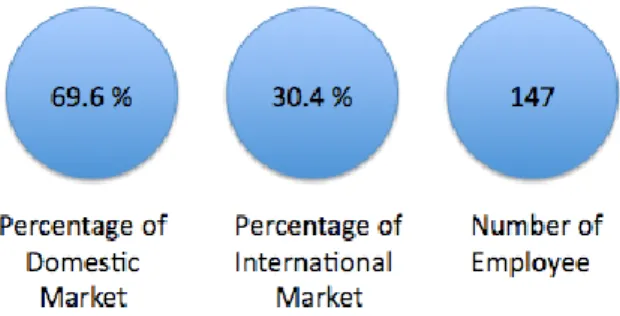
Demographic information will be shown in Figure 4.1 and 4.2 including the year of operation. Most of the firms operate less than 10 years following by 12 of 21-30 years, 11 of 11-20 years and 2 of 41-50 years. Moreover, the average percentage of domestic and international market is 69.6 and 30.4. The average number of employee in each firm is 147. There are no firms listed in the SET.
Figure 4.1 The number of year operation
Figure 4.2 The average percentage of domestic and international market and number of employee
Also, this chapter shows the correlation analysis of each 23 hypotheses with five performance outcomes. The result will be shown in table 4.1 – 4.23.
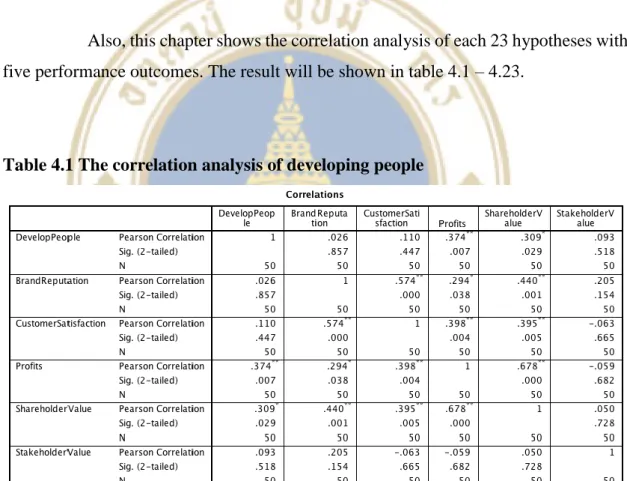
Table 4.1 The correlation analysis of developing people
H1: The more people are developed in the organization, the better the sustainability performance outcomes:
H1.1 Brand and reputation
H1.2 Customer satisfaction
H1.3 Financial performance
H1.4 Long-term shareholder value
H1.5 Long-term stakeholder value
The correlation analysis result indicates that there are two significant relationships between developed people and financial performance, shareholder value.
Therefore, H1.3 - 1.4 are accepted. The rest are rejected.
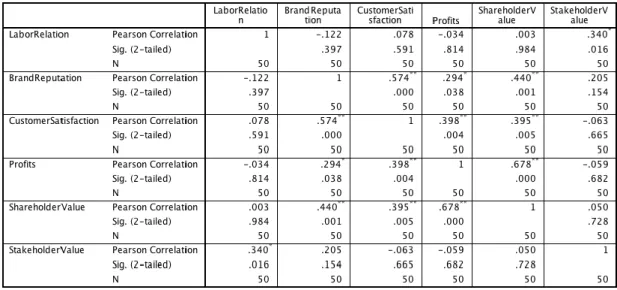
Table 4.2 The correlation analysis of labor relations
H 2: The more cooperative the relationship between labor and top management team, the better the sustainability performance outcomes:
H2.1 Brand and reputation
H2.2 Customer satisfaction
H2.3 Financial performance
H2.4 Long-term shareholder value
H2.5 Long-term stakeholder value
The correlation analysis result indicates that there is one significant relationship between labor relationship and stakeholder value. Therefore, H2.5 is accepted. The rest hypotheses are rejected.
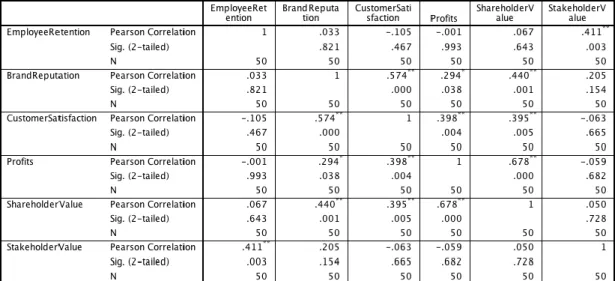
Table 4.3 The correlation analysis of employee retention
H 3: The longer the average tenure of employees at all level, the better the sustainability performance outcomes:
H3.1 Brand and reputation
H3.2 Customer satisfaction
H3.3 Financial performance
H3.4 Long-term shareholder value
H3.5 Long-term stakeholder value
The correlation analysis result indicates that there is one significant relationship between employee retention and stakeholder value. Therefore, H3.5 is accepted. The rest hypotheses are rejected.
Table 4.4 The correlation analysis of succesion planning
H 4: The more people are promoted from within, the better the sustainability performance outcomes:
H4.1 Brand and reputation
H4.2 Customer satisfaction
H4.3 Financial performance
H4.4 Long-term shareholder value
H4.5 Long-term stakeholder value
The correlation analysis result indicates that there is one significant relationship between succession plan and financial performance. Therefore, H4.4 is accepted. The rest hypotheses are rejected.
Table 4.5 The correlation analysis of value people
H 5: The more company concerns about employees’ welfare, the better the sustainability performance outcomes:
H5.1 Brand and reputation
H5.2 Customer satisfaction
H5.3 Financial performance
H5.4 Long-term shareholder value
H5.5 Long-term stakeholder value
The correlation analysis result indicates that there is one significant relationship between value people and shareholder value. Therefore, H5.4 is accepted.
The rest hypotheses are rejected.
Table 4.6 The correlation analysis of CEO top team
H 6: The more CEO works as a top team member, the better the sustainability performance outcomes:
H6.1 Brand and reputation
H6.2 Customer satisfaction
H6.3 Financial performance
H6.4 Long-term shareholder value
H6.5 Long-term stakeholder value
The correlation analysis result indicates that there is one significant relationship between CEO top team and stakeholder value. Therefore, H6.5 is accepted.
The rest hypotheses are rejected.
Table 4.7 The correlation analysis of ethics
H 7: The more people behave ethically in the organization, the better the sustainability performance outcomes:
H7.1 Brand and reputation
H7.2 Customer satisfaction
H7.3 Financial performance
H7.4 Long-term shareholder value
H7.5 Long-term stakeholder value
The correlation analysis result indicates that there is one significant relationship between ethics and stakeholder value. Therefore, H7.5 is accepted. The rest hypotheses are rejected.
Table 4.8 The correlation analysis of long term
H 8: The more the company prefers the long-term perspective, the better the sustainability performance outcomes:
H8.1 Brand and reputation
H8.2 Customer satisfaction
H8.3 Financial performance
H8.4 Long-term shareholder value
H8.5 Long-term stakeholder value
The correlation analysis result indicates that there is no significant relationship. Therefore, H8.1 – H8.5 are rejected.
Table 4.9 The correlation analysis of organizational change
H 9: The more the change is considered and managed in the organization, the better the sustainability performance outcomes:
H9.1 Brand and reputation
H9.2 Customer satisfaction
H9.3 Financial performance
H9.4 Long-term shareholder value
H9.5 Long-term stakeholder value
The correlation analysis result indicates that there is no significant relationship. Therefore, H9.1 – H9.5 are rejected.
Table 4.10 The correlation analysis of financial markets
H 10: The more independent the company is from the stock markets, the better the sustainability performance outcomes:
H10.1 Brand and reputation
H10.2 Customer satisfaction
H10.3 Financial performance
H10.4 Long-term shareholder value
H10.5 Long-term stakeholder value
The correlation analysis result indicates that there is one significant relationship between financial markets and stakeholder value. Therefore, H10.5 is accepted. The rest hypotheses are rejected.
Table 4.11 The correlation analysis of responsibility environment
H 11: The more company protects the environment, the better the sustainability performance outcomes:
H11.1 Brand and reputation
H11.2 Customer satisfaction
H11.3 Financial performance
H11.4 Long-term shareholder value
H11.5 Long-term stakeholder value
The correlation analysis result indicates that there is one significant relationship between responsibility environment and stakeholder value. Therefore, H11.5 is accepted. The rest hypotheses are rejected.
Table 4.12 The correlation analysis of responsibility responsibility
H 12: The more the company values people and the community, the better the sustainability performance outcomes:
H12.1 Brand and reputation
H12.2 Customer satisfaction
H12.3 Financial performance
H12.4 Long-term shareholder value
H12.5 Long-term stakeholder value
The correlation analysis result indicates that there is no significant relationship. Therefore, H12.1 – H12.5 are rejected.
Table 4.13 The correlation analysis of stakeholders
H 13: The more the company is responsible for a wide range of stakeholder, the better the sustainability performance outcomes:
H13.1 Brand and reputation
H13.2 Customer satisfaction
H13.3 Financial performance
H13.4 Long-term shareholder value
H13.5 Long-term stakeholder value
The correlation analysis result indicates that there is one significant relationship between stakeholders and stakeholder value. Therefore, H13.5 is accepted.
The rest hypotheses are rejected.
Table 4.14 The correlation analysis of vision
H 14: The more people in the organizations share the corporate vision, the better the sustainability performance outcomes:
H14.1 Brand and reputation
H14.2 Customer satisfaction
H14.3 Financial performance
H14.4 Long-term shareholder value
H14.5 Long-term stakeholder value
The correlation analysis result indicates that there is one significant relationship between vision and stakeholder value. Therefore, H14.5 is accepted. The rest hypotheses are rejected.
Table 4.15 The correlation analysis of decision making
H 15: The more consensual decision-making within the organization, the better the sustainability performance outcomes:
H15.1 Brand and reputation
H15.2 Customer satisfaction
H15.3 Financial performance
H15.4 Long-term shareholder value
H15.5 Long-term stakeholder value
The correlation analysis result indicates that there is no significant relationship. Therefore, H15.1 – H15.5 are rejected.
Table 4.16 The correlation analysis of self managing
H 16: The more self-managing staff in the organization, the better the sustainability performance outcomes:
H16.1 Brand and reputation
H16.2 Customer satisfaction
H16.3 Financial performance
H16.4 Long-term shareholder value
H16.5 Long-term stakeholder value
The correlation analysis result indicates that there is no significant relationship. Therefore, H16.1 – H16.5 are rejected.
Table 4.17 The correlation analysis of team orientation
H 17: The more extensive and empower team are in the organizations, the better the sustainability performance outcomes:
H17.1 Brand and reputation
H17.2 Customer satisfaction
H17.3 Financial performance
H17.4 Long-term shareholder value
H17.5 Long-term stakeholder value
The correlation analysis result indicates that there is one significant relationship between team orientation and stakeholder value. Therefore, H17.5 is accepted. The rest hypotheses are rejected.
Table 4.18 The correlation analysis of culture
H 18: The more the culture is fostered and shared within the organizations, the better the sustainability performance outcomes:
H18.1 Brand and reputation
H18.2 Customer satisfaction
H18.3 Financial performance
H18.4 Long-term shareholder value
H18.5 Long-term stakeholder value
The correlation analysis result indicates that there is one significant relationship between culture and stakeholder value. Therefore, H18.5 is accepted. The rest hypotheses are rejected.
Table 4.19 The correlation analysis of knowledge sharing
H 19: The more knowledge is shared and retained within the organizations, the better the sustainability performance outcomes:
H19.1 Brand and reputation
H19.2 Customer satisfaction
H19.3 Financial performance
H19.4 Long-term shareholder value
H19.5 Long-term stakeholder value
The correlation analysis result indicates that there is one significant relationship between knowledge sharing and stakeholder value. Therefore, H19.5 is accepted. The rest hypotheses are rejected.
Table 4.20 The correlation analysis of trust
H 20: The more trust worthy relationship among employees within the organizations, the better the sustainability performance outcomes:
H20.1 Brand and reputation
H20.2 Customer satisfaction
H20.3 Financial performance
H20.4 Long-term shareholder value
H20.5 Long-term stakeholder value
The correlation analysis result indicates that there is one significant relationship between trust and stakeholder value. Therefore, H20.5 is accepted. The rest hypotheses are rejected.
Table 4.21 The correlation analysis of innovation
H 21: The more evident strong, systematic, strategic innovation within the organizations, the better the sustainability performance outcomes:
H21.1 Brand and reputation
H21.2 Customer satisfaction
H21.3 Financial performance
H21.4 Long-term shareholder value
H21.5 Long-term stakeholder value
The correlation analysis result indicates that there is one significant relationship between innovation and stakeholder value. Therefore, H21.5 is accepted.
The rest hypotheses are rejected.
Table 4.22 The correlation analysis of engaged employees
H 22: The more the company value emotionally committed staff and their commitments, the better the sustainability performance outcomes:
H22.1 Brand and reputation
H22.2 Customer satisfaction
H22.3 Financial performance
H22.4 Long-term shareholder value
H22.5 Long-term stakeholder value
The correlation analysis result indicates that there is one significant relationship between engage employees and brand reputation, stakeholder value.
Therefore, H22.1 and 22.5 are accepted. The rest hypotheses are rejected.
Table 4.23 The correlation analysis of quality
H 23: The more quality is embedded in the culture, the better the sustainability performance outcomes:
H23.1 Brand and reputation
H23.2 Customer satisfaction
H23.3 Financial performance
H23.4 Long-term shareholder value
H23.5 Long-term stakeholder value
The correlation analysis result indicates that there is one significant relationship between quality and stakeholder value. Therefore, H23.5 is accepted. The rest hypotheses are rejected.
CHAPTER V DISCUSSION
This chapter discusses about the significant and insignificant findings from the previous chapter. The significant shows the correlation between the corporate sustainability and the five performance outcomes.
5.1 Significant findings
There are total 18 significant findings, which are develop people, labor relations, employee retention, succession planning, value, CEO top team, ethics, financial markets, responsibility environment, stakeholders, vision, team orientation, culture, knowledge sharing, trust, innovation, engaged employees and quality. First, develop people is the key foundation practices because people are important in apparel industry. To develop people, the company should invest a lot in training people and it will reflect in customer satisfaction.
However, there are total 5 insignificant findings, which are long term perspective, organizational change, social responsibility, decision making and self managing. In apparel industry
5.2 Managerial implications
To improve from the findings, I suggest to focus on 4 practices, which are develop people, employee retention, value people and engaged employees. In apparel industry, employees are extremely important, as they are the cores of the organizations.
To develop people, the company should invest a lot in training. There is required training session for skills and knowledge by the managers or the experienced seniors. Also, there is a selective training for personal interest because develop person is important as well not just skills and knowledge. To keep employees, the company should provide career
development by using annual performance appraisals to set up a development plan. For instance, employees are asked to list the business goal and life goal then the manager will review it. If employees can achieve the goal at the end of the year, they will get promoted or some rewards. To value people, the company should provide intrinsic and extrinsic value. For example, when employees can accomplish the tasks, the manager should give him/her some compliments or bonuses at the end of the year. To engage employees, the company should provide an outing trip so the employees can get to know each other and work well together. Moreover, if the employees reach target sales, the company may take their employees to abroad.
CHAPTER VI CONCLUSIONS
In Conclusion, the study examines sustainable leadership in apparel industry by using Honeybee Leadership which consists of 14 foundation practices, 6 higher level practices and 3 key driver performances to test the hypotheses. After that, develop 23 hypotheses to see if it’s correlate with the 5 outcomes, which are brand and reputation, customer satisfaction, financial performance, long-term shareholder value, and long- term stakeholder value. Next, I collect the data by using quantitative research, which adopted from Avery & Bergsteiner (2010). I conduct the research by gathering 50 samples from 50 companies. After data collection, I complete the data analysis by correlation analysis. It is used to analyze between apparel industry sustainability performance and 5 sustainability outcomes. After that, I discover the total 18 significant findings, which are develop people, labor relations, employee retention, succession planning, value, CEO top team, ethics, financial markets, responsibility environment, stakeholders, vision, team orientation, culture, knowledge sharing, trust, innovation, engaged employees and quality. Last, I develop recommendation for the organizations in apparel industry in order to maintain their businesses.
REFERENCES
Albert, M. (1992). The Rhine Model of Capitalism: An Investigation. European Business Journal, 4(3), 8-22.
Albert, M. (1993). Capitalism vs. Capitalism: How America’s Obsession With Individual Achievement and Short-Term Profit Has Led it to the Brink of Collapse. Four Walls Eight Windows.
Avery, G. C. (2005). Leadership for Sustainable Futures: Achieving Success in a Competitive World. Edward Elger.
Avery, G. C., & Bergsteiner, H. (2010). Honeybees & Locusts: The Business Case for Sustainable Leadership. Allen & Unwin.
Kantabutra, S., & Avery, G. C. (2011). Sustainable Leadership at Siam Cement Group. Journal of Business Strategy, 32(4), 32-41.
Kantabutra, S., & Avery, G. C. (2013). Sustainable Leadership: Honeybee Practices at a Leading Asian Industrial Conglomerate. Asia-Pacific Journal of Business Administration, 5(1), 36-56.
Kantabutra, S., & Saratun, M. (2013). Sustainable Leadership: Honeybee Practices at Thailand’s Oldest University. International Journal of Educational Management, 27(4), 356- 376.
Kantabutra, S., & Suriyankietkaew, S. (2013). Sustainable Leadership: Rhineland Practices at a Thai Small Enterprise. International Journal of Entrepreneurship and Small Business, 19(1), 77-94.
Kantabutra, S., & Thepa-Apiraks, T. (2014). Sustainable Leadership and Consequences at Thailand’s Kasikornbank. International Journal of Business Innovation and Research, Forthcoming.