The purpose of this research is to identify target customer and analyze insight of cleaning integrated service which is the new service "Maid Delivery". Cleaning service cleans the house hygienically, so this is one of the services they are interested in. For the customer side, it can be implied from the information above that the demand for cleaning service is increasing.
Example of integrated cleaning service providers are Premiere Health clean company, Vcleaner company, etc. This paper aims to identify and analyze the target customer of the integrated cleaning service in Bangkok in order to improve the integrated cleaning service and its business management according to the demand of the target customer. Although there is a lot of research about the cleaning business, but there is none that focuses on the integrated cleaning service.
In one survey, house cleaning and service bundling is defined as a business that offers in-house cleaning services and additional services to add value to the consumer (Kamtorn, L., 2015). From all the above definitions, it can be concluded that one of the definitions of full-service cleaning services is a company that provides cleaning services for furniture and objects that require a special cleaning method.
Willingness to pay
Perceived Value
In this article, purchase intention is defined as the likelihood that an individual will purchase a service in exchange for the expected benefit he/she will receive from that service. The recipient of the service wants his/her home to be hygienically clean, which would also contribute to his/her health status. The recipient of the service wants to save his/her time, so he/she hires others to do the work for them.
Perceived risk
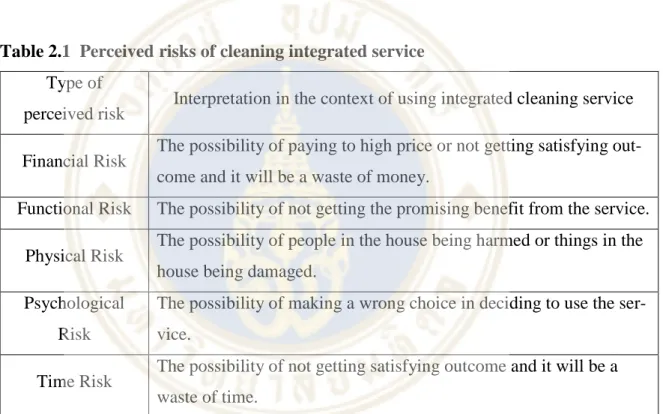
Another researcher explains perceived risk as an important negative factor affecting consumer purchase intention (Min, Z., Mingxing, Z., Xiaotong, L., & Jun, Y., 2017). In previous study, perceived risk is also explained as an uncertainty about possible negative result of using product or service (Kavita, S., & Narendra, K. S., 2011). Some categorize perceived risk into 5 types which are functional risk, financial risk, physical risk, psychological risk and social risk.
In this study, perceived risk is a possible negative outcome that influences the decision to use cleaning integrated service. Five types of perceived risk will be adopted to find the reason why customers may not decide to use the service and how to persuade them. Physical risk The possibility of people in the home being injured or things in the home being damaged.
Time Risk The possibility of not getting a satisfactory result and it will be a waste of time.
RESEARCH METHODOLOGY
- Research Design
- Sample and Data Collection
- Instrument
- Data Analysis
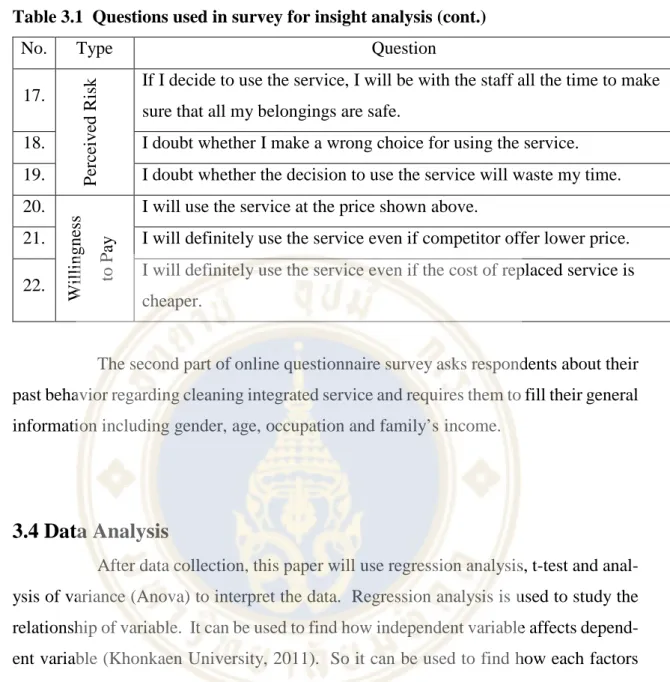
Perceived risk If I decide to use the service, I will be with the staff at all times to ensure that all my belongings are safe. After data collection, this paper will use regression analysis, t-test and analysis of variance (Anova) to interpret the data. It can be used to find out how independent variable affects dependent variable (Khonkaen University, 2011).
So it can be used to find out how each factor affects the customer's purchase intention. For t-test it is used to find the difference or compare means of 2 groups which have normal distribution. Similar to t-test, analysis of variance is used to compare means of 3 or more groups.
RESEARCH FINDINGS
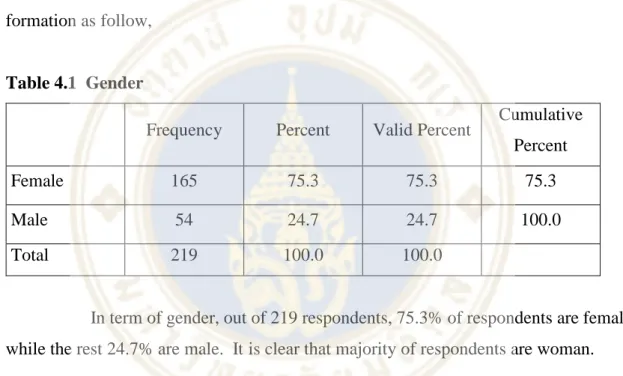
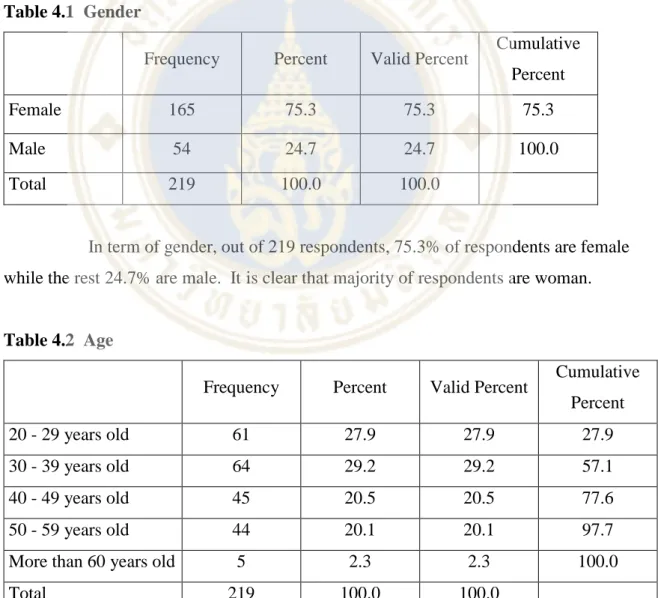
Demographic Results
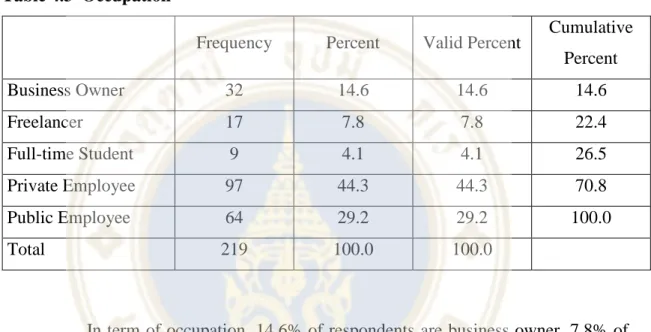
This paper divides people into 5 groups, the twenties, the thirties, the forties, the fifties and people who are over 60 years old. On the other hand, the smallest group of respondents are people whose age is more than 60 years old. In terms of occupation, 14.6% of the respondents are business owners, 7.8% of the respondents are freelancers and 29.2% of the respondents are public employees.
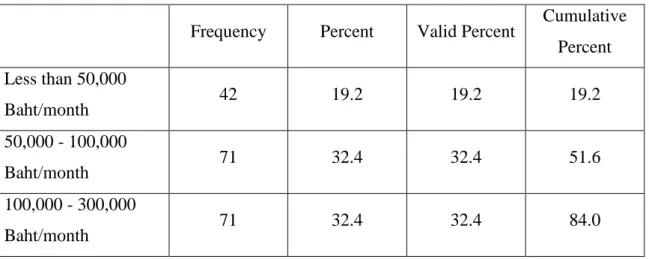
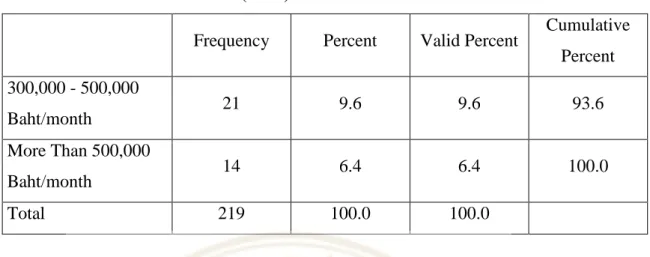
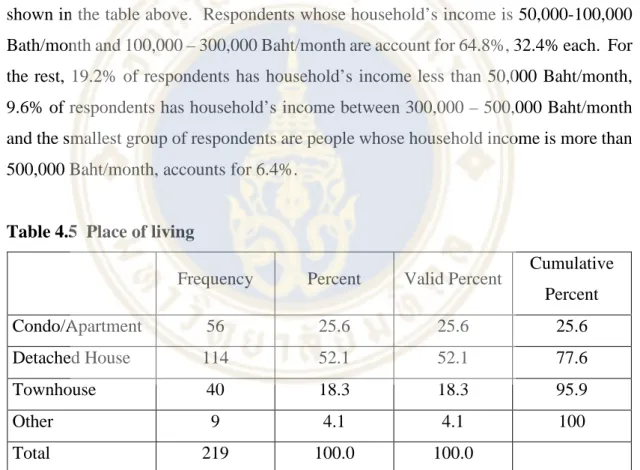
In terms of household income, this paper divides people into 5 groups as shown in the table above. In terms of residence, this document categorizes residence into 4 types: condo/apartment, detached house, townhouse, and others. The majority of respondents live in a detached house, followed by a flat/apartment and a townhouse.
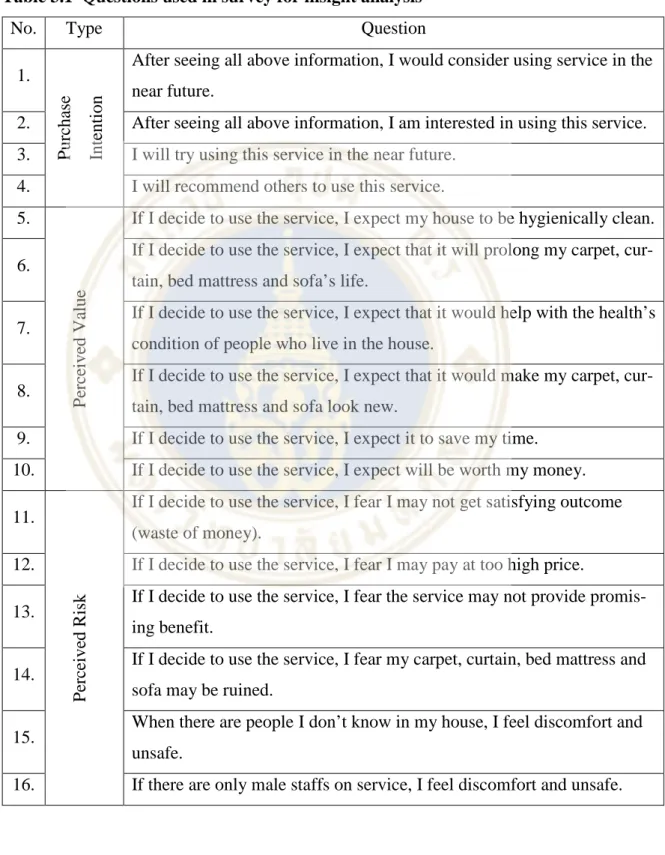
To collect data for knowledge analysis, respondents are asked to state their level of agreement for each statement (Likert scale question) which has a choice from 1 (strongly disagree) to 5 (strongly agree). The table below shows the minimum, maximum, standard deviation and mean of the respondents for each statement.
Main Findings
- Perceived Value
- Perceived Risk
- Willingness to pay
- Regression Analysis
- T-Test
- Analysis of Variance (Anova)
Perceived value has a little more impact than willingness to pay, implying that customers may still use the service even if they think it is too expensive if the benefit they think they will get matches their demand. In this part, T-test and Anova will be used to find the difference in agreement level of each statements of each respondent's group. The reason is for the statement "If I decide to use the service, I expect my house to be hygienically clean", mean male agreement level is 3.815 while mean female agreement level is 4.279.
The reason is for the statement "If I decide to use the service, I expect that it will help with the health condition of people living in the house", average male agreement level is 3.944 while average female agreement level is 4.345. The reason is for the statement "If I decide to use the service, I expect it will make my carpet, curtain, bed mattress and sofa look new", mean male agreement level is 3.926 while mean female agreement level is 4.206. The reason is for the statement "If I decide to use the service, I expect it to be worth my money", mean male agreement level is 3.574 while mean female agreement level is 4.024.
The reason is for the statement "If I decide to use the service, I may not have a satisfactory result (waste of money)", the average level of agreement of men is 3.074 while the average level of agreement of women is 3.436. The reason is for the statement “If I decide to use the service, I'm afraid I might pay a high price”, the mean level of agreement of men is 3.648 while the mean level of agreement of women is 4.042. When there are people I don't know in my house, I feel uncomfortable and insecure”, the average level of agreement of men is 3.074 while the average level of agreement of women is 3.436.
The reason for this is the statement “When only male staff are employed, I feel uncomfortable and unsafe”, the average of the male agreement level is 3.093, while the average of the female agreement level is 3.673. The reason for this is the statement “If I decide to use the service, I am afraid that my carpet, curtain, bed mattress and sofa will be damaged”, the average of people aged 50 – 59 years old is 3.114, while the average of people aged 50 – 59 years old. is older than 60 years is 1.8. The reason for this is the statement “I doubt whether I am making a wrong choice when using the service”, the average of people aged 50 – 59 years old is 3.045, while the average of people aged over 60 years is 1.8 .
People in their twenties have a higher willingness to pay than people whose age is more than 60 years. Similarly, people in their thirties have a higher willingness to pay than people whose age is more than 60 years. And people in their fifties have a higher willingness to pay than people whose age is more than 60 years.
CONCLUSIONS
- Conclusion
- Limitations and suggestions for future research
The reliability of the service in terms of safety: insurance on customer property, female staff for female customers, etc. The reliability of the service in terms of service: receive service and its promising benefit in exchange for the money paid. In terms of willingness to pay, for the current price it can be concluded that the price is still slightly too high, as the averages of the statement regarding willingness to pay are on average 2.5.
This means that the set price is higher than the maximum price the customer is willing to pay in exchange for the promised benefits. Thus, if only willingness to pay is taken into account, the service provider should reconsider the pricing. But in reality, willingness to pay is only one of the factors that influence a customer's purchase intent.
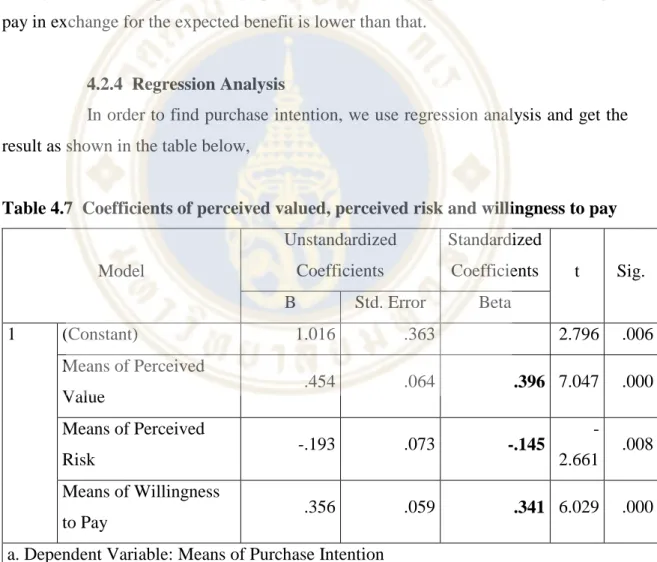
Regarding purchase intention, the result of the analysis shows that it is influenced by the customer's perceived value, perceived risk and willingness to pay. Both perceived value and willingness to pay have a positive effect on purchase intention, while perceived risk has a negative effect. Despite positive influence, from the regression analysis, the perceived value affects the purchase intention more than the willingness to pay.
If a service provider is able to offer benefits that match the customer's needs and wants and emphasizes that benefit, the price may not need to be adjusted. However, if service provider lowers the price a little, the result is an increase in the number of customers. This paper cannot find the characteristic of people who have significant high purchase intention in terms of gender, age, occupation and household income.
Even though we received the response from the survey as planned, the greater the number of respondents, the greater the reliability of the result.
Min Zhang, Mingxing Zhu, Xiaotong Liu, Jun Yang Why Should I Pay for eBooks?: An Empirical Study to Investigate Chinese Readers' Purchasing Behavior in the Mobile Era", The Electronic Library, Vol. Nguyen-Hau Le, Hai -Minh Thi Nguyen, Tuan Van Nguyen National identity and the perceived values of foreign products with local brands: The case of local wine in Vietnam”, Asia Pacific Journal of Marketing and Logistics, Vol. Ramulu Bhukya, Sapna Singh The Effect of Perceived Risk Dimensions on Purchase Intention: An Empirical Evidence from the Indian Private Label Market”, American Journal of Business, Vol.
Yacan Wang, Vincent Wiegerinck, Harold Krikke, Hongdan Zhang Understanding Purchase Intention for Refurbished Products in Closed Supply Chains: An Empirical Study in China", International Journal of.