PIEZOELECTRICS
An organic-inorganic perovskite ferroelectric with large
piezoelectric response
Yu-Meng You,1*†Wei-Qiang Liao,1†Dewei Zhao,2†Heng-Yun Ye,1Yi Zhang,1 Qionghua Zhou,3Xianghong Niu,3Jinlan Wang,3Peng-Fei Li,1Da-Wei Fu,1 Zheming Wang,4Song Gao,4Kunlun Yang,5Jun-Ming Liu,5Jiangyu Li,6,7* Yanfa Yan,2*Ren-Gen Xiong1*
Molecular piezoelectrics are highly desirable for their easy and environment-friendly processing, light weight, low processing temperature, and mechanical flexibility.
However, although 136 years have passed since the discovery in 1880 of the piezoelectric effect, molecular piezoelectrics with a piezoelectric coefficientd33comparable with piezoceramics such as barium titanate (BTO; ~190 picocoulombs per newton) have not been found. We show that trimethylchloromethyl ammonium trichloromanganese(II), an organic-inorganic perovskite ferroelectric crystal processed from aqueous solution, has a larged33of 185 picocoulombs per newton and a high phase-transition temperature of 406 kelvin (K) (16 K above that of BTO). This makes it a competitive candidate for medical, micromechanical, and biomechanical applications.
P
iezoelectricity arises in crystalline materials without inversion symmetry, allowing inter- conversion between electric voltage and mechanical stress. This property makes piezoelectrics essential for high-voltage sources, sensors, actuators, frequency standard, motors, vibration reducer, and other applications.Pierre Curie and Jacques Curie were brothers who discovered piezoelectricity in 1880 (1). The Curies used tourmaline, quartz, topaz, cane sugar, and Rochelle salt to demonstrate the electrome- chanical interactions. Those first few piezoelectric materials have very weak piezoelectric perform- ance, with piezoelectric coefficients of d33<
10 pC/N (2). Among these piezoelectric mate- rials, Rochelle salt is also a ferroelectric material, discovered in 1920 by Valasek (3). Ferroelectrics feature a switchable spontaneous electric polar- ization and usually also have good piezoelectric performance. The most widely used piezoelec- tric materials currently are ferroelectric ceram- ics such as lead zirconate titanate (PZT) and barium titanate (BTO), which have excellent elec-
tromechanical conversion and strong spontane- ous polarization.
Piezoelectric materials should be thin, soft, lightweight, flexible, and also bio-friendly for a wide variety of important applications, such as microrobotics, flexible/wearable devices, and bio- implanted sensors (4–6). These requirements im- pose challenges for conventional piezoelectric ceramics, which require high processing tem-
peratures, have almost no mechanical flexibility, and contain potential toxic elements. Because these problems can potentially be solved with organic materials, organic ferroelectrics have received intensive attention (7–9). Although re- searchers focus on improving the spontaneous polarization (Ps) and the phase-transition tem- perature (Tc) (10–13) of organic ferroelectrics, the piezoresponse of organic materials still do not match that of piezoceramics such as BTO. In our previous work, we reported the largest bulkd33
among molecular ferroelectrics in imidazolium perchlorate (41 pC/N), yet it is only one-fifth of that of single-crystal BTO (d33= 90 and 190 pC/N along [001] and [111] crystal orientation, respec- tively) (14,15). Imidazolium perchlorate has an even smallerd33than that of binary solid solu- tions such as PZT, which are as high as thousands of picocoulombs per newton with proper doping and phase engineering (5). Other organic materials have even weakerd33, with ~20 pC/N for poly- vinylidene fluoride (PVDF), 2 pC/N for nylon, 11 pC/N for diisopropylammonium bromide (DIPAB), and 5 pC/N for croconic acid.
Recent developments show the potential ap- plications of organic-inorganic perovskite materials in electronics (16), light sources (17), photovoltaics (18,19), and even ferroelectrics (20). Because of their distinct structure, hybrid materials combine the benefits of organic molecules and advanta- geous characteristics of crystalline inorganic solids at a molecular level. We report the discovery of a single-phase organic-inorganic perovskite piezo- electric of trimethylchloromethyl ammonium trichloromanganese(II) [Me3NCH2ClMnCl3, (TMCM- MnCl3)] that exhibits a piezoelectric coefficient RESEARCH
Youet al.,Science357, 306–309 (2017) 21 July 2017 1 of 4
1Ordered Matter Science Research Center, Southeast University, Nanjing, Jiangsu 211189, P. R. China.2Department of Physics and Astronomy, University of Toledo, Toledo, OH 43606, USA.3Department of Physics, Southeast University, Nanjing, Jiangsu 211189, P. R. China.4College of Chemistry and Molecular Engineering, Peking University, Beijing 100871, P. R. China.5Laboratory of Solid State Microstructures and Innovation Center of Advanced Microstructures, Nanjing University, Nanjing 210093, P. R. China.6Shenzhen Key Laboratory of Nanobiomechanics, Shenzhen Institutes of Advanced Technology, Chinese Academy of Sciences, Shenzhen, Guangdong 518055, P. R. China.7Department of Mechanical Engineering, University of Washington, Seattle, WA 98195-2600, USA.
*Corresponding author. Email: [email protected] (Y.-Y.M.);
[email protected] (J.L.); [email protected] (Y.Y.);
[email protected] (R.-G.X.)
†These authors contributed equally to this work.
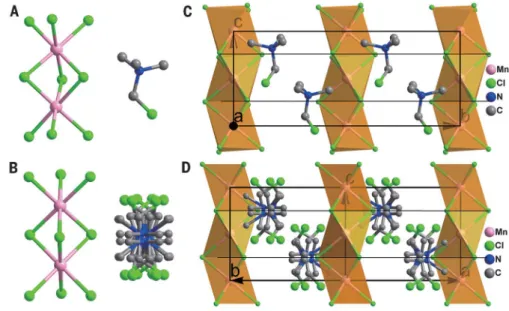
Fig. 1. Thermal variation of crystal structures of TMCM-MnCl3.(A) Structural unit of TMCM- MnCl3in the LTP, showing the coordination geometry of the MnCl6octahedron and cationic structure. (B) Structural unit of TMCM-MnCl3in the HTP, showing the multi-orientation of the cation.
(C) Projection of the low-temperature structure. The dark lines indicate the pseudo–mirror planes normal to thecaxis, which illustrate the relative ionic displacement due to symmetry-breaking.
(D) Projection of the high-temperature structure. The dark lines indicate the mirror planes normal to theaaxis. H atoms were omitted for clarity.
on July 20, 2017 http://science.sciencemag.org/Downloaded from
d33of 185 pC/N. Such a larged33makes TMCM- MnCl3a molecular material with a piezoelectric coefficient comparable with that of piezoelectric ceramics such as BaTiO3. TMCM-MnCl3is also a high-temperature molecular ferroelectric with aTcof 406 K (16 K above that of BTO), making it attractive for practical applications. Unlike inorganic piezoceramics, which require high- temperature synthesis and a high-voltage poling process before applications, TMCM-MnCl3is syn- thesized at room temperature with a preferential macroscopic ferroelectric polarization, making it suitable for growing on low-melting-point flexible substrates and fully compatible with solution- based large-area fabrication techniques. More- over, the toxic-metal–free composition suggests that TMCM-MnCl3may be a great candidate for next-generation micro-electromechanical systems (MEMS), flexible devices, wearable devices, med- ical implants, and nanogenerators.
We prepared large crystals of TMCM-MnCl3 in aqueous solution at room temperature (2) (figs.
S1 and S2). We determined the structure with x-ray diffraction (XRD) at different temperatures (Fig. 1 and table S1). The low-temperature phase (LTP) of TMCM-MnCl3obtained at room tem- perature belongs to the polar space groupCc(2).
The crystal packing adopts the BaNiO3-like pe- rovskite structure, similar to several other molec- ular ferroelectrics (21). The Me3NCH2Cl cation is derived from the spherical tetramethylammonium cation by replacing a H atom with a Cl atom.
Typically, three-dimensional molecules such as tetramethylammonium and damantane tend to exhibit dynamical disorder in close-packed crystals because of weak van der Waals inter- actions. As for TMCM-MnCl3, the Cl atom dis- turbs the spherical symmetry and thus induces the potential energy barrier to its tumbling mo- tion. The high-temperature phase (HTP) is centro- symmetric, with the space groupP63/mmc. The relationship between the two lattice cells isaLTP≈ –aHTP–bHTP,bLTP≈aHTP–bHTP, andcLTP≈cHTP (Fig. 1A). We modeled the molecular tumbling with 12-fold orientational disorder (fig. S2). We found that in the HTP, only the N atom can be located from the difference Fourier map, indicat- ing a strong dynamic characteristic of the mo- lecular tumbling.
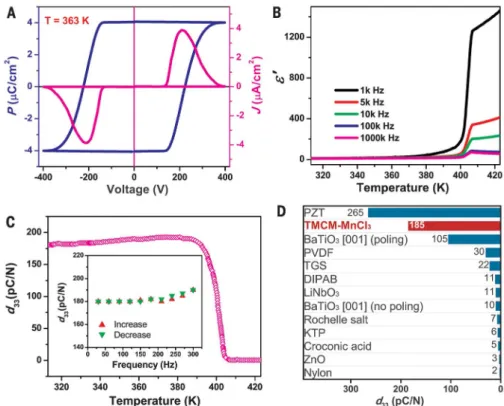
From the crystal structures of HTP and LTP, the phase-transition between these phases is induced by the order-disorder transition of the cations. In the paraelectric HTP, the crystal has a centrosymmetric structure because of the dy- namic disorder of the organic cation. In the ferro- electric LTP, the crystal loses centrosymmetry because of the“freeze”of cations, which leads to the spontaneous polarization. We measured the temperature-dependent second-harmonic gen- eration (SHG) response that supports the breaking of centrosymmetry (fig. S3). According to Aizu, this phase-transition of 6/mmmFm (Aizu notation) is one of the 88 species of ferroelectrics (22). We confirmed the ferroelectricity by observing the typical polarization-electric field (P–E) hysteresis loops using the double-wave method (Fig. 2A) (23) and the Sawyer-Tower method (fig. S4).
We measured the saturate polarization (Ps) of 4.0mC/cm2with both methods, which corre- sponded well with the calculated theoretical results (fig. S5) (2). Such a polarization value is in the intermediate range among reported molecule-based ferroelectrics (9,24). We subjected a crystal of TMCM-MnCl3to polarization switch- ing for up to 107cycles, and it showed fatigue of <10% (fig. S6).
Steplike dielectric anomalies reveal the im- proper ferroelectric character of the transition (Fig. 2B). We obtained a phase-transition tem- perature ofTc= 406 K, which is consistent with the results from several temperature-dependent measurements (fig. S3). In such an improper ferroelectric compound, the Curie-Weiss law is not applicable (25). We also measured the frequency-dependent dielectric permittivity and the imaginary part of the dielectric permittivity (figs. S8 and S9). A simple model described by the Landau-Ginzburg theory can be applied to explain the behavior of dielectric permittivity aroundTc(fig. S7) (2).
Ferroelectrics are naturally piezoelectrics be- cause of the lack of an inversion center, but most organic materials have a very weak piezoelectric response. As one of the elements in the matrix of direct piezoelectric coefficient,d33represents the ability of a material to generate charges on the
plane normal to the applied strain (eqs. S1 and S2) (2). Because inorganic ferroelectrics are nor- mally grown in the high-temperature paraelec- tric phase, they exhibit multidomain structures and require high-voltage poling processing before their application. Unlike inorganic ferroelectrics, crystals of TMCM-MnCl3are grown at room tem- perature and exhibit a nice monodomain structure (fig. S10). To measured33, we used a quasi-static method (also known as the Berlincourt method) on the as-grown single-crystal of TMCM-MnCl3. In the temperature-dependent study, we obtained a maximumd33of 185 pC/N along the proximity of the [102] direction of the crystal in the LTP. For temperatures aboveTc,d33vanishes because of the restoration of centrosymmetry, which corre- sponds very well with the SHG data. We also tested the piezoresponse of TMCM-MnCl3with the frequency of driving force varying from 30 to 300 Hz (Fig. 2C, inset), and this shows very little fluctuation (<10 pC/N). For a direct compar- ison, we measured piezoelectric coefficients of a few piezoelectric materials and several molecular ferroelectrics under the same experimental con- ditions (Fig. 2D and table S2). The results show that as a mono-composition ferroelectric, TMCM- MnCl3exhibits an abnormally large piezoelectric coefficient among undoped metal oxides and other molecular materials (26).
Youet al.,Science357, 306–309 (2017) 21 July 2017 2 of 4
Fig. 2. Ferroelectric and related properties of TMCM-MnCl3.(A) Current density-bias voltage (J~V) curves and polarization-bias voltage (P~V) hysteresis loop. (B) Temperature-dependent data of the real part (e′) of dielectric permittivity (e=e′ –ie′′, wheree′′is imaginary part ofe).
(C) Piezoelectric coefficient (d33) of TMCM-MnCl3as a function of temperature and (inset) frequency. (D) Piezoelectric coefficient of TMCM-MnCl3compared with some inorganic and molecular materials, including PZT, BTO, PVDF, ZnO, LiNbO3, Nylon, Rochelle salt, potassium titanyl phosphate (KTP), triglycine sulfate (TGS), DIPAB (10), ImClO4(26), and croconic acid (12).
Measuredd33values are listed at the end of each bars.
RESEARCH | R E POR T
on July 20, 2017 http://science.sciencemag.org/Downloaded from
Both intrinsic and extrinsic factors contribute to the piezoelectricity. The intrinsic piezoresponse raises from the polarization change because of the lattice distortion, whereas the extrinsic factors are normally caused by the movement of non-180°
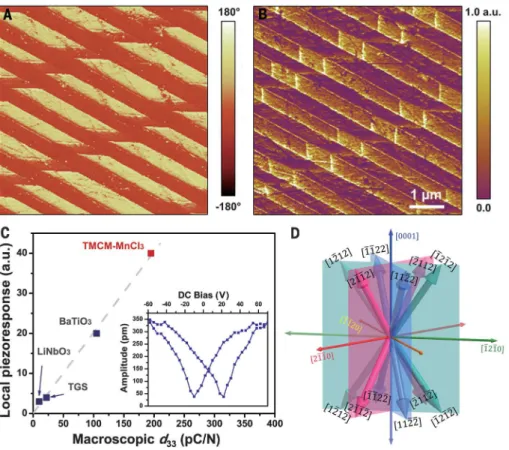
domain walls or interaction between crystal grains (27). Because we obtained the macroscopicd33on the as-grown single-crystalline monodomain sam- ple, we expected the larged33to be intrinsic. To further confirm the larged33, we used a piezore- sponse force microscopy (PFM) technique, whose submicrometer spatial resolution allows us to probe the piezoresponse within a single domain (28–31). With the sample heated up and then cooled down from the HTP paraelectric phase, the polydomain state can be obtained (figs. S11 to S15) (2). The typical PFM phase and amplitude images are shown in Fig. 3, A and B, respectively.
The surface appeared as a beautiful lamellar multi- domain structure. The local piezoresponse was then obtained on one of the single domains via extraction from the piezoresponse amplitude spec- trum as a function of DC bias voltage, also known as a“butterfly”curve (Fig. 3C, inset, and fig. S11) (32). Such local piezoresponses obtained from LiNbO3, triglycine sulfate (TGS), BTO, and TMCM- MnCl3were plotted as a function of macroscopic d33measured with the Berlincourt method (Fig.
3C). A good linear relationship was observed.
Because the local piezoresponse is proportional to the macroscopic d33, the prefactor for the dependence is related to the tip-sample geom- etry and other factors (29), which are not in the scope of this work. From these local micro- scopic measurements, the observed larged33on TMCM-MnCl3can be well supported.
To explain the origin of such a larged33, we need to understand the structural properties of TMCM-MnCl3. In the binary system of PZT, which is a solid solution of PbZrO3and PbTiO3, a maximumd33> 220 pC/N can be obtained at Zr/Ti = 0.52/0.48 by changing the relative com- position of Zr. The larged33is attributed to the morphotropic phase boundary between tetragonal and rhombohedral phases (33). For the single- composition crystal of TMCM-MnCl3, the large d33is due to the organic-inorganic structure.
Whereas the space group of the HTP of TMCM- MnCl3isP63/mmc, the space group of LTP of TMCM-MnCl3is the nonmaximal subgroupCc.
In this case, compared with the HTP, TMCM- MnCl3loses more than one symmetry elements in the ferroelectric LTP, leading to the multipolar- axes characteristic, which is supported by the observation of lamellar domain structures and non-180° domain walls (Fig. 3, A and B). From
crystallographic analysis and vector-PFM analy- sis (figs. S12 to S14) (2), there are six polar axes in TMCM-MnCl3, resulting in 12 different polariza- tion directions (Fig. 3D, inset). Moreover, by examining the strain tensors in the LTP, TMCM- MnCl3is also a partially ferroelastic material (2,22,34). Polarization states on the same polar axis,Pi+andPi–(i= 1, 2,…, 6), belong to the same strain stateSi(i= 1, 2,…, 6). Under an external stress, materials with ferroelasticity switch from one strain state to the other, which has been intensively studied in inorganic ferroelectrics, such as BTO and PZT (35). In our case, when the external stress switches TMCM-MnCl3from SitoSj(i,j= 1, 2,…, 6), the polarization state is also switched fromPi
+/−toPj
+/−(i,j= 1, 2,…, 6), respectively. Such rotation of polarization direction prompts an anomalously large change of the po- larization, leading to the large piezoresponsivity.
Moreover, TMCM-MnCl3 displays excellent photoluminescence properties, with a near-unity photoluminescence emission efficiency (figs. S16 to S18) (2). A thin-film sample of TMCM-MnCl3
can also be prepared with large-area coverage and good uniformity by means of a simple drop- cast method (fig. S19). The PFM characterization on domain structure and polarization reversal have also been carried out on thin-film of TMCM-MnCl3 (figs. S20 to S23) (2). Because the large piezo- electricity is due to the particular structural prop- erty, more piezoelectrics may be formed by replacing Mn with other metals. For example, we synthesized a high-temperature molecular piezoelectric compound of trimethylchloromethyl ammonium trichlorocadmium(II) [Me3NCH2ClCdCl3 (TMCM-CdCl3)] that has similarly attractive piezo- electric properties (figs. S24 to S27) (2).
We have discovered an organic-inorganic pe- rovskite ferroelectric material of Me3NCH2ClMnCl3
(TMCM-MnCl3) that shows an excellent piezo- electric response (d33= 185 pC/N) that is close to that of inorganic piezoelectrics of BTO (d33= 190 pC/N) and a high transition temperatureTc
of 406 K. The room-temperature process avoids the high-temperature sintering and high-voltage poling process. Solution-based processing al- lows deposition of TMCM-MnCl3on various sub- strates, including flexible polymer, making it attractive for a variety of applications. More- over, TMCM-MnCl3is an organic-inorganic ma- terial that can be further engineered through element substitution and molecular design so as to optimize for a desired physical property, as shown by demonstrations of bandgap engi- neering (20). Combining the outstanding piezo- electric properties and application advantages of molecular materials, we believe that this class of material has great potential for the next gen- eration of MEMS, flexible devices, wearable de- vices, and bionics.
R E F E R E N C E S A N D N OT E S
1. J. Curie, P. Curie,C. R. Acad. Sci. Paris91, 294–297 (1880).
2. Materials, methods, and supplementary text are available as supplementary materials.
3. J. Valasek,Phys. Rev.17, 475–481 (1921).
Youet al.,Science357, 306–309 (2017) 21 July 2017 3 of 4
Fig. 3. Microscopic ferroelectric/piezoelectric properties of TMCM-MnCl3.(AandB) Ferroelectric domain structures seen in PFM images constructed by (A) phase and (B) amplitude signal of the out-of-plane piezoresponse, where the non-180° domain structure can be clearly observed, indicating the multipolar-axes feature. (C) Comparison of local piezoresponse measured with PFM. The data are plotted against macroscopicd33so as to demonstrate the linear dependence. (Inset) The local piezoresponse of TMCM-MnCl3as a function of DC bias voltage. (D) Illustration of the 12 different polarization directions.
RESEARCH | R E POR T
on July 20, 2017 http://science.sciencemag.org/Downloaded from
4. J. Rödelet al.,J. Am. Ceram. Soc.92, 1153–1177 (2009).
5. Y. Saitoet al.,Nature432, 84–87 (2004).
6. Z. L. Wang, J. Song,Science312, 242–246 (2006).
7. T. Akutagawaet al.,Nat. Mater.8, 342–347 (2009).
8. B. Xu, S. Ren,Small12, 4502–4507 (2016).
9. P.-P. Shiet al.,Chem. Soc. Rev.45, 3811–3827 (2016).
10. D. W. Fuet al.,Science339, 425–428 (2013).
11. A. S. Tayiet al.,Nature488, 485–489 (2012).
12. S. Horiuchiet al.,Nature463, 789–792 (2010).
13. D. A. Bonnell,Science339, 401–402 (2013).
14. R. Bechmann,J. Acoust. Soc. Am.28, 347–350 (1956).
15. S. Wada, K. Yako, H. Kakemoto, T. Tsurumi, T. Kiguchi,J. Appl.
Phys.98, 014109 (2005).
16. D. B. Mitzi, C. A. Feild, W. T. A. Harrison, A. M. Guloy,Nature 369, 467–469 (1994).
17. H. Choet al.,Science350, 1222–1225 (2015).
18. F. Hao, C. C. Stoumpos, D. H. Cao, R. P. H. Chang, M. G. Kanatzidis,Nat. Photonics8, 489–494 (2014).
19. H. Tsaiet al.,Nature536, 312–316 (2016).
20. H.-Y. Yeet al.,Adv. Mater.28, 2579–2586 (2016).
21. H.-Y. Yeet al.,J. Am. Chem. Soc.137, 13148–13154 (2015).
22. K. Aizu,J. Phys. Soc. Jpn.27, 387–396 (1969).
23. L. Hu, S. Dalgleish, M. M. Matsushita, H. Yoshikawa, K. Awaga, Nat. Commun.5, 3279 (2014).
24. W. Zhang, R.-G. Xiong,Chem. Rev.112, 1163–1195 (2012).
25. A. P. Levanyuk, D. G. Sannikov,Usp. Fiziol. Nauk112, 561–589 (1974).
26. Y. Zhanget al.,Angew. Chem. Int. Ed.53, 5064–5068 (2014).
27. D. Damjanovic,Rep. Prog. Phys.61, 1267–1324 (1998).
28. D. A. Bonnell, S. V. Kalinin, A. Kholkin, A. Gruverman,MRS Bull.
34, 648–657 (2009).
29. A. L. Kholkin, S. V. Kalinin, A. Roelofs, A. Gruverman, in Scanning Probe Microscopy: Electrical and Electromechanical Phenomena at the Nanoscale, S. Kalinin, A. Gruverman, Eds.
(Springer New York, 2007), pp. 173–214.
30. H. Luet al.,Adv. Mater.27, 7832–7838 (2015).
31. D. A. Bonnellet al.,Rev. Mod. Phys.84, 1343–1381 (2012).
32. M. E. Caspari, W. J. Merz,Phys. Rev.80, 1082–1089 (1950).
33. W. Heywang, K. Lubitz, W. Wersing,Piezoelectricity: Evolution and Future of a Technology(Springer, 2008).
34. N. Setter, E. L. Colla,Ferroelectric Ceramics: Tutorial Reviews, Theory, Processing, and Applications(Birkhauser, 1993).
35. J. L. Jones, M. Hoffman, J. E. Daniels, A. J. Studer,Physica B 385–386, 100–102 (2006).
AC K N OW L E D G M E N TS
The manuscript was improved by the insightful reviews by the anonymous reviewers. This work was supported by the 973 project (grant 2014CB932103), the National Natural Science Foundation of China (grants 21290172, 91422301, 21427801, and 21290170), and the National Key Research Program of China (grants 2016YF0300101 and 2016YFA0201001). Thed33 data reported in this paper are tabulated in the supplementary materials. Data of crystal structures reported in this paper are deposited at the Cambridge Crystallographic Data Centre (deposition nos. CCDC 1429417-1429418 and 1515805-1515806).
SUPPLEMENTARY MATERIALS
www.sciencemag.org/content/357/6348/306/suppl/DC1 Materials and Methods
Supplementary Text Figs. S1 to S27 Tables S1 to S3 References (36–68)
22 August 2016; resubmitted 21 December 2016 Accepted 19 June 2017
10.1126/science.aai8535
Youet al.,Science357, 306–309 (2017) 21 July 2017 4 of 4
RESEARCH | R E POR T
on July 20, 2017 http://science.sciencemag.org/Downloaded from
An organic-inorganic perovskite ferroelectric with large piezoelectric response
Li, Da-Wei Fu, Zheming Wang, Song Gao, Kunlun Yang, Jun-Ming Liu, Jiangyu Li, Yanfa Yan and Ren-Gen Xiong
Yu-Meng You, Wei-Qiang Liao, Dewei Zhao, Heng-Yun Ye, Yi Zhang, Qionghua Zhou, Xianghong Niu, Jinlan Wang, Peng-Fei
DOI: 10.1126/science.aai8535 (6348), 306-309.
357 Science
, this issue p. 306 Science
robotics, biomedical devices, and other micromechanical applications that benefit from a less stiff piezoelectric material.
of traditional ceramics. This material may be a better option to use as a mechanical sensor for flexible devices, soft that organic perovskite structured piezoelectric material that is far more pliable yet has a piezoelectric response similar to
identified an et al.
, which are also extremely stiff. You 3
or PbZrO 3
piezoelectric materials are ceramics such as BaTiO
Piezoelectric materials allow conversion between electricity and mechanical stresses. The most efficient Finding a more flexible mechanical sensor
ARTICLE TOOLS http://science.sciencemag.org/content/357/6348/306
MATERIALS
SUPPLEMENTARY http://science.sciencemag.org/content/suppl/2017/07/20/357.6348.306.DC1
REFERENCES
http://science.sciencemag.org/content/357/6348/306#BIBL This article cites 64 articles, 4 of which you can access for free
PERMISSIONS http://www.sciencemag.org/help/reprints-and-permissions
Terms of Service Use of this article is subject to the
is a registered trademark of AAAS.
Science
licensee American Association for the Advancement of Science. No claim to original U.S. Government Works. The title Science, 1200 New York Avenue NW, Washington, DC 20005. 2017 © The Authors, some rights reserved; exclusive
(print ISSN 0036-8075; online ISSN 1095-9203) is published by the American Association for the Advancement of Science
on July 20, 2017 http://science.sciencemag.org/Downloaded from
www.sciencemag.org/content/357/6348/306/suppl/DC1
Supplementary Material for
An organic-inorganic perovskite ferroelectric with large piezoelectric response
Yu-Meng You,* Wei-Qiang Liao, Dewei Zhao, Heng-Yun Ye, Yi Zhang, Qionghua Zhou, Xianghong Niu, Jinlan Wang, Peng-Fei Li, Da-Wei Fu, Zheming Wang, Song
Gao, Kunlun Yang, Jun-Ming Liu, Jiangyu Li,* Yanfa Yan,* Ren-Gen Xiong*
*Corresponding author. Email: [email protected] (Y.-Y.M.); [email protected] (J.L.);
[email protected] (Y.Y.); [email protected] (R.-G.X.) Published 21 July 2017, Science 357, 306 (2017)
DOI: 10.1126/science.aai8535 This PDF file includes:
Materials and Methods Supplementary Text Figs. S1 to S27 Tables S1 to S3 References
Materials and Methods Crystal growth
(Chloromethyl)trimethylammonium chloride was synthesized by the reaction of equimolar amounts of trimethylamine (30 wt % in water) and dichloromethane in acetonitrile at room temperature for 24 h. The solvent was removed under reduced pressure. The obtained colorless solid is hygroscopic and should be stored in a vacuum desiccator. Slow evaporation of a methanol solution (100 ml) of
(chloromethyl)trimethylammonium chloride (50 mmol) and anhydrous manganese(II) chloride (50 mmol) resulted in the formation of red block single crystals of
Me3NCH2ClMnCl3 (TMCM-MnCl3). The purity of the bulk phase was verified the powder X-ray diffraction (Fig. S1).
Characterization Methods
Common characterization methods like differential scanning calorimetry (DSC), second harmonic generation (SHG) and photoluminescence spectroscopy
measurements were described elsewhere (26, 36, 37). In these measurement, powder sample were used.
The macroscopic piezoelectric coefficient (d33) was measured by a commercial piezometer (Piezotest, model: PM200) using "Berlincourt" method (also called
"quasi-static" method). The sample crystal was placed in between two flat metal plates which clamp the sample and apply a small oscillating force (5 N) along the normal direction, while the piezoelectric charge is measured. The Berlincourt method is a simple and straightforward way to measure the direct piezoelectric coefficient, d33. All measured crystals were selected with defined shape and the aspect ratio is more than 3 to ensure the d33 is correctly measured. The maximum of d33 value was found along the polar-axis of the sample crystal, which is near the proximity of <102>
direction.
For macroscopic ferroelectric test, a bulk crystal with thickness of ~0.3 mm was used with conducting silver-paste served as top and bottom electrodes. Two methods were employed to examine the ferroelectric properties: Sawyer-Tower method and double-wave method(23). The Sawyer-Tower method was carried out on a
commercial equipment (Radiant Tech. Inc. Model: Premier II) with operation
frequency of 50 Hz. The double-wave method was carried out on a home-built system consisting of programmable waveform generator (Agilent, Model: 33521A), high- voltage amplifier (Trek, Model: 623B) and programmable low-current electrometer (Keithley, Model: 6514).
The sample for dielectric permittivity measurement was similar bulk crystal used for ferroelectric test with conducting silver-paste served as top and bottom electrodes.
The dielectric permittivity (ε) is measured on an “automatic component analyzer”
(Tonghui Inc. Model: TH2828A) over the frequency range from 200 Hz to 1 MHz with AC voltage of 1 V.
The pyroelectric data was obtained on the same sample as ferroelectric test. A digital oven was used to control the sample temperature and a low-current
electrometer (Keithley, Model: 6514) was used to record the pyroelectric current.
PFM characterizations
The PFM measurement was carried out on a commercial piezoresponse microscope (Oxford instrument, MFD-3D) with high-voltage package and in-situ heating stage. PFM is based on atomic force microscopy (AFM), with an AC drive voltage applied to the conductive tip. When the tip is in contact with the sample surface, the local piezoelectric response can be detected by recording the distortional motion of the cantilever. Thus the piezoresponse can be estimated measuring the vibrating amplitude of the cantilever per unit drive voltage. In Fig. 3C, the
microscopic piezoresponse was calculated by dividing the maximum amplitude of in the inset by the drive voltage.
While the phase and amplitude of the electromechanical response of the surface reflect the orientation and magnitude of local ferroelectric polarization, respectively, image of local domain structure can be constructed by scanning the tip over sample surface, as shown in Fig. 3A and 3B. Furthermore, electromechanical response can also be probed as a function of DC bias of the tip, providing manipulations on the polarization directions.
Thin-film preparation
A methanol solution (20 μL) contains 40 mg/ml TMCM-MnCl3 was dropped onto a clean ITO-glass substrate (1.5 × 1.5 cm). The substrate with the droplet was placed inside a sealed Petri dish (35 × 10 mm). High quality plate-shaped crystals formed on the ITO-glass substrate after the solvent slowly evaporated on a hot plate of 35 ± 1 °C.
Supplementary Text
In this manuscript, we used Voigt notation (dmn, where m = 1, 2, 3, and n = 1,…,6) following ANSI IEEE 176 standard to represent the piezoelectric coefficient.
But in fact the piezoelectric coefficient is actually a third rank tensor and its non- contracted form is dijk (i, j, k = 1, 2, 3).
Crystal data of TMCM-MnCl3
At 293 K: C4H11Cl4MnN, Mr = 269.88, monoclinic, Cc, a = 9.478(5), b = 15.741, c = 6.577(3) Å, V = 977.7(8) Å3, Z = 4, Dc = 1.834 g cm3, = 2.375 mm1, R1 (I > 2σ(I)) = 0.0216, wR2 (all data) = 0.0465, S = 0.948.
At 423 K: C4H11Cl4MnN, Mr = 269.88, hexagonal, P63/mmc, a = 9.523(5), c = 6.638(7) Å, V = 521.3(8) Å3, Z = 2, Dc = 1.719 g cm3, = 2.227 mm1, R1 (I > 2σ(I))
= 0.0868, wR2 (all data) = 0.2434, S = 1.398.
Piezoelectric coefficient matrix
Considering the point group m of TMCM-MnCl3 in its ferroelectric phase, based on ANSI IEEE 176, the piezoelectric constant matrix [𝑑] can be written as:
(S1),
And the matrix [𝑑𝑇] of converse piezoelectric can be derived as:
11 31
12 32
13 33
24
15 35
26
0 0 0
0 0
0
0 0
d d
d d
d d
d
d d
d
(S2).
The element d33 is the longitudinal piezoelectric coefficient, which characterizes the volume change as response to an applied electric field in the same direction.
Symmetry analysis on the partial ferroelasticity
According to the symmetry change, the crystal of TMCM-MnCl3 belongs to the 6/mmmFm species which is among the 31 fully-ferroelectric/partially ferroelastic species (34). The “fully-ferroelectric” means that by applying electric-field, in principle, one can access all possible ferroelectric domain states. The “partially ferroelastic” means that by only applying stress, one can not access all possible ferroelastic states.(22) TMCM-MnCl3 has twelve ferroelectric states (different polarization directions), and each state of the ferroelectric crystal should have the mirror plane superimposed with (1 -1 0 0)-plane, or (0 1 -1 0)-plane, or (1 0 -1 0)- plane of the prototype. We set a rectangular coordinate system in the prototype of the 6/mmm, tacking the z-axis parallel to the six-fold axis, x-axis perpendicular to the (1 1 -2 0)-plane and z-axis perpendicular to the (1 -1 0 0)-plane. Suppose P1+ is in the yz- plane of the rectangular coordinate system. It can be found that any operations of point group 6/mmm keeps P1+ either unchanged or change to one of eleven different orientation states. By applying the symmetry operation of my, mz or C2x (the suffix x, y, and z indicate the directions of the symmetry elements, respectively) on P1+, the polarization states of P2+, P2- and P1-in the same plane can be generated. By applying of C3 the symmetry operation on P1+/- and P2+/-, other eight polarization states can be generated. To determine whether TMCM-MnCl3 is ferroelastic, partially ferroelastic or non-ferroelastic, we examine the strain tensor of the twelve polarization states. In state P1+, the strain tensor has the form:
(
𝑎 0 0 0 𝑏 𝑑 0 𝑑 𝑐
) (S3)
By applying the operation of my, mz and C2x to strain tensor (S3), one obtains the strain tensor (S4), (S5) and (S6) of P2+, P2- and P1-, respectively:
11 12 13 15
24 26
31 32 33 35
0 0
0 0 0 0
0 0
d d d d
d d
d d d d
(
𝑎 0 0
0 𝑏 −𝑑 0 −𝑑 𝑐
) (S4),
(
𝑎 0 0
0 𝑏 −𝑑 0 −𝑑 𝑐
) (S5)
and
(
𝑎 0 0 0 𝑏 𝑑 0 𝑑 𝑐
) (S6).
From those strain tensors, one can conclude that P1+, P1- have the same strain state S1, and P2+ and P2-have the same strain state S2.
By applying the operation of C3 to the strain tensor of P1+/- and P2+/-, (S3) to (S6), one obtains eight strain tensors of P3+/-, P4+/-, P5+/-, P6+/-, among which, only four independent strain tensors can be obtained, as (S7), (S8), (S9) and (S10):
(
−𝑏 𝑏 −𝑑
−𝑏 −𝑎 + 𝑏 −𝑑
𝑑 −𝑑 𝑐
) (S7)
(
𝑎 − 𝑏 −𝑎 𝑑 𝑎 −𝑎 0
−𝑑 𝑑 𝑐
) (S8)
(
−𝑏 𝑏 𝑑
−𝑏 −𝑎 + 𝑏 𝑑
−𝑑 𝑑 𝑐
) (S9)
(
𝑎 − 𝑏 −𝑎 −𝑑
𝑎 −𝑎 0
𝑑 −𝑑 𝑐
) (S10)
Each stain tensor is shared by two different polarization states, Pi+ and Pi- (i = 1, 2,…, 6). As a result, we obtained six independent strain tensors for TMCM-MnCl3, thus there are six different ferroelastic states (S1 to S6) corresponding to total twelve ferroelectric states. According to Aizu’s rule, TMCM-MnCl3 belong to type (II) of the ferroelectric-ferroelastic crystals, i.e. fully ferroelectric and partially ferroelastic, similar to that of BaTiO3 (22). For crystal of type (II), the different ferroelastic state can be switched by mechanical stress, which are accompanied by the change of polarization directions. In TMCM-MnCl3, the polarization states with opposite
direction have the same ferroelastic state, indicating that the mechanical stress can not reverse the polarization vector by 180º. But it is possible for external stress to rotate the polarization vector by non-180º. Such stress induced polarization switching is similar to that in BTO and PZT (35, 38, 39).
Local domain structure analyzed by PFM
In general, PFM can measure both the out-of-plane component (OP-PFM) and the in-plane component (IP-PFM) of the local piezoresponse by monitoring the vertical displacement and torsional movements of the cantilever, respectively. In Fig.
3, images were generated by OP-PFM which reveal the existence of non-180o domain structures, which further supports the multi-polar-axes nature of TMCM-MnCl3. In order to analyze the local domain structure and identify different polarization states, we have carried out comprehensive PFM studies on the surface of crystal of TMCM- MnCl3, which include both OP-PFM and IP-PFM with different tip-sample
orientation to extract information about the exact direction of polarization at different domains.
Since crystals of TMCM-MnCl3 was grown in its ferroelectric phase and the growth temperature (~300 K) is much lower than the Curie temperature (406 K), the as-grown crystal of TMCM-MnCl3 is in mono-domain state, as indicated by large area PFM images in Fig. S10. In order for TMCM-MnCl3 to reach a poly-domain state, the crystal was heated up to its paraelectric phase and cooled down to its ferroelectric phase. PFM studies were then carried out with scan size of 50 × 50 µm, as shown in Fig. S12. Since the IP-PFM signal measures component of piezoresponse
perpendicular to the cantilever-axis, in order to obtain the exact in-plane direction of the polarization, two sets of IP-PFM images were recorded with different cantilever- sample orientations, where the cantilever-sample orientations are indicated in the top left corner of Fig. S12A and S12B. In this way, we can obtain the in-plane component (x- and y-direction) and out-of-plane (z-direction) component of local piezoresponse.
From the large-area PFM phase and amplitude images, complex domain structures can be observed. Irregular shaped super-domains (illustrated by different color contrast in Fig. S12D) consisting lamellar shaped sub-domains can be found in the phase images. Each super-domain has the same out-of-plane polarization direction and across the boundary of super-domains, all sub-domains reverse their polarization directions by ~180o in both x-, y- and z-directions, indicated by corresponding phase images (Fig. S12A, S12B and S12C, respectively). By carefully studying the PFM images, two different sub-domain structures can be found in the examined area. To analyze the polarization direction of domain fine structures, high spatial resolution OP-PFM and IP-PFM were carried out in two areas with different sub-domain
structures in similar super-domain, as indicated by the dotted blue box and green box.
With comprehensive phase and amplitude information in x-, y- and z-direction, one can obtain the sign (from phase images) and magnitude (from amplitude images) of polarization in each direction. In principle, by adding those vectors together, the exact polarization vector of each domain can be extracted. However, since OP-PFM and IP-PFM depend on different cantilever distortion, their absolute amplitudes are not comparable. Take the green boxed area as an example (Fig. S13A-J). The in-plane polarization directions for different types of domains with distinct polarization
directions can be concluded (details can be found in the figure caption of Fig. S13).
The out-of-plane polarization in this super-domain area was downward. By
combining the results in green and blue boxed areas in Fig. S13, totally six in-plane polarization directions can be identified, with their out-of-plane polarization
directions pointing downward. Considering the 180o reversed super-domains, there are twelve different polarization directions found on the sample surface, as illustrated in Fig. S14, where solid (dashed) arrows indicate upward (downward) out-of-plane
polarization, respectively. Since we are not able to obtain the exact polarization directions in three-dimension, we can not compare the polarization directions in Fig.
S14 with those indicated by crystal structure analysis as indicated in Fig. 3D. But the vector PFM results correspond well with previous discussion about multi-polar-axis, and the number of polarization states of TMCM-MnCl3.
To further demonstrate the polarization reversal process in a more direct way, a DC bias voltage was applied on the conductive PFM tip while the tip was scanning over certain area of the sample surface. With such a strong local electric-field, local polarization directions can be manipulated, as shown in Figs. S15.
Theoretical calculation on ferroelectric polarization
The crystal polarization was further evaluated by the Berry phase method developed by King-Smith and Vanderbilt (40, 41) . We performed first-principle calculations within the framework of density functional theory (DFT) implemented in the Vienna ab initio Simulation Package (VASP) (42, 43). The exchange-correlation interactions were treated within the generalized gradient approximation of the
Perdew-Burke-Ernzerh of type (44). The van de Waals interactions are considered by using DFT-D2 method of Grimme (45). For the purpose of comparison, we also included polarization calculated with other vdW corrections, as listed in Table S3.
The ground state at room temperature was found to be antiferromagnetic along the MnCl3 chain with a magnetic moment of 4.4 μB for each Mn atoms, which is 0.13 eV per unit cell lower than the ferromagnetic state. The calculated polarization vector lies in the ac plane. The vector module is 5.74 μC/cm2 and its projection along the c direction is 4.48 μC/cm2, which is close to the experimental value. Then we allowed the atoms to relax until atomic forces on each atom are smaller than 0.002 eV/Å. The polarization of this optimized structure is about 4.92 μC/cm2 in the c direction, which gives an expectation of larger polarization at lower temperatures. The continuous evolution of spontaneous polarization (both module and projection in the c direction) from the centrosymmetric structure ( = 0) to the optimized polar structure ( = 1) is plotted as a function of dimensionless parameter in Fig. S5. Both the displacement and the rotation of the (CH3)3NCH2Cl cations are included in .
Model for fitting the temperature dependent real part of dielectric permittivity (ɛ) The dielectric permittivity ɛ as a function of temperature T across the improper ferroelectric phase transition point TC is described by the Landau-Ginzburg theory proposed earlier (46-48). The Landau energy density f is written as:
2 4 6
0
1 2 2 2 2
0 1 2
1 1 1
( )
2 4 6
1 2
f T T
P a P a P EP
, (S11)
where ( > 0, , > 0, 0 > 0, a1, a2 > 0) are the free energy constants in the polynomials, T0 is the unstable limit of high-temperature paraelectric phase, is the
primary order parameter and P is the spontaneous polarization as the secondary order parameter, E is the electric field.
To determine the temperature dependences of P(T) and (T), it is necessary to find the minimum of the Landau energy f with E = 0. The polarization P can be obtained from the following equilibrium conditions for both paraelectric phase and ferroelectric phase:
3 5 2
0 1 2
( ) 2 2 0
f T T a P aP
,
(S12) and
1 2 2
0 1 2 2 0
f P a a P
P
,
(S13)
In the high-temperature paraelectric phase, P = 0, = 0, and = 0 which is a constant. This implies that the dielectric permittivity in the paraelectric phase is temperature-independent. For realistic improper ferroelectrics, the measured dielectric permittivity in the paraelectric phase region does show some weak temperature
dependence. This difference is believed to originate from the assumption that only the first term in the right side of Eq. (S11) is T-dependent in the Landau theory of phase transitions.
We now discuss the ferroelectric phase. The inverse dielectric permittivity in the limit of low T (< TC) and low electric field can be obtained:
2
-1 1 2 1
0 2 2 2 2
2 0
2 2
( 2 )(1 2 )
a a
a
, (S14)
where (T) is determined by equation:
2 2 2 2 4
2 4 1 0 1 2 0
0 2 2 2
2 0 2 0
2 2
( ) + =0
1 2 1 2
a a a
T T
a a
, (S15)
For the present improper ferroelectric, it is clear that the paraelectric to ferroelectric phase transition is of the first-order, indicating the abrupt jump of the dielectric permittivity at TC. Since a2 > 0, the T-dependence of is:
2 2 1 1/ 2
1 0
2 [1 ( ) ]
3
T T T T
, (S16)
where 2 is the jump of 2 at TC. Here T1 is defined by T1 = (4TC - T0)/3.
Substituting Eq.(S16) into Eq.(S14), ignoring the last term on the right side of Eq.(S14) results in the dielectric permittivity in the ferroelectric phase:
-1 1 1 1 1/ 2 0
1 0
1 2
2
2 [1 ( ) ]
3
=2
T T T T a
,
(S17)
It is clear that the dielectric permittivity will increase with increasing T in the ferroelectric phase region, and a jump of at TC up to a larger value will occur, as observed for most improper ferroelectrics (48-50).
Eq. (S17) is then used to fit the measured dielectric permittivity as a function of T below TC, while the dielectric permittivity at T > TC would be a constant.
f
(kHz) TC (K) T1 (K) T0 (K) 01 1
5 400.175 400.47 399.29 0.002 0.01313
10 399.85 400.57 397.68 0.0042 0.02007
100 400.58 401.55 393.64 0.0125 0.03049
1000 399.2 401.5 392.3 0.017 0.03358
Optical properties
As shown in Fig. S16, strong PL emission at ~650 nm can be seen under
ultraviolet excitation. The strong PL has a quantum efficient of 92% and long lifetime of ~1 ms, as shown in Fig. S17 and S18. Such strong PL is believed to originate from Mn2+ ion in an octahedral crystal field, similar to the previous reported hybrid
ferroelectrics (21). In Fig. S16, the absorption spectrum of TMCM-MnCl3 displays six (groups of) peaks corresponding to electronic transitions between the ground and the excited states of the Mn2+ ion in an octahedral crystal field (51). Therefore, the photoluminescence mechanism can be ascribed to the transition between the ground state of the d-electron configuration (t2g)3(eg)2 to the upper state of the configuration (t2g)4(eg) (52, 53).
Characterization on thin-film sample of TMCM-MnCl3
The as-prepared thin-film of TMCM-MnCl3 shows very good coverage and appears very uniform under optical microscopy, as shown in Fig. S19. Similar lamellar shaped domain structures were also observed on thin-film in poly-domain state, as shown in Fig. S20. To confirm the ferroelectricity in such thin-film, a local PFM spectroscopy was carried out. By applying different bias DC voltage, the amplitude and phase signal of piezoresponse were recorded as functions of bias DC voltage, as shown in Fig. S21. The hysteresis phase loop and butterfly amplitude curve are typical evidence for polarization reversal. To further visualize such polarization reversal process, following the same method for bulk sample, DC bias voltage was applied on thin-film surface to manipulate the local polarization states, and PFM phase images were obtained before and after the polarization manipulation
as shown in Fig. S22. The macroscopic ferroelectricity was also confirmed by double- wave method, as shown in Fig. S23.
Me3NCH2ClCdCl3 (TMCM-CdCl3)
By replacing the Mn in TMCM-MnCl3 to Cd, one obtains another molecular ferroelectric compound of Me3NCH2ClCdCl3 (TMCM-CdCl3), which has identical structure and properties to TMCM-MnCl3. The structure of TMCM-CdCl3 in HTP and LTP are illustrated in Fig. S24 and Fig. S25. The d33 of TMCM-CdCl3 is measured to be 220-240 pC/N, even larger than that of TMCM-MnCl3. The macroscopic
piezoelectric coefficient of d33 was measured by Berlincourt method as a function of temperature in Fig. S26. The temperature-dependent dielectric permittivity and pyroelectric are also included in Fig. S27A. The ferroelectric polarization of TMCM- CdCl3 is ~ 6 C/cm2 obtained by Sawyer-Tower method (Fig. S27C) and the Curie temperature is ~400 K extracted from DSC (Fig. S27B) and temperature-dependent SHG (Fig. S27D).
Crystal data for TMCM-CdCl3 at 293 K: C4H11CdCl4N, Mr = 327.34,
monoclinic, Cc, a = 9.4779(19), b = 15.777(3), c = 6.7898(14) Å, V = 1012.1(4) Å3, Z
= 4, Dc = 2.148 g cm3, = 3.148 mm1, R1 (I > 2σ(I)) = 0.0246, wR2 (all data) = 0.0593, S = 1.034.
At 413 K: C4H11CdCl4N, Mr = 327.34, hexagonal, P63/mmc, a = 9.492(9), c = 6.849(11) Å, V = 534.4(14) Å3, Z = 2, Dc = 2.034 g cm3, = 2.981 mm1, R1 (I >
2σ(I)) = 0.0726, wR2 (all data) = 0.1869, S = 1.363.
Fig. S1.
Pattern of the powder X-ray diffraction (PXRD) of TMCM-MnCl3, verifying the purity of the bulk phase.
Fig. S2
Ellipsoid drawings of the asymmetric units of the LTP (A) and HTP (B) of TMCM- MnCl3. Displacement ellipsoids were drawn at the 30% probability level. Atoms with suffix A–E were generated by symmetry operation. H atoms were omitted for clarity.
A
B
Fig. S3
Temperature-dependent characterization on TMCM-MnCl3. (A) DSC curves in the heating and cooling runs. (B) Temperature-dependent second harmonic generation (blue) and polarization measured by pyroelectric effect (purple).