This book explains why asset dedication works and provides evidence of its superiority over the asset allocation paradigm. By focusing on long-term performance, asset allocation takes advantage of the unique investment characteristics of stocks and bonds.
ACKNOWLEDGMENTS
The McGraw-Hill staff for their extremely professional attitude and actions, especially Alice Manning, who edited the manuscript in its entirety with an uncanny ability to discover better ways to convey ideas, and Kelli Christiansen and Pattie Amoroso, who are probably the most responsive and patient editors in the world.
ASSET
DEDICATION
PART 1
Asset Dedication—
It is not about looking after the best for the people who invest with them. This book will provide evidence, based on the actual historical record of the stock and bond markets since 1926, that asset dedication is both.
NOTES
CHAPTER 1
Asset Allocation—
This may be the first major shift in investment strategy since the advent of asset allocation. Still others may see it as filling a funding gap and simply as the next step in its development.
THE ROOTS OF ASSET ALLOCATION Why the Brokers Loved It
The research was interpreted that it was much better to follow an asset allocation formula and leave the portfolio alone than to tinker with it. In fact, once the basic asset allocation decision was made, other aspects of active management did not matter much.
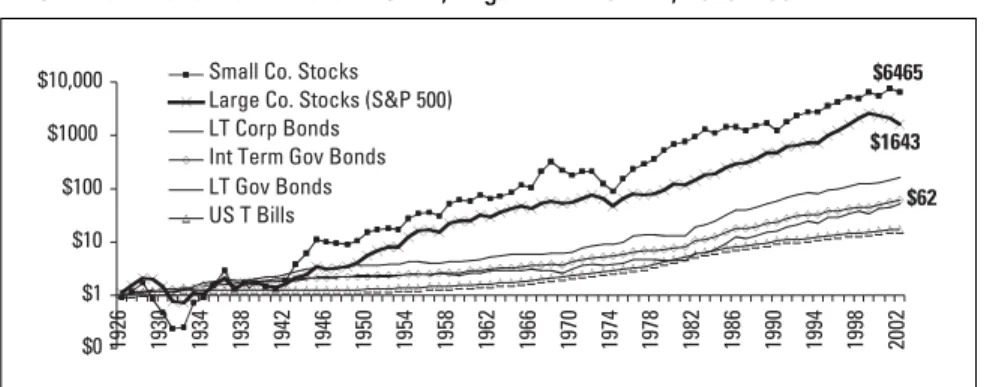
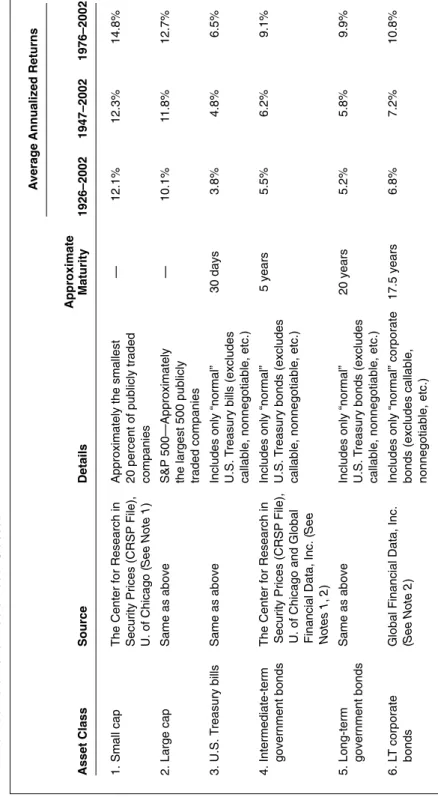
BASING ALLOCATIONS ON HISTORICAL AVERAGE RETURNS A Fact No One Disputes: Stocks Yield Higher Returns
Stocks of large companies (as measured by Standard & Poor's Index of 500 large company stocks, known as the S&P 500). Treasury bills (measured against 30-day US Treasury bills, considered to be the closest to the rate typically paid for cash held in money market funds.).
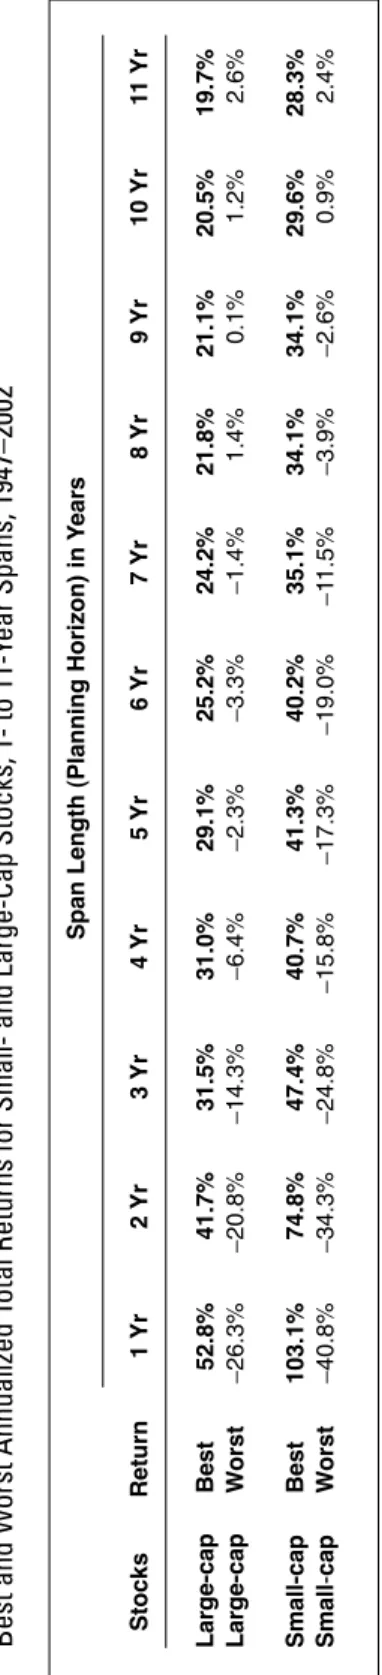
WHY NOT 100 PERCENT STOCKS?
Volatility—The Dark Side of Higher Returns
CHAPTER 2
Asset Allocation: The Gaps
THE EMPEROR’S NEW CLOTHES
The Worst-Kept Secret: The XYZ Formulas Are Arbitrary;
Brinson’s Clarification
However, in the best tradition of herd mentality, the financial community ignored this large theoretical gap in its rush to asset allocation. Creating an asset allocation plan without a way to determine the correct XYZ values is like building a house without blueprints, cooking without a recipe, or driving without a steering wheel.
THE PSEUDOSCIENCE OF RISK-TOLERANCE QUESTIONNAIRES Try Explaining “Risk Tolerance” to Your Mother
If it were truly scientific, then you would presumably get the same prescription for the same XYZ formula regardless of who did the analysis. The disparity between brokers in the best distribution again points to the same unpleasant fact: No one really knows the ideal values of XYZ for any given situation.
ACTIVE VERSUS PASSIVE MANAGEMENT
Brokers enjoy throwing around terms like "small-cap growth" or "mid-cap value" or "domestic versus international." But regardless of the number of asset classes considered, the core idea of asset allocation remains the same. There are only so many ways you can cut 100 percent and make any real difference.4 The truth is that most people choose their financial advisors the same way they choose their friends: on the basis of friendliness, trustworthiness, conscientiousness, availability, location and so on.
HAVE BROKERS LEARNED?
However, with thousands of coin flippers, some will surely be lucky enough to get ten heads in a row. But if you visit several brokers, there is a good chance that you will get different formulas, which will lead to different allocations and therefore different results.
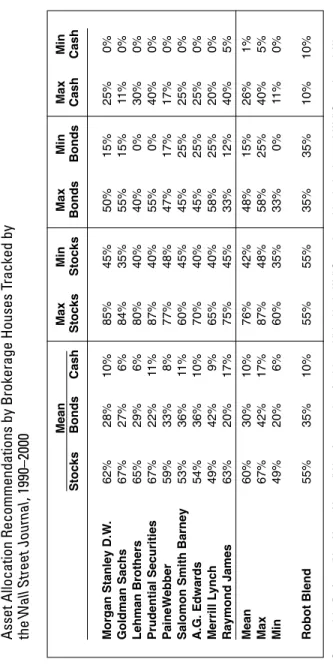
The Abysmal Record of Brokers’ Recommendations in the 1990s
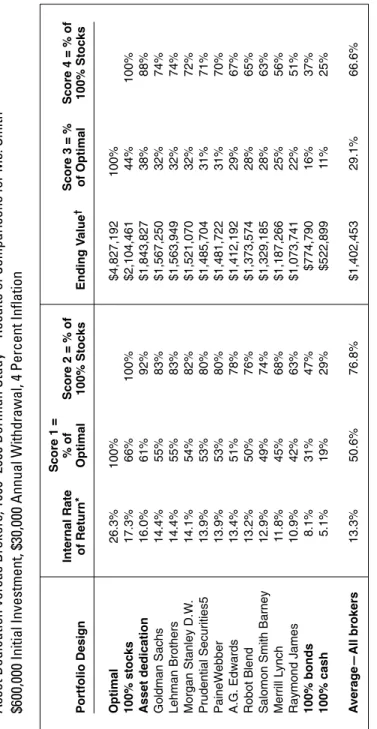
Just give them your money, they say, and they'll invest it to help you achieve your goals, get maximum returns with minimum risk, achieve optimal results, and make all your financial dreams come true—blah, blah, blah, blah, and on. The best broker, however, returned 14.8 percent, or about 56 percent of optimal (Lehman Brothers).
ASSET ALLOCATION IS NOT ALL BAD—
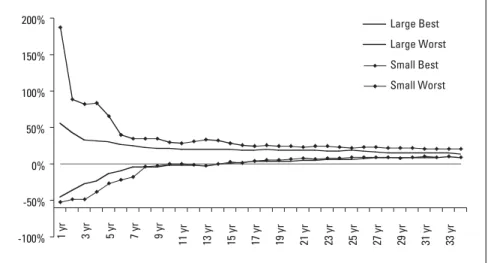
The best, average, and worst broker portfolios achieved just 76 percent, 68.9 percent, and 55 percent of 100 percent stocks, respectively, after 10 years. The bottom line is that those who claim to be asset allocation advocates seem to have missed the main conclusions of the original BHB research.
IT’S JUST OVERSOLD AND MISUSED A Few Socially Redeeming Qualities
CHAPTER 3
How It Works
THE ASSET DEDICATION APPROACH
Dedicated Portfolios Migrate from the Elite to the Masses
THE RIGHT ASSETS IN THE RIGHT PLACES FOR THE RIGHT REASONS
Best Uses of Stocks, Bonds, and Cash
The main idea for this part of the portfolio is to buy enough bonds to generate the target cash flow (interest and principal) over the planning horizon at minimum cost. This protects the income stream from the volatility of stocks by overcoming their fluctuations over the length of the planning horizon.
THE PRECISE ELEGANCE OF ASSET DEDICATION Matching and Protecting the Target Income Stream
Another way to compare asset dedication to asset allocation is to consider how most brokers view bonds. Using the "just-in-time" concept that has worked so well in industrial supply chains, asset dedication produces higher returns and lower risks in portfolio management.
ASSET DEDICATION STEP BY STEP Investing with Ms. Smith
- FORECAST INCOME OR CASH FLOW NEEDS
- SPECIFY A PLANNING HORIZON
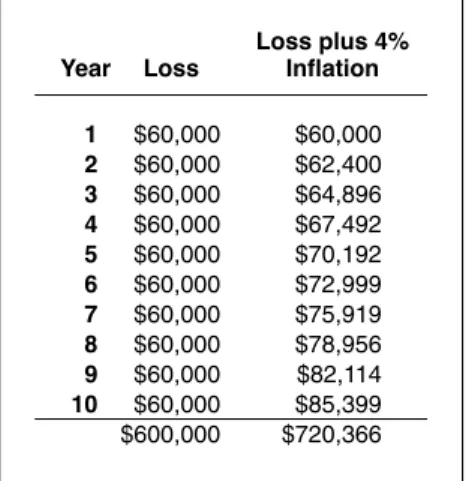
- ALLOW FOR INFLATION
- BOND RESTRICTIONS
- DEDICATE THE INCOME PORTION OF THE PORTFOLIO
- DEDICATE THE GROWTH PORTION OF THE PORTFOLIO
- REVIEW, RELOAD, AND REPEAT
Another possibility would be to have the horizon extension activated by gains in the growth portion of the portfolio. Smith wants to play it very safe and limits the income portion of the portfolio to U.S.A.
ADVANTAGES OFFERED BY ASSET DEDICATION Using Stocks and Bonds to Do What They Do Best
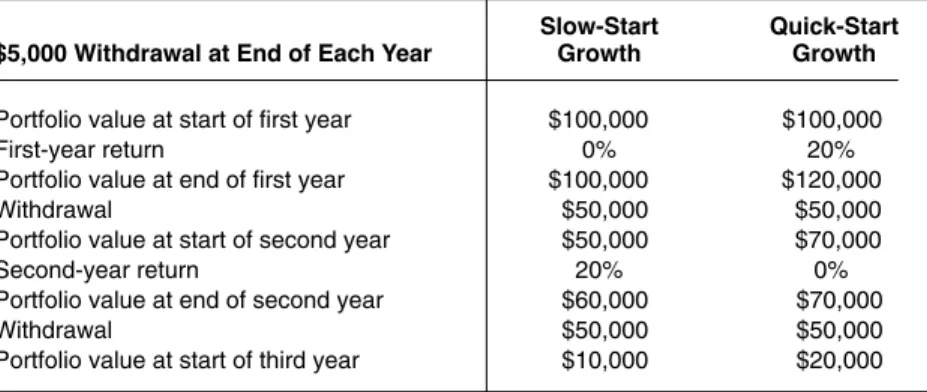
This is one of the main benefits of asset allocation as an investment strategy. Asset allocation reduces sequence risk because it isolates the growth portion of the portfolio from withdrawals.
CONCLUSION
CHAPTER 4
Asset Dedication versus Asset Allocation
Historical Comparisons from 1926
Had she followed an asset allocation plan, the estimated cost of the bonds would have been for Mrs. In the asset allocation model, the income portion generated the money needed for withdrawals.
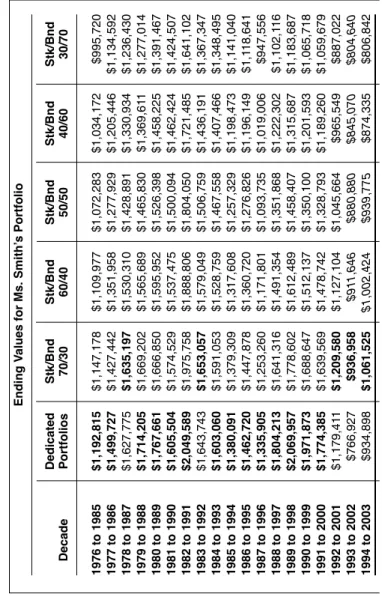
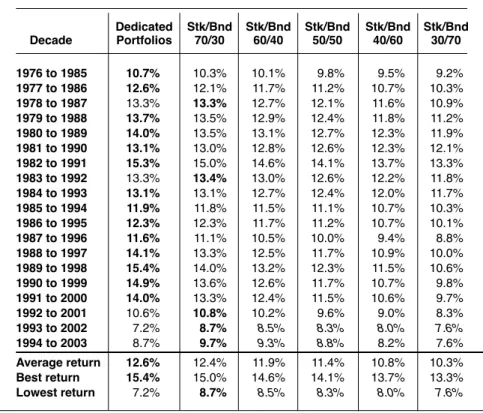
WHAT ABOUT OTHER STOCK AND BOND CHOICES?
Bonds were clearly the place to be at the time, with the most conservative portfolio (30/70) returning 2.6 percent per year. They all point to the same conclusion: asset dedication appears to be a superior strategy that is not only easy to understand, cheap to implement and favorable for reducing risk, but also provides higher returns than most asset allocation strategies. at least based on these historical comparisons.
Asset Dedication Wins in Nearly Every Category, 1926–2003
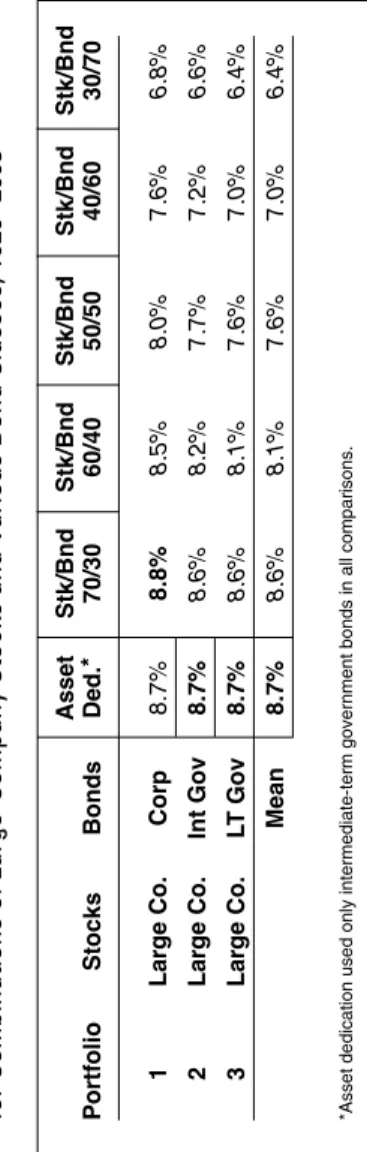
1926–2003, Large-Company Stocks with Other Bond Categories
1926–2003, Small-Company Stocks with Other Bond Categories ASSET DEDICATION WINS AGAIN
How will asset allocation compare to the asset allocation portfolios that use small company stocks for growth. No other asset allocation model beats asset allocation (the 60/40 allocation model ties it with corporate bonds).
WHAT ABOUT RISK?
It is clear that the total return should all be higher, but asset allocation remains dominant. Note that it tells the same story for small-company stocks as in Figure 4.7 for large-company stocks: asset dedication works better than asset allocation in almost all cases.
Measuring Volatility and Risk
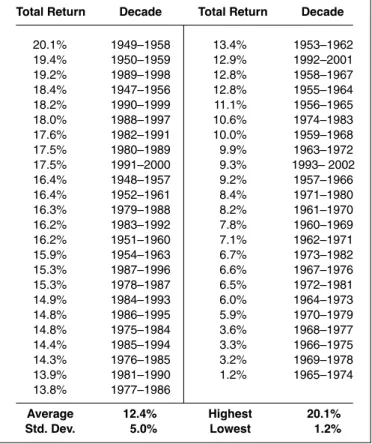
Note how the decadal rates of return move up and down for all portfolios tested, including the asset allocation and all asset allocation portfolios. The bottom line is that it is difficult to find a valid common denominator against which to compare asset allocation and asset allocation in terms of risk.
RISK AND THE CRITICAL PATH Checking If the Portfolio Is on Target
PART 2
Dedicating Assets before and after
CHAPTER 5
Calculating Your Financial Independence
ECONOMIC PHASES IN A PERSON’S LIFE
Accumulation, Distribution, and Transfer—Separate Phases, Environments, and Goals
Transfer phase – when money is passed on to heirs Each phase has its own unique investment environment, problems and goals. Wills, estates and similar matters are involved here even more than in the distribution phase.
FINANCIAL PLANNING IN THE ACCUMULATION PHASE Figuring Out How Much to Save—It’s Not an Easy Job,
If we don't make specific plans, if we avoid measuring our progress or outcome, we may make enough excuses along the way to evade the horrible realization that we are not perfect. If we mess it up, we can end our lives in absolute or relative poverty.
THE INDEPENDENCE CALCULATION
Saving for Retirement—How Much Is Enough?
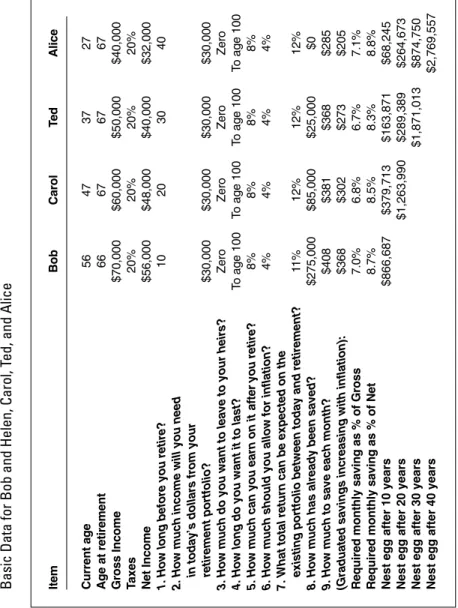
THE HARD PART: BASIC LIFE CHOICES Six Fundamental Pieces of Information
- HOW LONG BEFORE YOU RETIRE?
- HOW MUCH INCOME WILL YOU NEED IN TODAY’S DOLLARS?
- HOW LONG DO YOU WANT IT TO LAST?
- HOW MUCH CAN YOU EARN ON IT AFTER YOU RETIRE?
- HOW MUCH INFLATION SHOULD YOU ALLOW FOR?
- HOW MUCH DO YOU WANT TO LEAVE TO YOUR HEIRS?
The probabilities in Table 5.4 are similar to those used for Monte Carlo simulation studies of the stock market (see Chapter 13). He summarizes the information in Table 5.7 by listing the number of decades that fall in each inflation range.
THE RETIREMENT GOAL
Average (average) inflation rates have remained below 4 percent per year for 29 of the 47 decades, or 62 percent of the time. They will do what they can to live independently without becoming a burden on the rest of the family.
Setting the Target from the Independence Calculation
CHAPTER 6
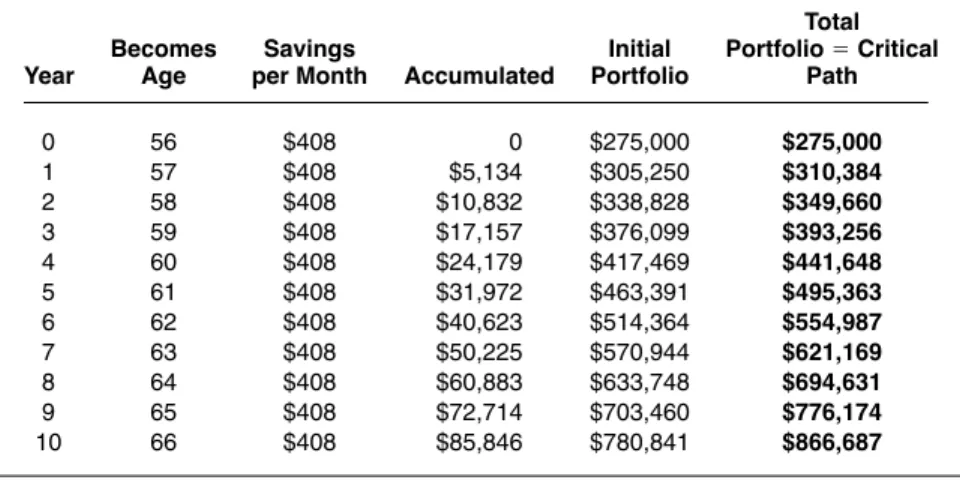
Finding Your Critical Path
The critical path itself is not the final destination, but it acts as a road map to ensure we reach the goal we want. THE CRITICAL PATH TO FINANCIAL INDEPENDENCE Projecting the required growth rate makes it easier.
THE CRITICAL PATH LEADING TO FINANCIAL INDEPENDENCE Projecting the Required Growth Rate Makes It Easier
How much should be saved every month to reach such high heights. How should they devote their assets at this time to achieve their goal.
- HOW MUCH HAS ALREADY BEEN SAVED?
- WHAT TOTAL RETURN CAN BE EXPECTED ON THE EXISTING PORTFOLIO BETWEEN TODAY AND RETIREMENT?
- HOW MUCH MUST BE SAVED EACH MONTH?
- DOES THE PORTFOLIO’S YEAR-END VALUE MATCH WHAT IT SHOULD BE?
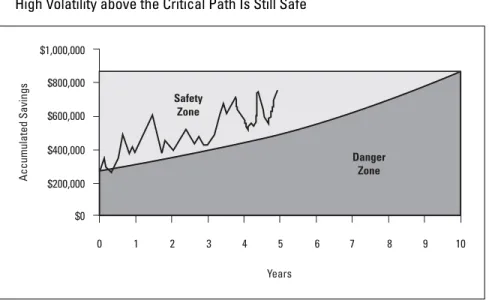
Swing and volatility over the critical path in the safety zone is not particularly relevant to the Browns. Fluctuations are only dangerous if they cause the portfolio's value to dip below the critical path and stay there.
THE CRITICAL PATH AS THE ROAD MAP TO RETIREMENT Why Some Fluctuations Are Harmless and Some Are Dangerous
In this case, the volatility of the portfolio has caused it to fall below the critical path. Obviously, high volatility above the critical path is much better than low volatility below the critical path.
AVOIDING A BLUNDER—THE MARKET DECLINE OF 2000 Clear Selling Signals Ahead of Time
The real problem is to make sure that the average return is high enough to keep the value of the portfolio above the critical path. However, anything that causes the portfolio value to drop significantly below the critical path and stay there will cause damage.
LOCKING IN RETIREMENT EARLY BY FINE-TUNING
Buying Bonds When the Portfolio Is within Striking Distance
As asset dedication begins to spread, reputable and progressive advisors within the financial community will no doubt discover other ways to benefit their clients by developing new ways to use the underlying ideas.
THE BLUNDER OF IGNORANCE AND GREED
The $300,000 Penalty for Ignoring or Being Ignorant of the Selling Signals
If they say that their goal is simply to "get as much as I can," they will never reach their goal because they will never know what it is. When the market finally falls back, they then complain about their "losses." They will always moan that their portfolio is not worth as much as it was when it reached its highest level.
MORE EXAMPLES—A YOUNGER GROUP
Twenty-, Thirty-, and Forty-Somethings Face the Same Problem
WHAT IF I CANNOT SAVE ENOUGH?
Many Solutions, None Painless
- CUT THE INCOME NEEDED FROM $60,000 TO $50,000 OR
- FIND A HIGHER PRERETIREMENT RATE OF RETURN
- RETIRE LATER
- DON’T PLAN FOR SUCH A LONG LIFE AFTER RETIREMENT This gets into an area that most people find depressing: their own
- CHAPTER 7
The difference is because interest earned on the portion of the nest egg remaining in the account is compounded each year until it is withdrawn. In the wake of the Enron scandal, recent legislation has remedied some of these problems.
The Distribution Phase
Dedicating Assets to Do Their Job
In the very early stages of their retirement, the Browns have a large sum of money (and are probably on every broker's hit list). But it's doubtful that Social Security will ever completely fold, as some fear.
THE THREE CLASSIC RETIREMENT QUESTIONS Building the Foundation for Asset Dedication
It also depends on whether inflation is to be included in the amount raised. I did not do the independence calculation, plot a critical path, or consider any of the factors outlined in the previous chapter.
A “DO-IT-YOURSELF” RETIREMENT PORTFOLIO Implementing the Retirement Plan
They can take a "do-it-for-me" approach by hiring a financial advisor to handle everything. A compromise between the "do-it-for-me" and "do-it-yourself" extremes is also possible.
THE MATHEMATICS BEHIND ASSET DEDICATION
Precision-Guided Bonds to Hit the Exact Target Income Stream
If only zero-coupon bonds are used to finance the income portion of the portfolio, no higher-level math is necessary. Zero-coupon bonds have a somewhat unique position in the tax code, as taxes must be paid regardless of the fact that the bonds actually paid no interest.
THE CRITICAL PATH AFTER RETIREMENT
It's a bit like playing the violin: it only looks easy to someone who knows how to do it. Anyone who has taken a course involving mathematical programming can attest to its complexity (unfortunately, I'm sure some of my MBA students never really get it).
Tracing a Portfolio That Is Reloaded Every 5 Years to Age 100 and Beyond
Of course, they don't have to spend every penny, and they can always plow any leftover money back into the growth portion of their portfolio. The important thing for the Browns is that their portfolio stays above this critical path.
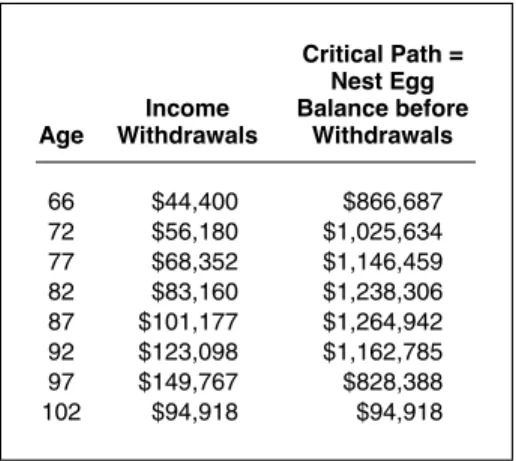
MAINTAINING AND RELOADING THE INCOME PORTION Fixed versus Rolling Horizons, Extending Horizons
CHAPTER 8
Building an Asset
Dedicated Portfolio: Doing It Yourself on the Internet
But the mechanics of entries and exits should allow anyone to understand how simple portfolio construction can be. The website requires only three screens to dedicate assets: the Inputs screen (Table 8.1), the Scenarios screen (Table 8.2), and the Details screen (Table 8.5).
MAKING THE CHOICES AND ENTERING THE DECISIONS AS INPUTS
You can test different scenarios until you find the one that works best for you. You will have dedicated the assets to manage the income portion of your portfolio to your specifications, and that portion of the portfolio will continue to do its job quietly, automatically, and cheaply.
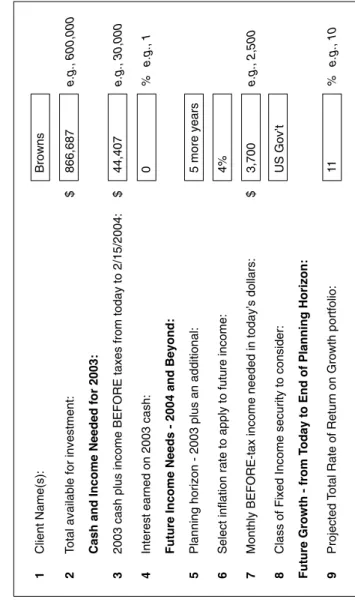
The Data Entry Input Screen
This is the only information the website needs to perform its analysis. When you click the "Analyze" button, the website backup software will project the expected results from this scenario as described in the next section.
SCENARIOS: TESTING THE CONSEQUENCES OF VARIOUS CHOICES
Assume they use the same yield they used before, which is 11 percent, the average for the S&P 500. It will also list the exact bonds to buy in the exact amounts needed to cover the Browns' revenue withdrawals for the satisfy next 5 years.
The Output Screen
If interest rates rise after the bonds are purchased, the market value of the bonds will be less than what the Browns paid for them. Percentage allocations become a byproduct of the Browns' decisions to meet their needs.
DETAILS: THE LIST OF BONDS TO BUY
The Right Bonds in the Right Quantities to Do the Trick
CHAPTER 9
Using Asset Dedication for More than Steady
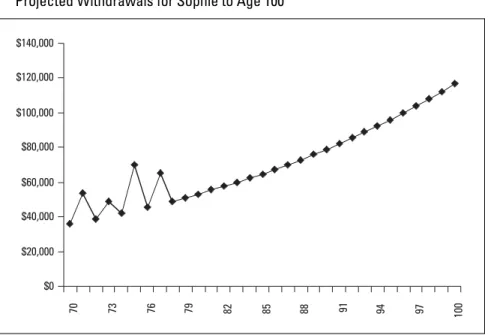
AN IRREGULAR “LUMPY” WITHDRAWAL STREAM
Sophie Takes Her Grandchildren on Cruises Every Other Year
The asset allocation website cannot be used directly during the period when it will make irregular withdrawals. To meet the first decade, the technique of mathematical programming must be used to minimize the cost of the bonds needed to cater for her erratic withdrawal pattern.
THE LEGAL SETTLEMENT
If the bonds could be purchased in fractional amounts, a perfect fit could be achieved, but it is hard to imagine that greater accuracy is needed for most real-world circumstances. This will represent only about 3.2 percent of its portfolio at that time, assuming a total return of 11 percent.
Generating a Win-Win Compromise
The same is true for future claims, meaning that Tom cannot simply retire at age 52 and refuse any further employment at the expense of the other driver's insurance company. Plaintiff economists tend to argue for low rates to maximize the present value of the loss, while defense economists tend to argue the opposite to minimize the present value.