Unfortunately, the real source of bias – the mixing of investment banking activities and investment advice – remained untouched. As valuation models are introduced in this book, there is a risk that we focus solely on the outcome, i.e. the value of the company, and whether it is undervalued or overvalued, and that we miss some valuable insights that can be gained from the valuation process. the appreciation. It is a long-term investment strategy, and the assumptions underlying it are: a) the relationship between value and the underlying financial factors can be measured.
APPROACHES TO VALUATION
Discounting this cash flow at the risk-free rate should give the value of the bond. When cash flows into a business are mistakenly discounted at the cost of equity capital, the value of the business is understated by. In discounted cash flow valuation, the value of a company is determined by its expected cash flows.
UNDERSTANDING FINANCIAL STATEMENTS
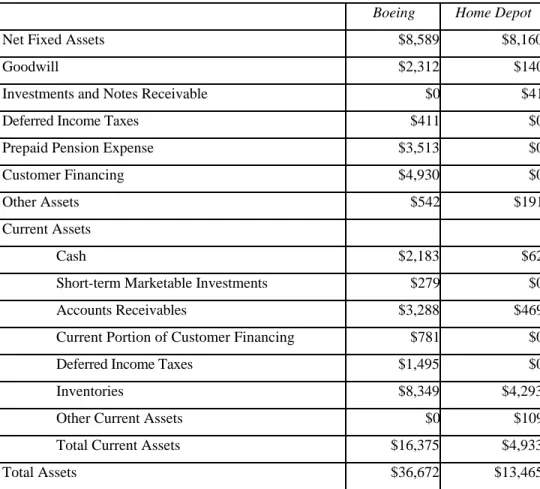
The Basic Accounting Statements
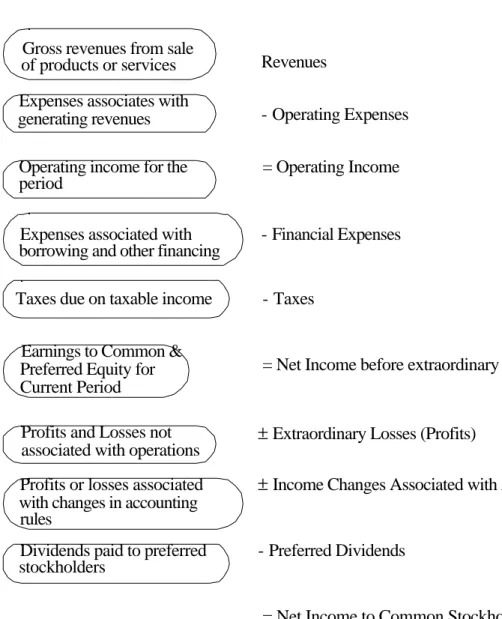
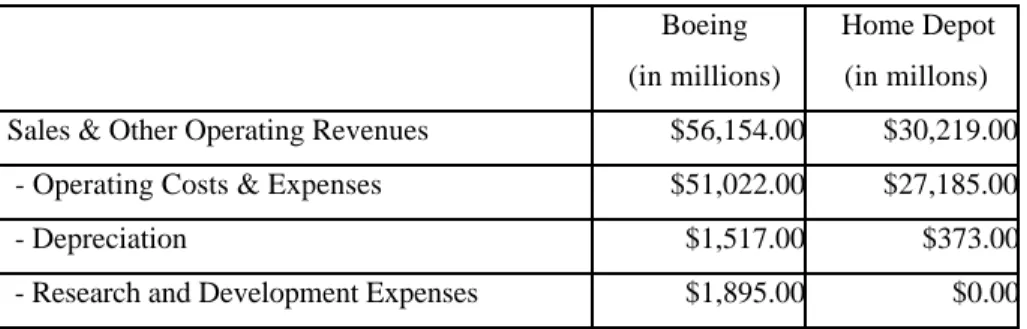
Next is the income statement, shown in Figure 3-2, which provides information about the company's income and expenses, and the resulting income earned by the company over a period of time. Finally, there is the cash flow statement, shown in Figure 3-3, which specifies the company's sources and use of cash from operating, investing, and financing activities over a period of time. The cash flow statement can be seen as an attempt to explain how much the cash flows were during a period, and why the cash balance changed during the period.
Asset Measurement and Valuation
Thus, unrealized losses reduce the book value of equity in the business, and unrealized gains increase the book value of equity. At that time, the difference between the market price and the net value of the shareholding in the company is treated as a gain or loss for the period. Thus, the intangible asset is not normally valued in the company's balance sheet.
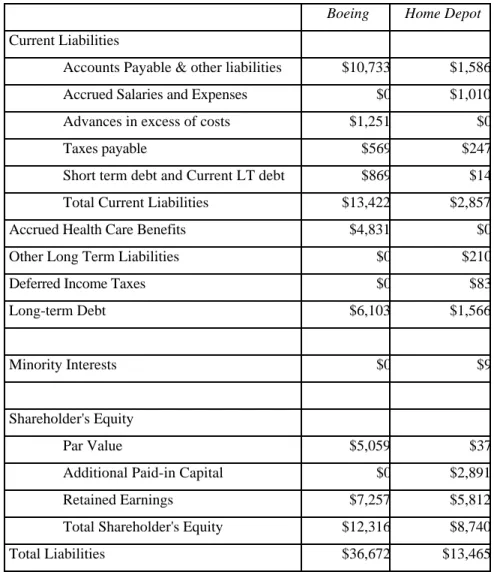
Measuring Financing Mix
Since these repurchases are made at the current market price, they can result in significant reductions in the book value of equity. In the far more widespread case where options are given or granted to management, there is no effect on the book value of equity. Because these leases are treated as operating expenses, they do not appear on the balance sheet.
Measuring Earnings and Profitability
By separating the financing effects from the operating effects, the return on assets provides a cleaner measure of the true return on those assets. A more useful measure of return relates operating income to the capital invested in the company, with capital defined as the sum of the book value of debt and equity. While return on capital measures the profitability of the company as a whole, return on equity (ROE) examines profitability from the equity investor's perspective by relating the equity investor's earnings (net earnings after tax and interest expense) to the book value of the enterprise. the equity investment.
ROC-i1-t )
Note that we used a tax rate of 35% for both the return on capital and the book interest rate. This approach results in a return on equity that is different than that estimated using net income and book value of equity.
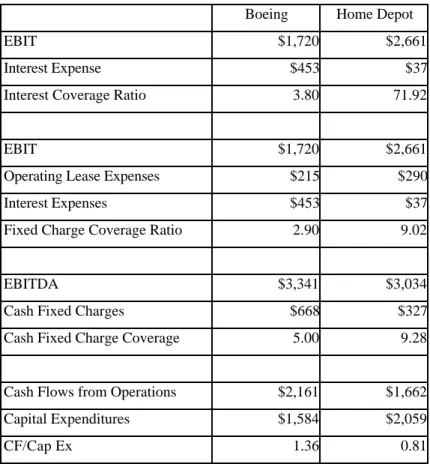
Measuring Risk
Measures of long-term solvency attempt to examine a company's ability to meet interest and principal payments over the long term. The denominator in the interest coverage ratio can easily be extended to cover other fixed obligations such as lease payments. The second measures debt as a proportion of equity in the company and can be easily derived from the first.
Other issues in analyzing financial statements
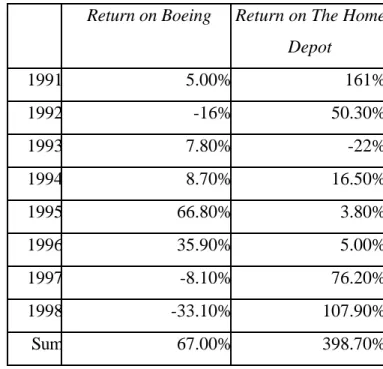
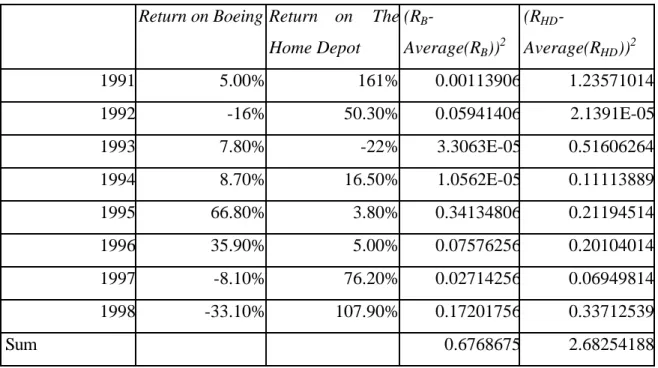
Boeing has a much higher book value debt ratio, both long-term and total debt, than Home Depot. The two countries that offer the strongest contrast to the United States are Germany and Japan. First, companies in the United States generally maintain separate tax and accounting books, which in turn generate items such as deferred taxes to cover differences between the two books.
Consequently, it is much more likely that the depreciation methods in financial reports will be accelerated and thus the reported income will fall. Second, in the United States, the requirement that leases be capitalized and reported as a liability is much more strictly enforced. In Japan, leases are generally treated as operating leases and do not appear as liabilities on the balance sheet.
Third, goodwill, once created, can be amortized over 40 years in the United States and over much shorter periods in Germany and Japan, again hurting stated income. Fourth, reserves in the United States can only be created for specific purposes, while German and Japanese companies can use general reserves to equalize earnings over periods, resulting in earnings being understated during good years and overstated during bad years. Most of these differences can be accounted for and adjusted for when making comparisons between companies in the US.
Ratios such as price-earnings, which use stated and unadjusted earnings, can be misleading if accounting standards differ significantly between the companies being compared.
Summary
In Germany, firms can capitalize leases, but they have more discretion in classifying leases as operating and capital leases than in the U.S. Capital expenditures take the form of depreciation and amortization and are spread over several time periods. Accounting standards miscategorize operating leases and research and development expenses as operating expenses (when the former should be categorized as financing expenses and the latter as capital expenses).
In the final part of the chapter, we examine how financial statements deal with short-term liquidity risk and long-term default risk. While the emphasis in financial statements is on examining the risk that companies may not be able to make the payments they have committed to, there is very little emphasis on the risk to equity investors.
Problems
THE BASICS OF RISK
- Defining Risk
- Diversifiable and Non-diversifiable Risk
- Models Measuring Market Risk
- Multi-factor Models for risk and return
- Regression or Proxy Models
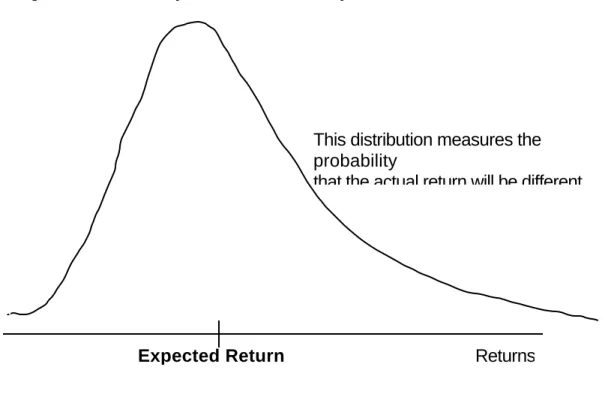
First, we will define risk in terms of the distribution of actual returns around the expected return. When return distributions have this shape, the characteristics of each investment can be measured by two variables—the expected return, which represents the opportunity in the investment, and the standard deviation, or variance, which represents the risk. We will begin with what is still the standard model for measuring market risk in finance—the capital asset pricing model (CAPM)—and then discuss alternatives to this model that have developed.
Statistically, this additional risk is measured by the covariance of the asset with the market portfolio. In a world where investors hold a combination of only two assets—the risk-free asset and the market portfolio—the risk of each individual asset will be measured against the market portfolio. In particular, the expected return of an asset can be written as a function of the asset's risk-free rate and beta.
In fact, this beta has many of the same properties as the market beta in the CAPM. The terms in brackets can be considered to be risk premiums for each of the factors in the model. The capital pricing model can be considered a special case of the arbitrage pricing model where there is only one economic factor that drives market-wide returns and the market portfolio is the factor.
Each investor in the capital asset pricing model owns a combination of the market portfolio and a risk-free asset. Assume that the standard deviation of the market portfolio is 30% and that the expected return of the portfolio is 15%. What part of the wealth of the following investor. would you suggest to invest in the market portfolio and what proportion in the risk free asset.
OPTION PRICING THEORY AND MODELS
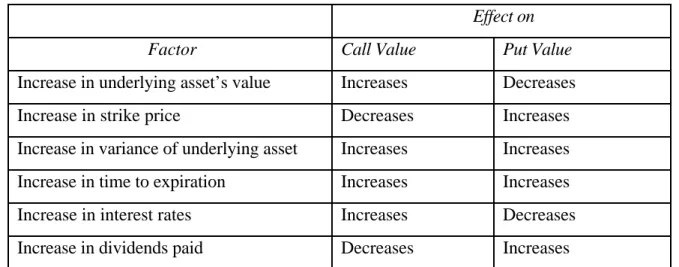
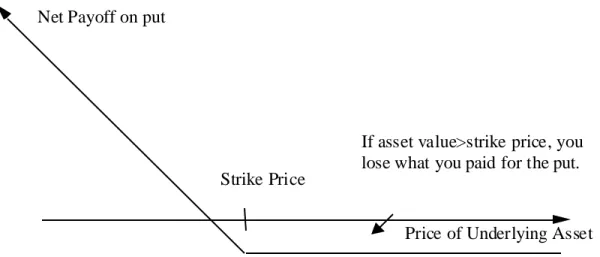
Current value of the underlying asset: Options are assets that acquire value from an underlying asset. Consequently, changes in the value of the underlying asset affect the value of the options on that asset. Puts, on the other hand, become less valuable as the value of the asset increases.
The higher the variance in the value of the underlying asset, the greater the value of option1. For very deep in-the-money call options, higher variance can reduce the value of the option.]. Call Value = Current Value of the Underlying Asset * Option Delta - Borrowing required to repurchase the option.
The value of the call must therefore be the same as the value of this position. One occurs when the underlying asset pays large dividends, thereby reducing the expected value of the asset. The second is to try to adjust the value of the option for the possibility of early exercise.
The Black-Scholes model is based on the assumption that the exercise of the option does not affect the value of the underlying asset.
MARKET EFFICIENCY – DEFINITION, TESTS AND EVIDENCE
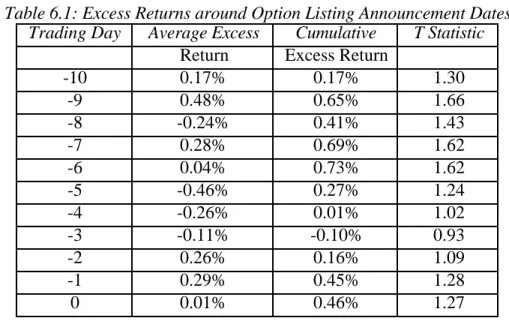
An efficient market is one where the market price is an unbiased estimate of the true value of an investment. The asset (or assets) that is the source of the inefficiency must be traded. The assumption in event studies is that the time of the event is known with a considerable degree of certainty.
The return on the market index (Rmt) was calculated for each of the 21 trading days. When this selection is random, this does limited damage to the results of the study. This section of the chapter attempts to summarize the evidence from market efficiency studies.
A run test is a non-parametric variation of the serial correlation, and it is based on a count of the number of runs, i.e. sequences of price increases or decreases, in the price changes. The following section summarizes some of the more commonly noted anomalies in financial markets in the United States and elsewhere. The excess returns earned by stocks with low earnings ratios are difficult to justify using a variation of the argument used for small stocks, ie. that the risk of stocks with a low PE ratio is underestimated in the CAPM.
Studies of returns in the United States and other major financial markets consistently reveal large differences in the behavior of returns between months of the year. Another rationale is that the January effect is related to institutional trading behavior at the turn of the year. It refers to the difference in returns between Mondays and other days of the week.