3
Bank Ownership, Characteristics, and Performance:
A Comparative Analysis of Domestic and Foreign Islamic Banks in Malaysia
Fadzlan Sufian and Muhd-Zulkhibri Abdul Majid CIMB Bank Berhad, Department of Banking and Finance, Faculty of Business and Accountancy, University of Malaya
and Senior Economist Central Bank of Malaysia Monetary and Financial Policy Department,
Bank Negara Kuala Lumpur, Malaysia
[email protected], [email protected] [email protected]
Abstract. The paper investigates the performance of Malaysian Islamic banking sector during the period 2001-2005. Several efficiency estimates of individual banks are evaluated using non- parametric Data Envelopment Analysis (DEA). Two different approaches have been employed to differentiate how efficiency scores vary with changes in inputs and outputs. The analysis links the variation in calculated efficiencies to a set of variables, i.e. bank size, ownership, capital, non-performing loans and management quality.
The findings suggest that during the period of study, scale inefficiency dominates pure technical inefficiency in the Malaysian Islamic banking sector. We found that foreign banks have exhibited higher technical efficiency compared to their domestic counterparts. The second stage empirical results based on multivariate Tobit model also suggest that technically more efficient banks are larger, have greater loans intensity, and on average have less non-performing loans.
1. Introduction
Since the opening of the first Islamic bank in Egypt in 1963, Islamic banking has grown rapidly all over the world. Islamic banking operations started out as a mere deposit taking and lending facility and has since transformed into all aspects of banking, money and capital market operations, including fully fledged stock exchanges. This was further intensified by the 1975 oil price boom, which introduced a huge amount of capital inflows to Islamic countries.
In fact, two Islamic nations, Iran and Pakistan, completely abandoned conventional banking and converted their entire financial operations to Islamic practices and are currently devoid of conventional interest-based financial transactions.
The Islamic banking in Malaysia differs from Islamic banking in the Gulf and the rest of the world (Samad et al., 2005). The country’s first Islamic bank, Bank Islam Malaysia Berhad (BIMB), was established in July 1983. A decade later, the government introduced the Interest Free Banking Scheme, which made Malaysia among the first nations to have a full-fledged Islamic system operating side-by side with the conventional banking system(1).Under this framework, conventional banking institutions are allowed to provide Islamic banking services within their existing banking establishment known as the Islamic Banking Scheme (IBS). From only three banks offering Islamic financing in March 1993, the number of conventional banks that offered Islamic financing has increased to 17 (of which 4 are foreign banks).
Today, the Malaysia Islamic banking system is becoming an effective means of financial intermediation reflected by its extensive distribution networks comprising 152-full-fledged Islamic banking branches and more than 2,000 Islamic banking counters. The ability of the Islamic banking institutions to arrange and offer products with attractive and innovative features at prices that are competitive with conventional products, has appealed to both the Muslim and non-Muslim customers. This has spurred the efforts by other non- banking financial intermediaries such as the development financial institutions, savings institutions and housing credit institutions to introduce Islamic banking schemes and instruments to meet their customer demands.
Throughout the years, Islamic banking in Malaysia has gained significance, and has been on a progressive upward trend. Since 2000, the Islamic banking industry has been growing at an average rate of 19% per annum in terms of
(1) The first country to implement the dual banking system is United Arab Emirates (UAE) where the Dubai Islamic Bank was established in 1973 with a paid up capital of US$14 million (Metwally, 1997).
assets against the global growth rate of 15% (Rosly, 2005). As at end-2005, total assets of the Islamic banking sector has increased to RM111.8 billion, which accounted for 11.7% of the banking system’s total assets, while the market share of Islamic deposits and financing has increased to 11.7% and 12.1% of total banking sector deposits and financing respectively and is set to command a 20% market share by the year 2010 (Rosly, 2005; Hasan, 2004).
The rapid progress of the domestic Islamic banking system, accentuated by the significant expansion and developments in Islamic banking and finance has become increasingly more important in meeting the changing requirements of the new economy (Bank Negara Malaysia, 2004).
Over the years, while there has been extensive literature examining the efficiency of the conventional banking industries, empirical works on Islamic banks efficiency, particularly in Malaysia is still in its infancy. Typically, studies on Islamic banks have focused on theoretical issues, and empirical work has relied mainly on the analysis of descriptive statistics rather than rigorous statistical estimation (El-Gamal and Inanoglu, 2005). In addition, several studies that have been devoted to assess the performance of Islamic banks generally examined the relationship between profitability and banking characteristics (Bashir, 1999; Samad and Hassan, 2000; Bashir, 2001). The study therefore attempts to fill the gap in the literature by providing new empirical evidence on the relative operating performance of domestic and foreign conventional banks offering Islamic banking products and services by using a non-parametric frontier based Data Envelopment Analysis (DEA) approach. Although there is currently a few studies that have examined the performance of Islamic banks in Malaysia, we are not aware of any study that has analysed the efficiency of Malaysian Islamic banks employing a non- parametric DEA method.
Since its introduction by Charnes et al. (1978), researchers have welcomed Data Envelopment Analysis (DEA) as a methodology for performance evaluation (Gregoriou and Zhou, 2005). DEA has many advantages over traditional parametric techniques such as regression techniques. While regression analysis approximates the efficiency of banks under investigation relative to the average performance, DEA in contrast, focuses on the yearly observations of individual banks and optimises the performance measure of each bank. Constructing a separate frontier for each of the years under study is a critical issue in a dynamic business environment because a bank may be the most efficient in one year but may not be in the following year. In the Malaysian context, it becomes more important, as there is an ongoing liberalisation in the banking sector over the estimation period. A separate frontier will highlight any significant changes taking place in the sectors that are induced by Bank Negara Malaysia’s (BNM) supervisory policies.
As Malaysia is currently vying for recognition as the capital or hub of Islamic banking worldwide, the government has taken measures, to further liberalise the sector. The strategy is to create more competition, to tap new growth opportunities, and to raise the efficiency of the Islamic banking industry as a whole. The Malaysian government’s commitment is evidenced by the issuance of three more new full-fledged Islamic banks licenses to foreign banks from the Middle East namely, Kuwait Finance House, Al-Rajhi Banking and Investment Corporation and Al-Barakah Islamic Bank. Given the ongoing liberalisation in the sector, further investigations on the performance of the Islamic banking sector are thus warranted. The study in this nature could thus help the regulatory authorities and bank managers in determining the future course of action to be pursued to further strengthen the Islamic banking sector in Malaysia, particularly the domestic incorporated Islamic banks to meet the challenges of foreign banks entry from 2007 onwards(2). Nevertheless, the study also have important public policy implications, particularly with respect to the principal aim of the Malaysia’s Financial Sector Master Plan (FSMP), a long- term development plan charting the future direction of the financial services industry in Malaysia to achieve a more competitive, resilient and efficient financial system (BNM Financial Sector Master Plan, 2001).
In effect, the paper addresses five important issues relating to the efficiency of the Malaysian Islamic banking sector. First, what do data suggest regarding the convergence of performance/efficiency of Malaysian Islamic banks resulting from the increased competition brought by the further liberalisation of the banking sector? Second, does efficiency vary across ownership patterns? Third, does the banks’ capital position impinge upon efficiency? Fourth, how does efficiency correlate with profitability? Fifth, does the quality of banks’ assets affect their efficiency levels? The paper also examines how efficiency differs among peer groups. Furthermore, the paper explores the proximate sources of (in) efficiency under both univariate and multivariate framework and relates the findings to the ongoing liberalisation undertaken within the Malaysian Islamic banking sector.
This paper unfolds as follows. Section 2 provides an overview of the related studies in the literature, followed by a section that outlines the method used and choice of input and output variables for the efficiency model. Section 4 reports the empirical findings. Section 5 concludes and offers avenues for future research.
(2) As part of Malaysia’s World Trade Organisation (WTO) commitment to further liberalise the banking sector and to give the foreign banks completely open access to the Malaysian markets by the end of 2006.
2. Review of Related Literature
While there has been extensive literature examining the efficiency features of U.S. and European banking markets over recent years, the work on Islamic banking is still in its infancy. Typically, studies on Islamic bank efficiency have focused on theoretical issues and the empirical work has relied mainly on the analysis of descriptive statistics rather than rigorous statistical estimation (El- Gamal and Inanoglu, 2005). However, this is gradually changing as a number of recent studies have sought to apply the approaches outlined above to estimate bank efficiency using various frontier techniques.
El-Gamal and Inanoglu (2004) used the stochastic frontier approach to estimate the cost efficiency of Turkish banks over the period 1990-2000. The study compared the cost efficiencies of 49 conventional banks with four Islamic special finance houses (SFHs). The Islamic firms comprised around 3% of the Turkish banking market. Overall, they found that the Islamic financial institutions to be the most efficient and this was explained by their emphasis on Islamic asset-based financing which led to lower non-performing loans ratios. It is worth mentioning that the SFH achieved high levels of efficiency despite being subjected to branching and other self-imposed constraints such as the inability to hold government bonds.
El-Gamal and Inanoglu (2005) substantially extended their earlier study by providing an alternative method for evaluating bank efficiency scores. Again they examined the cost efficiency of Turkish banks throughout the 1990s. They distinguished between groups of banks that have different production technologies and found that the Islamic financial firms have different production technologies. They found that the Islamic financial firms have the same production technology as conventional banks (mainly domestic banks), and by using a standard stochastic cost frontier estimates, they showed that the Islamic firms are among the most efficient.
More recently, Hassan (2005) examined the relative cost, profit, X- efficiency, and productivity of the world Islamic Banking industry. Employing a panel of banks during 1993-2001, he used both the parametric (Stochastic Frontier Approach) and non-parametric (Data Envelopment Analysis) techniques as tools to examine the efficiency of the sample banks. He calculated five DEA efficiency measures namely cost, allocative, technical, pure technical, and scale and further correlated the scores with the conventional accounting measures of bank performance. He found that the Islamic banks are more profit efficient, with an average profit efficiency score of 84% under the profit efficiency frontier compared to 74% under the stochastic cost frontier. He also found that the main source of inefficiency is allocative rather than technical
inefficiency and the overall inefficiency was output related. The results also suggest that, on the average the Islamic banking industry is relatively less efficient compared to their conventional counterparts in other parts of the world.
The results also show that all five efficiency measures are highly correlated with ROA and ROE, suggesting that these efficiency measures can be used concurrently with the conventional accounting ratios in determining Islamic banks performance.
Hussein (2003) provides an analysis of the cost efficiency features of Islamic banks in Sudan between 1990 and 2000. Using the stochastic cost frontier approach, he estimates cost efficiency for a sample of 17 banks over the period.
The interesting contribution of this paper is that specific definitions of Islamic financial products are used as outputs. In addition, the analysis is also novel as Sudan has a banking system based entirely on Islamic banking principles. The results show large variations in the cost efficiency of Sudanese banks. He found that the foreign owned banks being the most efficient banks, while the state owned banks are the most cost inefficient. The analysis is extended to examine the determinants of bank efficiency. He found that smaller banks are more efficient that their larger counterparts. In addition, banks that have higher proportion of musharakah and mudarabah finance relative to total assets also have efficiency advantages. Overall, the substantial variability in efficiency estimates is put down to various factors, not least the highly volatile economic environment under which Sudanese banks have had to operate over the last decade or so.
While the above outlines the literature that uses advanced modelling techniques to evaluate bank efficiency, it is worth highlighting the growing body of literature that covers general performance features of Islamic banks.
Such studies include those by Hassan and Bashir (2003) who look at the determinants of Islamic bank performance and show Islamic banks to be just as efficient as conventional banks if one uses standard accounting measure such as cost-to-income ratios. Other studies that take a similar approach are those by Sarker (1999) who looks at the performance and operational efficiency of Bangladeshi Islamic banks, while Bashir (1999) examines the risk and profitability of two Sudanese banks. Overall, the general finding from this literature is that Islamic banks are at least as efficient as their conventional banking counterparts and in most cases are more efficient.
Despite the considerable development of Islamic banking sector, there are still limited studies focusing on the efficiency of Islamic banks, particularly the Malaysian Islamic banking industry. Several studies that have been devoted to assess the performance of Islamic banks have generally examined the
relationship between profitability and banking characteristics. Bashir (1999) and Bashir (2001) performed regression analyses to determine the underlying determinants of Islamic performance by employing bank level data in the Middle East. His results indicate that the performance of banks, in terms of profits, is mostly generated from overhead, customer short term funding, and non-interest earning assets. Furthermore, Bashir (2001) claimed that since deposits in Islamic banks are treated as shares, reserves held by banks propagate negative impacts such as reducing the amount of funds available for investment.
Samad and Hassan (2000) applied financial ratio analysis to investigate the performance of a Malaysian Islamic bank over the period 1984 -1997. Their results suggest that in general, the managements’ lack of knowledge was the main reason for slow growth of loans under profit sharing. Despite that, the bank was found to perform better compared to its conventional counterparts in terms of liquidity and risk measurement (lower risks).
3. Methodology 3.1 Data Envelopment Analysis
The present study employs the non-parametric frontier DEA approach to estimate the input-oriented technical efficiency of conventional banks offering Islamic banking products and services in Malaysia. This approach measures the efficiency of a decision-making unit (DMU) relative to other similar DMUs with the simple restriction that all DMUs lie on or below the efficiency frontier. The purpose of DEA is to empirically characterise the so-called efficient frontier (surface) based on the available set of DMUs and project all DMUs onto this frontier. If a DMU lies on the frontier, it is referred to as an efficient unit;
otherwise it is labelled as inefficient. The data are enveloped in such a way that radial distances to the frontier are minimised. In practice, efficiency scores are calculated by solving a linear programming problem (see Appendix A and B).
The analysis under DEA is concerned with understanding how each DMU is performing relative to others, the causes of inefficiency, and how a DMU can improve its performance to become efficient. In that sense, DEA calculates the relative efficiency of each DMU in relation to all other DMUs by using the actual observed values for the inputs and outputs of each DMU. It also identifies, for inefficient DMUs, the sources and level of inefficiency for each of the inputs and outputs. The DEA is carried out by assuming either constant returns to scale (CRS) or variable returns to scale (VRS). The estimation with these two assumptions allows the overall technical efficiency (TE) to be decomposed into two collectively exhaustive components: pure technical (PTE) and scale efficiency (SE) i.e. TE = PTE x SE. The former relates to the capability of managers to utilise firms’ given resources, whereas the latter refers
to exploiting scale economies by operating at a point where the production frontier exhibits constant returns to scale.
A useful feature of VRS models as compared to the CRS models is that it reports whether a decision-making unit (DMUs) is operating at increasing, constant or decreasing returns to scale. Constant returns to scale will apply when CRS and VRS efficiency frontiers are tangential with each other; in other words, when the slope of the efficiency frontier is equal to the ratio of inputs to outputs (Cooper et al., 2000). Increasing returns to scale must apply below that level, as the slope of the efficient frontier, which reflects the marginal rate of transformation of inputs to outputs) will be greater than the average rate of conversion. Likewise, decreasing returns to scale must apply above the zone in which constant returns to scale apply. DMUs not on the efficient frontier must first be projected onto the efficient frontier before their returns to scale status can be assessed.
Five useful features of DEA are: first, each DMU is assigned a single efficiency score, hence allowing ranking amongst the DMUs in the sample.
Second, it highlights the areas of improvement for each single DMU. For example, since a DMU is compared to a set of efficient DMUs with similar input-output configurations, the DMU in question is able to identify whether it has used input excessively or its output has been under-produced. Third, there is a possibility of making inferences on the DMUs general profile. We should be aware that the technique used here is a comparison between the production performances of each DMU to a set of efficient DMUs. The set of efficient DMUs is called the reference set. The owners of the DMUs may be interested to know which DMU frequently appears in this set. A DMU that appears more than others in this set is called the global leader. Clearly, this information gives huge benefits to the DMU owner, especially in positioning its entity in the market. Fourth, DEA does not require a preconceived structure or specific functional form to be imposed on the data in identifying and determining the efficient frontier, error and inefficiency structures of the DMUs(3) (Evanoff and Israelvich, 1991; Grifell-Tatje and Lovell, 1997; Bauer et al., 1998). Hababou (2002) adds that it is better to adopt the DEA technique when it has been shown that a commonly agreed functional form relating inputs to outputs is difficult to prove or find. Such specific functional form is truly difficult to show for financial services entities. Finally, Avkiran (1999) acknowledges the edge of DEA by stating that this technique allows the researchers to choose any kind of input and output of managerial interest, regardless of different measurement
(3) Hababou (2002) and Avkiran (1999) provide a relatively thorough discussion of the merits and limits of the DEA.
units. There is no need for standardisation(4). The main weakness of DEA is that it assumes data are free from measurement errors. Furthermore, since efficiency is measured in a relative way, its analysis is confined to the sample set used.
This means that an efficient DMU found in the analysis cannot be compared with other DMUs outside of the sample.
3.2 Multivariate Tobit Regression Analysis
It is also a considerable interest to explain the determinants of technical efficiency scores derived from the DEA models. As defined in equations (A1) and (A2) in the Appendix, the DEA score falls between the interval 0 and 1 (0<h*≤1) making the dependent variable a limited dependent variable. A commonly held view in previous studies is that the use of the Tobit model can handle the characteristics of the distribution of (in) efficiency measures and thus provide results that can provide important policy guidelines to improve performance. As the dependent variable efficiency score is bounded between 0 and 1, an appropriate theoretical specification is a Tobit model with two side censoring. However, firms with inefficiency score of 1 will never be observed in practice. Therefore, the results of the empirical analysis will not be different if one specifies a one or two side Tobit model. Accordingly, DEA inefficiency scores obtained in the first stage are used as a dependent variables in the second stage one side censored Tobit model in order to allow for the restricted [0, 1]
range of inefficiency values.
Coelli et al. (1998) have suggested several ways in which environmental variables can be accommodated in a DEA analysis. The term “environmental variables” is usually used to describe factors, which could influence the efficiency of a firm. In this case, such factors are not traditional inputs and are assumed to be outside the control of the manager. Hence, the two-stage method used in this essay involves the solution of DEA problem in the first stage analysis, which comprises mainly the traditional outputs and inputs. In the second stage, the efficiency scores obtained from the first stage analysis are regressed on the environmental variables.
The standard Tobit model can be defined as follows for observation (bank)i:
i i
i x
y* =β' +ε (1)
i*
i y
y = if yi* ≥0 and 0
i =
y , otherwise
(4) An additional advantage according to Canhoto and Dermine (2003) is that the DEA technique is preferred to parametric methods is when the sample size is small.
where εi ~N(0 ,σ2) , xi and β are vectors of explanatory variables and unknown parameters, respectively, while
i*
y is a latent variable and yi is the DEA score5.
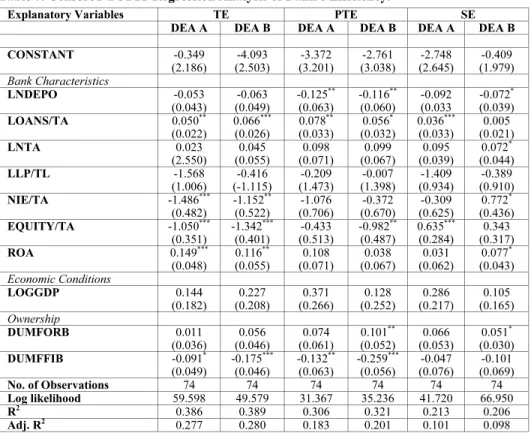
Using the efficiency scores as the dependent variable, we estimate the following regression model:
Θjt = β0 + β1LNDEPOjt + β2LOANS/TAjt + β3LNTAjt + β4LLP/TLjt
+ β5NIE/TAjt + β6EQUITY/TAjt+ β7ROAjt+ β8LOGGDP + β9DUMFORBjt + β10DUMFFIBjt+ εj
where, Θjt is the technical, pure technical and scale efficiency of the jth bank in period t obtained from DEA Model A and DEA Model B, LNDEPOjt is a natural logarithm of total deposits of bank j in period t; LOANS/TAjt is total loans to total assets of bank j in period t; LNTAjt is natural logarithm of total assets of bank j in period t; LLP/TLjt is total loan loss provisions divided by total loans of bank j in period t; NIE/TAjt is total non-interest expenses divided by total assets of bank j in period t; EQUITY/TAjt is total shareholders equity divided by total assets of bank j in period t; ROAjt is profit after tax divided by total assets of bank j in period t; LOGGDP is natural logarithm of gross domestic product; DUMFORBjt and DUMFFIBjt are dummy variables indicating the ownership of the jth bank in period t (equal to 1 if a bank is a foreign bank and full-fledged Islamic bank respectively, 0 otherwise).
3.3 Specifications of Bank Inputs, Outputs and Data
The definition and measurement of inputs and outputs in the banking function remains a contentious issue among researchers. Banks are typically multi-input and multi-output firms. As a result, defining what constitutes ‘input’
and ‘output’ is fraught with difficulties, since many of the financial services are jointly produced and prices are typically assigned to a bundle of financial services. Additionally, banks may not be homogeneous with respect to the types of outputs actually produced. To determine what constitutes inputs and outputs of banks, one should first decide on the nature of banking technology. In the banking theory literature, there are two main approaches competing with each
(5) The likelihood function (L) is maximised to solve β and σbased on 74 observations (banks) of yi andxiis
2
2)]( )
2 /(
1 [
0 0(2 2)1/2
) 1 1
( i i
i i
x y
y y
e F
L σ β
σ
−
−
= >
Π ×
−
=∏ ∏
where,
dt e
Fi x t
i / /2
2 / 1
2
) 2 (
1 −
∞
∫− Π
= β σ
The first product is over the observations for which the banks are 100 percent efficient (y = 0) and the second product is over the observations for which banks are inefficient (y >0). Fi is the distribution function of the standard normal evaluated at β'xi/σ.
other in this regard: the production and intermediation approaches (Sealey and Lindley, 1977).
Under the production approach, a financial institution is defined as a producer of services for account holders, that is, they perform transactions on deposit accounts and process documents such as loans. Hence, according to this approach, the number of accounts or its related transactions is the best measures for output, while the number of employees and physical capital is considered as inputs. Previous studies that adopted this approach are among others by Sherman and Gold (1985), Ferrier and Lovell (1990) and Fried et al. (1993).
The intermediation approach on the other hand assumes that financial firms act as an intermediary between savers and borrowers and posits total loans and securities as outputs, whereas deposits along with labour and physical capital are defined as inputs. Previous banking efficiency studies research that adopted this approach are, among others, Charnes et al. (1990), Bhattacharya et al.
(1997) and Sathye (2001).
For the purpose of this study, a variation of the intermediation approach or asset approach originally developed by Sealey and Lindley (1977) will be adopted in the definition of inputs and outputs used(6). According to Berger and Humphrey (1997), the production approach might be more suitable for branch efficiency studies, as at most times bank branches basically process customer documents and bank funding, while investment decisions are not mostly under the control of branches.
The aim in the choice of variables for this study is to provide a parsimonious model and to avoid the use of unnecessary variables that may reduce the degree of freedom(7). All variables are measured in billion of Malaysian Ringgit (MYR). Given the sensitivity of efficiency estimates to the specification of outputs and inputs, we have estimated two alternative models.
Malaysian Islamic banks are regarded as an intermediary between savers and borrowers in DEA Model A, producing two outputs namely, Total Loans (y1), which include loans to customers and other banks and Investments (y2), which include investment securities held for trading, investment securities available for sale (AFS) and investment securities held to maturity by employing two inputs, namely, Total Deposits (x1), which include deposits from customers and other banks, and Total Assets (x2). To examine the productive efficiency of
(6) Humphrey (1985) presents an extended discussion of the alternative approaches over what a bank produces.
(7) For a detailed discussion on the optimal number of inputs and outputs in DEA, see Avkiran (2002) .
labour in the Malaysian Islamic banking industry, Labour (x3), inclusive of total expenditures on employees such as salaries, employee benefits and reserve for retirement pay is included as an input variable in DEA Model B. Accordingly, Malaysian Islamic banks are regarded to employ Total Assets (x2) and Labour (x3) to produce Total Loans (y1) and Investments (y2)(8).
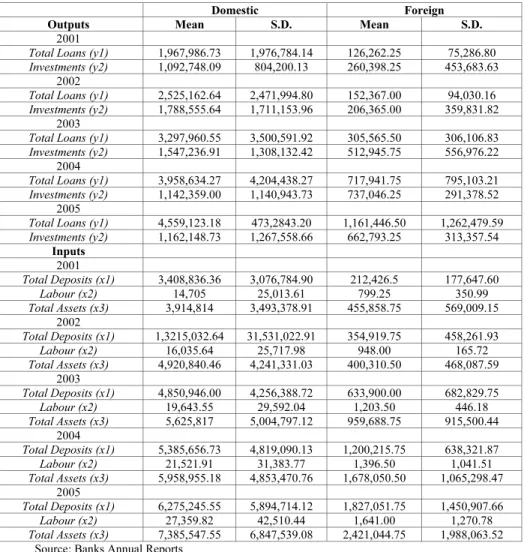
Table (1) presents summary statistics of the output and input variables used in the DEA models, measured in billions of Malaysian Ringgit (RM). It is apparent that during the period of study, there has been increasing preference among the Malaysian public for Islamic banking and finance products and services substantiated by the growth in total loans (financing) to the domestic economy. During the years (2001-2005), total loans and deposits grew by 132%
and 84% respectively for the domestic banks, while the rate is significantly higher for the foreign banks, which recorded more than eightfold increase in total loans and sevenfold increase in total loans. It is clear from Table (1), that the Malaysian Islamic banking and finance industry has created significant employment opportunities during this period witnessed by the more than 100%
increase in personnel expenses during the five-year study period. As a result of the growing demand for Islamic financial services, the total assets of the Malaysian Islamic banks have significantly expanded during the period. In 2001, the average domestic banks held RM1,092 billion in total assets, before increasing to RM7,385 billion in 2005. Likewise, the average foreign banks held RM454 billion in total assets during 2001, before increasing to RM1,988 billion in 2005. Similar expansions were also observed in the proportion of banks assets held in investments.
Several bank and industry specific attributes may influence a particular bank’s efficiency level. Some of these factors may neither be inputs nor outputs in the production process, but rather circumstances faced by a particular bank.
The independent variables are grouped under three main characteristics. Banks Structure represents firm-specific attributes, Economic Conditions encompass market conditions in effect over the period examined, and Ownership examines the relationship between bank’s ownership and efficiency. Banks Structure can further be divided into two other characteristics namely, Banks Market Structure and Banks Risk Structure and Capitalisation.
(8) As data on the number of employees is not readily made available, personnel expenses have been used as a proxy.
Table 1. Summary Statistics of the Variables Employed in the DEA Models (in billion of Ringgit).
Domestic Foreign
Outputs Mean S.D. Mean S.D.
2001
Total Loans (y1) 1,967,986.73 1,976,784.14 126,262.25 75,286.80 Investments (y2) 1,092,748.09 804,200.13 260,398.25 453,683.63
2002
Total Loans (y1) 2,525,162.64 2,471,994.80 152,367.00 94,030.16 Investments (y2) 1,788,555.64 1,711,153.96 206,365.00 359,831.82
2003
Total Loans (y1) 3,297,960.55 3,500,591.92 305,565.50 306,106.83 Investments (y2) 1,547,236.91 1,308,132.42 512,945.75 556,976.22
2004
Total Loans (y1) 3,958,634.27 4,204,438.27 717,941.75 795,103.21 Investments (y2) 1,142,359.00 1,140,943.73 737,046.25 291,378.52
2005
Total Loans (y1) 4,559,123.18 473,2843.20 1,161,446.50 1,262,479.59 Investments (y2) 1,162,148.73 1,267,558.66 662,793.25 313,357.54
Inputs
2001
Total Deposits (x1) 3,408,836.36 3,076,784.90 212,426.5 177,647.60
Labour (x2) 14,705 25,013.61 799.25 350.99
Total Assets (x3) 3,914,814 3,493,378.91 455,858.75 569,009.15 2002
Total Deposits (x1) 1,3215,032.64 31,531,022.91 354,919.75 458,261.93
Labour (x2) 16,035.64 25,717.98 948.00 165.72
Total Assets (x3) 4,920,840.46 4,241,331.03 400,310.50 468,087.59 2003
Total Deposits (x1) 4,850,946.00 4,256,388.72 633,900.00 682,829.75
Labour (x2) 19,643.55 29,592.04 1,203.50 446.18
Total Assets (x3) 5,625,817 5,004,797.12 959,688.75 915,500.44 2004
Total Deposits (x1) 5,385,656.73 4,819,090.13 1,200,215.75 638,321.87
Labour (x2) 21,521.91 31,383.77 1,396.50 1,041.51
Total Assets (x3) 5,958,955.18 4,853,470.76 1,678,050.50 1,065,298.47 2005
Total Deposits (x1) 6,275,245.55 5,894,714.12 1,827,051.75 1,450,907.66
Labour (x2) 27,359.82 42,510.44 1,641.00 1,270.78
Total Assets (x3) 7,385,547.55 6,847,539.08 2,421,044.75 1,988,063.52 Source: Banks Annual Reports
Under Banks Market Structure three independent variables are examined namely, LNDEPO (log of total deposits) as a proxy of market share, LNTA (log of total assets) as a proxy of size to capture the possible cost advantages associated with size (economies of scale). In the efficiency literature, the relationship between size and efficiency has been mixed and in some cases a U- shaped relationship is observed. LNTA is also used to control for cost differences related to bank size and for the greater ability of larger banks to diversify. In essence, LNTA may lead to positive effects on bank efficiency if there are significant economies of scale. On the other hand, if increased diversification leads to higher risks, the variable may have negative effects.
The ratio of overhead expenses to total assets, NIE/TA, is used to provide information on variation in operating costs across the banking system. It reflects employment, total amount of wages and salaries as well as the cost of running branch office facilities. A high NIE/TA ratio is expected to impact performance negatively because efficient banks are expected to operate at lower costs. On the other hand, the usage of new electronic technology, like ATMs and other automated means of delivering services, has caused the wage expenses to fall (as capital is substituted for labour). Therefore, a lower NIE/TA ratio may impact performance positively.
Under Banks Risk Structure we have also examined three independent variables namely, LOANS/TA (total loans divided by total assets) as a proxy of lending intensity, LLP/TL (loan loss provisions divided by total loans) is used as a proxy measure for risk and EQUITY/TA (book value of stockholders equity divided by total assets). Bank loans are expected to be the main source of revenue and are expected to impact profits positively. However, since most of the Islamic banks’ loans are in the form of profit and loss sharing (loans with equity features), the loan-performance relationship depends significantly on the expected change of the economy. During a strong economy, only a small percentage of the profit and loss sharing loans will default, and the bank’s profit will rise. On the other hand, the bank could be severely damaged during a weak economy, because borrowers are likely to default on their loans. Ideally, banks should capitalise on favourable economic conditions and insulate themselves during adverse conditions.
The coefficient of LLP/TL is expected to be negative because bad loans reduce profitability and efficiency. EQUITY/TA is included in the model because, as noted, domestic and foreign banks may use different degrees of leverage. Furthermore, lower capital ratios in banking imply higher leverage and risk, and therefore greater borrowing costs. Berger and Mester (1997) have pointed out that, it is an important control variable used to account for differences in risk among banking institutions(9). We expect EQUITY/TA to have a negative coefficient because an increase in equity is a reduction in leverage, which reduces return on equity.
We have included Economic Conditions variables to capture the association between economic growths on Malaysian Islamic banks’ efficiency. The LOGGDP independent variable represents the growth rate of the country’s gross domestic product and is used as a proxy for economic conditions. Favourable economic conditions will affect positively on the demand and supply of banking services, but will either impact positively or negatively on bank efficiency.
(9) See Berger and Mester (1997) for a detailed discussion of this point.
Agency issues associated with different types of firm ownership are an area of concern in many banking systems. In an attempt to examine the association between corporate governance and Malaysian Islamic banks efficiency, we have included two ownership variables, namely DUMFORB (dummy variable that takes a value of 1 if a bank is a foreign bank, 0 otherwise) and DUMFFIB (dummy variable that takes a value of 1 if a bank is a full fledged Islamic bank, 0 otherwise). The ownership variable DUMFORB is expected to have a negative association with inefficiency i.e. foreign banks is expected to exhibit higher efficiency levels, while the dummy variable DUMFFIB may have positive or negative impacts on banks’ efficiency levels.
4. Empirical Findings
In this section, we will discuss the technical efficiency change (TE) of the Malaysian Islamic banking sector, measured by the Data Envelopment Analysis (DEA) method and its decomposition into pure technical efficiency (PTE) and scale efficiency (SE) components. In the event of the existence of scale inefficiency, we will attempt to provide evidence on the nature of returns to scale of the Malaysian Islamic banks. The efficiency of Malaysian Islamic banks was first examined by applying the DEA method for each year under investigation. To substantiate the results under the DEA approach, a multivariate regression framework is employed to relate bank level efficiency scores to bank characteristics.
4.1 Efficiency of the Malaysian Islamic Banking Sector
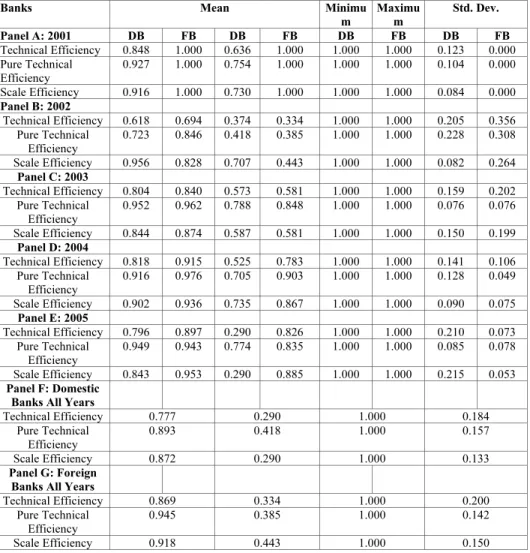
Table 2 presents mean efficiency scores of Malaysian Islamic banks for the years 2001 (Panel A), 2002 (Panel B), 2003 (Panel C), 2004 (Panel D), 2005 (Panel E), Domestic Banks (Panel F) and Foreign Banks (Panel G). The results from DEA Model A seem to suggest that Malaysian Islamic banks mean technical efficiency has been on a declining trend during the earlier part of the studies, increasing during the latter years, before declining again in the final year under observation. The decomposition of technical efficiency into its exhaustive components of pure technical and scale efficiency suggest that scale inefficiency dominates pure technical inefficiency of the Malaysian Islamic banks during all years except for the year 2002 in the case of the domestic banks and the year 2005 in the case of the foreign banks. Overall the results seem to imply that Malaysian Islamic banks have been inefficient in exploiting the economies of scale given their scale of operations.
Table 2. Summary Statistics of Efficiency Scores – DEA Model A.
Banks Mean Minimu
m
Maximu m
Std. Dev.
Panel A: 2001 DB FB DB FB DB FB DB FB
Technical Efficiency 0.848 1.000 0.636 1.000 1.000 1.000 0.123 0.000 Pure Technical
Efficiency
0.927 1.000 0.754 1.000 1.000 1.000 0.104 0.000 Scale Efficiency 0.916 1.000 0.730 1.000 1.000 1.000 0.084 0.000 Panel B: 2002
Technical Efficiency 0.618 0.694 0.374 0.334 1.000 1.000 0.205 0.356 Pure Technical
Efficiency
0.723 0.846 0.418 0.385 1.000 1.000 0.228 0.308 Scale Efficiency 0.956 0.828 0.707 0.443 1.000 1.000 0.082 0.264
Panel C: 2003
Technical Efficiency 0.804 0.840 0.573 0.581 1.000 1.000 0.159 0.202 Pure Technical
Efficiency
0.952 0.962 0.788 0.848 1.000 1.000 0.076 0.076 Scale Efficiency 0.844 0.874 0.587 0.581 1.000 1.000 0.150 0.199
Panel D: 2004
Technical Efficiency 0.818 0.915 0.525 0.783 1.000 1.000 0.141 0.106 Pure Technical
Efficiency
0.916 0.976 0.705 0.903 1.000 1.000 0.128 0.049 Scale Efficiency 0.902 0.936 0.735 0.867 1.000 1.000 0.090 0.075
Panel E: 2005
Technical Efficiency 0.796 0.897 0.290 0.826 1.000 1.000 0.210 0.073 Pure Technical
Efficiency
0.949 0.943 0.774 0.835 1.000 1.000 0.085 0.078 Scale Efficiency 0.843 0.953 0.290 0.885 1.000 1.000 0.215 0.053 Panel F: Domestic
Banks All Years
Technical Efficiency 0.777 0.290 1.000 0.184
Pure Technical Efficiency
0.893 0.418 1.000 0.157
Scale Efficiency 0.872 0.290 1.000 0.133
Panel G: Foreign Banks All Years
Technical Efficiency 0.869 0.334 1.000 0.200
Pure Technical Efficiency
0.945 0.385 1.000 0.142
Scale Efficiency 0.918 0.443 1.000 0.150
The Table presents descriptive statistics for 74 Malaysian Islamic banks technical efficiency (TE) scores and its mutually exhaustive components of pure technical efficiency (PTE) and scale efficiency (SE) observations. Panel A, B, C, D, and E shows the mean, minimum, maximum and standard deviation of TE, PTE and SE derived from DEA Model A for the years 2001, 2002, 2003, 2004 and 2005, respectively. Panel F and G presents the domestic and foreign Islamic banks mean, minimum, maximum and standard deviation of TE, PTE and SE scores, respectively. The TE, PTE and SE scores are bounded between 0 and 1.
During the period of study, the results seem to suggest that the domestic Malaysian Islamic banks (Panel F) have exhibited mean technical efficiency of 77.7%, suggesting mean input waste of 22.3%. In other words, the domestic banks could have produced the same amount of outputs by only using 77.7% of the amount of inputs it uses. From Table 2 (Panel F) it is also clear that scale inefficiency dominates pure technical inefficiency of the domestic Malaysian Islamic banks. On the other hand, the results from Table 2 (Panel G) suggest that foreign banks that offered Islamic banking services in Malaysia have exhibited higher mean technical efficiency of 86.9% compared to its domestic counterparts. Likewise, the results also suggest that the foreign banks inefficiency were mainly attributed to scale rather than pure technical albeit at a lower degree of 8.1% (domestic banks 12.8%). Overall the findings suggest that foreign banks were more managerially efficient in controlling their costs and have been operating at a relatively more optimal scale of operations compared to their domestic peers.
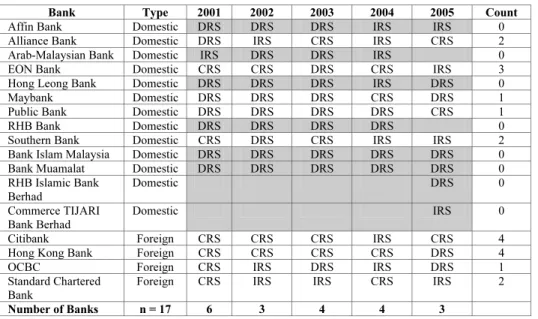
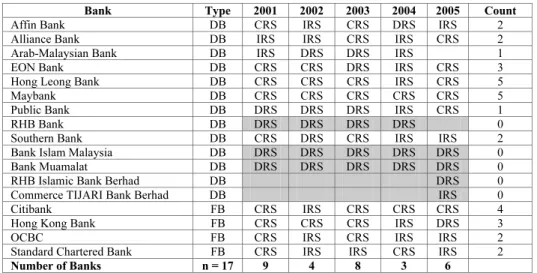
Table 3. Composition of Production Frontiers – DEA Model A.
Bank Type 2001 2002 2003 2004 2005 Count Affin Bank Domestic DRS DRS DRS IRS IRS 0 Alliance Bank Domestic DRS IRS CRS IRS CRS 2 Arab-Malaysian Bank Domestic IRS DRS DRS IRS 0 EON Bank Domestic CRS CRS DRS CRS IRS 3
Hong Leong Bank Domestic DRS DRS DRS IRS DRS 0
Maybank Domestic DRS DRS DRS CRS DRS 1
Public Bank Domestic DRS DRS DRS DRS CRS 1
RHB Bank Domestic DRS DRS DRS DRS 0
Southern Bank Domestic CRS DRS CRS IRS IRS 2 Bank Islam Malaysia Domestic DRS DRS DRS DRS DRS 0 Bank Muamalat Domestic DRS DRS DRS DRS DRS 0 RHB Islamic Bank
Berhad
Domestic DRS 0
Commerce TIJARI Bank Berhad
Domestic IRS 0
Citibank Foreign CRS CRS CRS IRS CRS 4
Hong Kong Bank Foreign CRS CRS CRS CRS DRS 4
OCBC Foreign CRS IRS DRS IRS DRS 1
Standard Chartered Bank
Foreign CRS IRS IRS CRS IRS 2 Number of Banks n = 17 6 3 4 4 3
The Table shows the evolution of returns to scale in the Malaysian Islamic banking sector during the period 2001-2005 derived from DEA Model A. CRS, DRS and IRS denote constant returns to scale, decreasing returns to scale and increasing returns to scale respectively. DB indicates domestic banks; FB indicates foreign banks. Count denotes the number of times a bank appeared on the efficiency frontier during the period of study. The banks corresponding to the shaded regions have not been efficient in any year in the sample period compared to the other banks in the sample.
Since the dominant source of total technical (in) efficiency in the Malaysian Islamic banking seems to be scale related, it is worth further examining the trend in the returns to scale of the Malaysian Islamic banks. Table 3 shows the composition of banks that lie on the efficiency frontier under DEA Model A.
The composition of the efficiency frontier for DEA Model A suggests that the number of banks that span the efficiency frontier varies between three to six banks. During the period of study, foreign banks seem to have dominated the efficiency frontier under DEA Model A. It is also apparent from Table 3 that, all foreign banks have appeared at least once on the frontier. It is also clear from the results that, two foreign banks namely, Citibank and HSBC are the global leaders i.e. appeared the most times on the efficiency frontier. On the other hand, the results seem to suggest that only two domestic banks have managed to appear on the frontier, while eight have never made it to the efficiency frontier throughout the period of study.
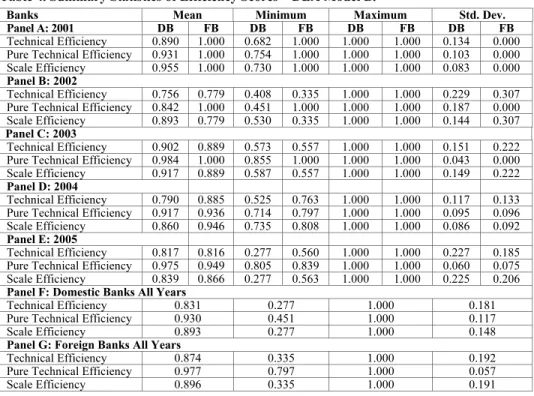
Table (4) presents the results derived from DEA Model B. The results from DEA Model B seem to suggest that Malaysian Islamic banks mean technical efficiency has been on a declining trend during the earlier part of the studies, increasing during the latter part of the study, before declining again in the latter years. The decomposition of technical efficiency into its exhaustive components of pure technical and scale efficiency suggest that pure technical inefficiency dominates domestic Malaysian Islamic banks scale inefficiency during the earlier years. The trend however changed during the latter part of the studies when domestic Malaysian Islamic banks have exhibited higher pure technical efficiency. The foreign banks on the other hand were managerially efficient during all years except for the year 2004, when scale efficiency was higher.
The composition of the efficiency frontier and the nature of the returns to scale in the Malaysian Islamic banking sector are discussed next. Table 5 presents the results of the nature of returns to scale in Malaysian Islamic banking sector derived from DEA Model B. The composition of the efficiency frontier for DEA Model B suggest that the number of banks operating at CRS has almost doubled to between three and nine banks. Unlike the results from DEA Model A, two domestic banks took over as the global leaders from their foreign counterparts by appearing most times on the efficiency frontier.
Likewise, the number of domestic banks that failed to appear on the frontier declined to only five under DEA Model B.It is also interesting to note that all foreign banks have managed to appear at least once on the frontier.
Table 4. Summary Statistics of Efficiency Scores – DEA Model B.
Banks Mean Minimum Maximum Std. Dev.
Panel A: 2001 DB FB DB FB DB FB DB FB Technical Efficiency 0.890 1.000 0.682 1.000 1.000 1.000 0.134 0.000 Pure Technical Efficiency 0.931 1.000 0.754 1.000 1.000 1.000 0.103 0.000 Scale Efficiency 0.955 1.000 0.730 1.000 1.000 1.000 0.083 0.000 Panel B: 2002
Technical Efficiency 0.756 0.779 0.408 0.335 1.000 1.000 0.229 0.307 Pure Technical Efficiency 0.842 1.000 0.451 1.000 1.000 1.000 0.187 0.000 Scale Efficiency 0.893 0.779 0.530 0.335 1.000 1.000 0.144 0.307 Panel C: 2003
Technical Efficiency 0.902 0.889 0.573 0.557 1.000 1.000 0.151 0.222 Pure Technical Efficiency 0.984 1.000 0.855 1.000 1.000 1.000 0.043 0.000 Scale Efficiency 0.917 0.889 0.587 0.557 1.000 1.000 0.149 0.222 Panel D: 2004
Technical Efficiency 0.790 0.885 0.525 0.763 1.000 1.000 0.117 0.133 Pure Technical Efficiency 0.917 0.936 0.714 0.797 1.000 1.000 0.095 0.096 Scale Efficiency 0.860 0.946 0.735 0.808 1.000 1.000 0.086 0.092 Panel E: 2005
Technical Efficiency 0.817 0.816 0.277 0.560 1.000 1.000 0.227 0.185 Pure Technical Efficiency 0.975 0.949 0.805 0.839 1.000 1.000 0.060 0.075 Scale Efficiency 0.839 0.866 0.277 0.563 1.000 1.000 0.225 0.206 Panel F: Domestic Banks All Years
Technical Efficiency 0.831 0.277 1.000 0.181 Pure Technical Efficiency 0.930 0.451 1.000 0.117
Scale Efficiency 0.893 0.277 1.000 0.148
Panel G: Foreign Banks All Years
Technical Efficiency 0.874 0.335 1.000 0.192 Pure Technical Efficiency 0.977 0.797 1.000 0.057
Scale Efficiency 0.896 0.335 1.000 0.191
The Table presents descriptive statistics for 74 Malaysian Islamic banks technical efficiency (TE) scores and its mutually exhaustive components of pure technical efficiency (PTE) and scale efficiency (SE) observations. Panel A, B, C, D, and E shows the mean, minimum, maximum and standard deviation of TE, PTE and SE derived from DEA Model A for the years 2001, 2002, 2003, 2004 and 2005, respectively. Panel F and G presents the domestic and foreign Islamic banks mean, minimum, maximum and standard deviation of TE, PTE and SE scores, respectively. The TE, PTE and SE scores are bounded between 0 and 1.
It is worth highlighting the differences in the results obtained from the two DEA models. Under DEA Model A, when Total Deposits and Total Assets are used as input vectors, the efficiency gap between the domestic and foreign banks seems large at 9.2%. Despite using the same output vectors, when Labour and Total Assets are used as input vectors under DEA Model B, the efficiency gap between domestic and foreign banks converged to only 4.3%. The results clearly suggest that DEA analysis is sensitive to the choice of variables.
Nevertheless, this is also the strength of the technique as it provides management with specific information on where to start improving the efficiency of DMUs under scrutiny (Avkiran, 1999). It allows efficiency measurement from various perspectives depending on the decision-making requirements. For instance, if management is interested in the contribution of labour to a particular set of outputs, personnel expenses or staff numbers become an input variable.
Table 5. Composition of Production Frontiers – DEA Model B.
Bank Type 2001 2002 2003 2004 2005 Count Affin Bank DB CRS IRS CRS DRS IRS 2
Alliance Bank DB IRS IRS CRS IRS CRS 2
Arab-Malaysian Bank DB IRS DRS DRS IRS 1
EON Bank DB CRS CRS DRS IRS CRS 3
Hong Leong Bank DB CRS CRS CRS IRS CRS 5
Maybank DB CRS CRS CRS CRS CRS 5
Public Bank DB DRS DRS DRS IRS CRS 1
RHB Bank DB DRS DRS DRS DRS 0
Southern Bank DB CRS DRS CRS IRS IRS 2 Bank Islam Malaysia DB DRS DRS DRS DRS DRS 0 Bank Muamalat DB DRS DRS DRS DRS DRS 0
RHB Islamic Bank Berhad DB DRS 0
Commerce TIJARI Bank Berhad DB IRS 0
Citibank FB CRS IRS CRS CRS CRS 4
Hong Kong Bank FB CRS CRS CRS IRS DRS 3
OCBC FB CRS IRS CRS IRS IRS 2
Standard Chartered Bank FB CRS IRS IRS CRS IRS 2 Number of Banks n = 17 9 4 8 3 6
The Table shows the evolution of returns to scale in the Malaysian Islamic banking sector during the period 2001-2005 derived from DEA Model B. CRS, DRS and IRS denote constant returns to scale, decreasing returns to scale and increasing returns to scale respectively. DB indicates domestic banks; FB indicates foreign banks. Count denotes the number of times a bank appeared on the efficiency frontier during the period of study. The banks corresponds to the shaded regions have not been efficient in any year in the sample period compared to the other banks in the sample.
Overall, the results from both the DEA models seems to suggest that in the case of Malaysian Islamic banks, technical inefficiencies have much more to do with the scale of production rather than the inefficient utilisation of resources.
The dominant effect of the scale inefficiency indicates that most of the Malaysian Islamic banks operate at this ‘incorrect’ scale. They either experience economies of scale (i.e. increasing returns to scale (IRS)) due to being at less than optimum size or diseconomies of scale (i.e. decreasing returns to scale (DRS)) due to being at more than the optimum size. Thus, decreasing or increasing the scale of production could result in cost savings or efficiencies.
The scale inefficiency due to IRS might be attributed to small banks, whereas, the scale inefficiency due to DRS might be related to large banks (Miller and Noulas, 1996; Noulas et al., 1990).
The composition of the efficiency frontier for both the DEA models shows that the majority of Malaysian Islamic banks, particularly the domestic ones, have experienced diseconomies of scale (DRS), ranging from 27% to 60% for DEA Model A, and 27% to 40% for DEA Model B, suggesting the extra
production costs faced by rapidly growing Malaysian banks. The results seem to suggest that the share of scale efficient banks i.e. operating at CRS has declined from 40% in 2001 to 20% in 2005 for DEA Model A and from 60% in 2001 to 40% in 2005 for DEA Model B, signalling worsening scale efficiency over time. On the other hand, the share of the banks experiencing economies of scale i.e. operating at IRS rose from 7% in 2001 to 47% in 2004, before declining again to 33% in 2005 for DEA Model A. Likewise, the share of the banks experiencing economies of scale rose from 13% in 2001 to 53% in 2004, before declining again to 33% in 2005 for DEA Model B.
4.2 Univariate Test Results
Assessing the domestic and foreign banks efficiency under a common frontier may be biased, given that foreign banks could have quite different goals from domestic banks, as they may be inclined to trade-off between efficiency and market share in order to penetrate a local market (Isik and Hassan, 2002).
Further, foreign banks may have relied heavily on purchased funds in the inter- bank market, which is costlier. Alternatively, foreign banks might possess some distinct advantages, stemming mainly from their asset portfolios. Relative to domestic banks, foreign banks’ asset portfolios are more skewed to investment securities, whose administrative and transactional costs are much lower than loans. Also, lack of exposure in a lesser-known market may manifest itself in the form of extra information gathering costs for clients.
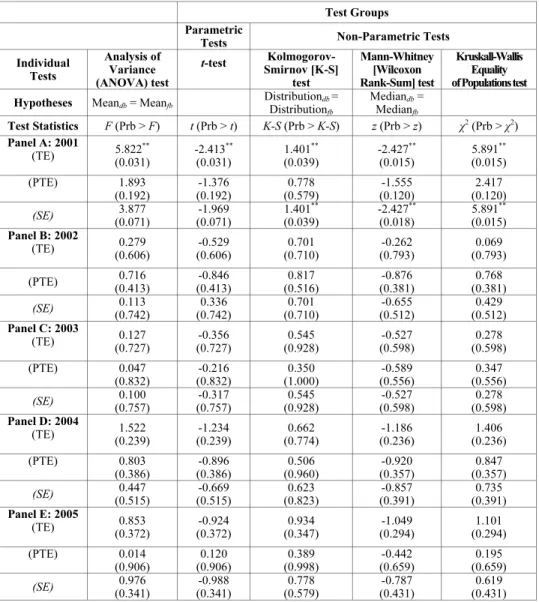
Following the procedures outlined in Aly et al. (1990), Elyasiani and Mehdian (1992) and Isik and Hassan (2002) among others, the null hypothesis of identical frontiers between the foreign and domestic banks efficiency for each year under study is tested. The hypothesis is tested using a series of parametric (ANOVA and t-test) and non-parametric (Kolmogorov-Smirnov and Mann-Whitney [Wilcoxon Rank-Sum]) tests. Overall, both the parametric and non-parametric test statistics given in Table 6 failed to reject the null hypothesis at the 5% levels of significance that the domestic and foreign banks came from the same population and have identical technologies(10,11). This implies that, there is no significant difference between the domestic and foreign banks technologies (frontiers). The results imply that we could assume the variances among the domestic and foreign banks to be equal and it is appropriate to construct production frontiers by pooling data on domestic and foreign banks.
(10) With the exception of TE which is significant at the 5% level in year 2001, while SE is significant at the 5% level for all the non-parametric tests during the same year.
(11) The results from DEA Model B are not altered in any significant way in terms of the signs, magnitude, and statistical significance and are therefore not reported here.