To the best of our knowledge, the topic has not been adequately explored in the context of the OIC member countries.1 In addition, the OIC market is worth studying due to the emergence of. From an economic point of view, the majority of OIC countries belong to the underdeveloped and poor country groups. In addition to this unabated debate on the link between finance and growth, the global trend towards bank consolidation brings to light another important dimension of the relationship between the banking sector and economic growth, namely the relationship between bank market concentration and bank performance.
To do this we will use a variant of the models developed by Berger et al. CONi,t represents the concentration measure of country i at time t as measured by one of the concentration measures. In general, the GMM requires a certain number of moment conditions that are functions of the model parameters and the data to be specified for the model.
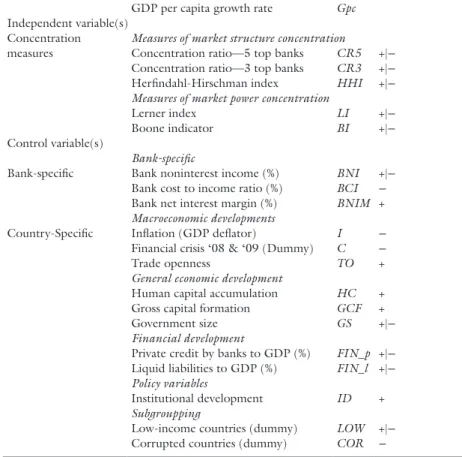
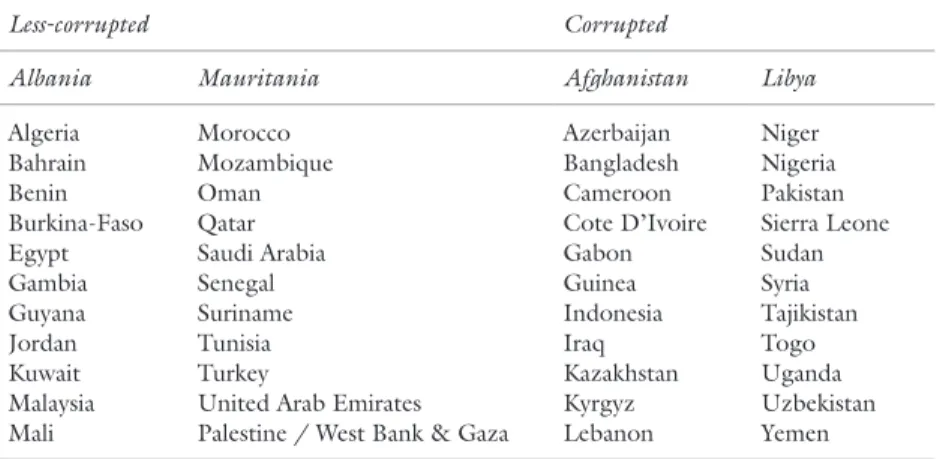
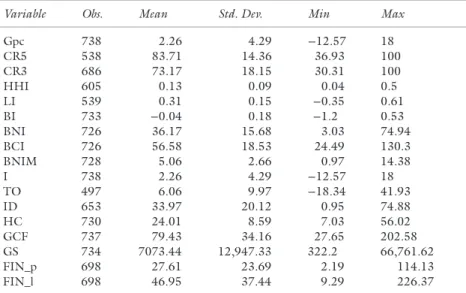
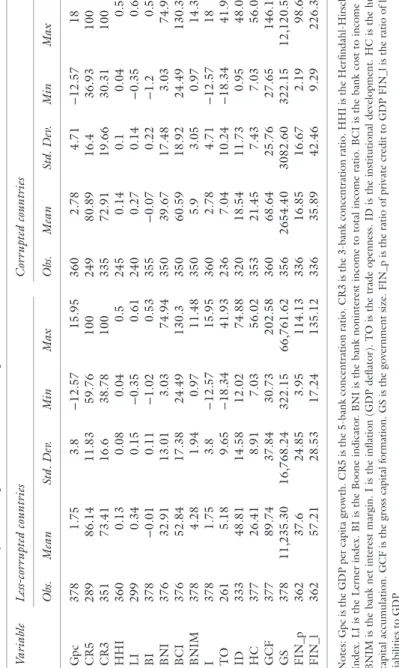
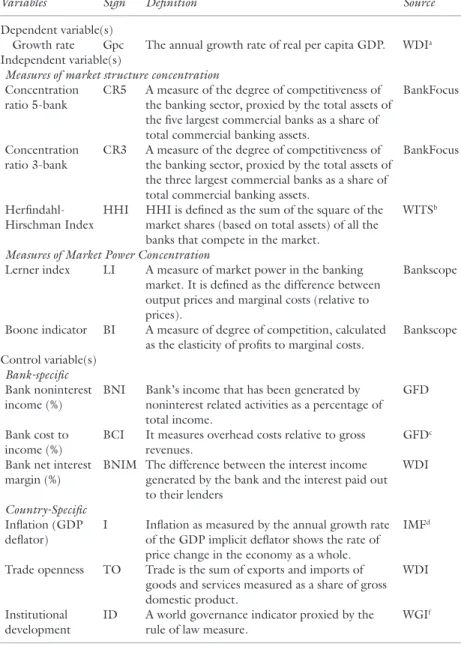
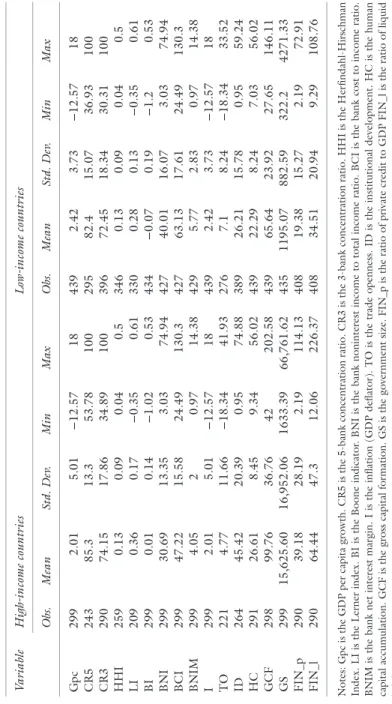
Public size GS The size of the state is measured by the ratio between the state's consumption expenditure and GDP. We then use a median value of the sample to divide the data into two groups, corrupt and less corrupt countries. Similar to the CR5 case, the highest concentration point and thus the highest concentration was recorded by a number of the OIC member countries.18 It can therefore be concluded from the available data that the banking sector in the OIC countries is highly concentrated and quite far from competition .
The presence of overwhelming banking concentration within OIC member countries should come as no surprise, as the overall underdevelopment is also reflected in a number of indicators.
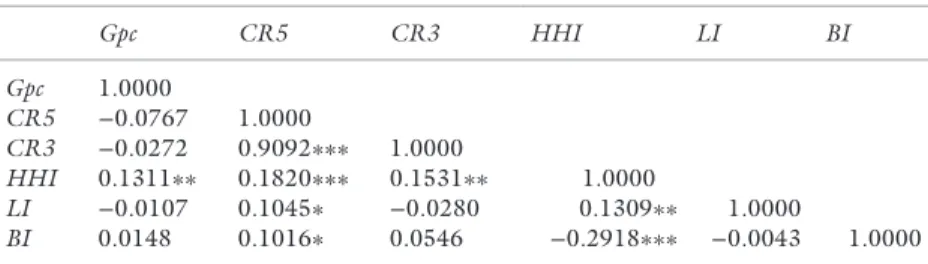
In line with theoretical arguments, there is a negative correlation between bank concentration as represented by concentration ratio (CR5 & CR3) and economic growth. Bank concentration, measured by CR5 and LI, in Table 3.11 appears to be negatively significant in most estimates. However, the results contrast with Petersen and Rajan (1995), Maudos and de Guevara (2006), and Abuzayed and Al-Fayoumi (2016), among others, who found a positive relationship between bank concentration and economic growth.
Nevertheless, an analysis of the values of the coefficients of FIN_p and FIN_l indicates that the effect of. By examining the non-linearity of the relationship between bank concentration and economic growth, we simply test whether the effect of bank concentration on economic growth depends on the level of bank concentration. When it comes to the quadratic terms for bank concentration measures, the results are somewhat different.
The significance of the interaction term indicates a different impact of bank concentration on economic growth when interacted with FIN_p. However, the significance or nonsignificance of the interaction term should not be directly interpreted before looking at the marginal effect. equations and testing the significance of bank concentration and the coefficients of the interaction terms together. Consequently, although the coefficient of the interaction terms (LI × FIN_p and LI × FIN_l) are insignificant in the estimation models (5) and (7), this does not mean that the interaction terms should not be included in the models and that they have no impact on economic growth (Brambor et al. 2006).
The impact of the interaction terms is very marginal when CR5 is used, as can be seen from panel A. Finally, the joint significance test of 𝛽1 + 𝛽3 is confirmed in all models, indicating the validity of the interaction term's inclusion in the models and interpretation of marginal effects. Again, after careful analysis of the values of the coefficients we can see that the effect of CR5 on.
The discussion so far has focused on the general equations of the linear and non-linear models, forcing the effect of bank concentration (CR5 and LI) on economic growth to be identical, regardless of whether a country can be classified as a low country or a country with high income. Overall, it appears that both measures of bank concentration are higher in high-income countries compared to low-income countries. This shows that among OIC countries, bank concentration (CR5) and market power (LI) are more evident in high-income countries.
The significance of all terms (CR5, CR5SQR, CR5 × LOW and LOW) in Panel A of Table 3.15 confirms the validity of the model and suggests that the relationship between market structure and economic growth differs for each type of country's income level. This shows that the relationship between Gpc and bank concentration measures depends on the country's income level, especially if a market structure is used (CR5). The difference between corrupt and less corrupt countries is also evident if we look at the two main measures of bank concentration (CR5 and LI), although this difference is relatively more obvious in the case of market power (LI), as can be seen in fig.
Overall, the table confirms the importance of the market structure measure of bank concentration and non-linearity of its relationship with economic growth.
However, these results cannot be fully confirmed when using the market power measure of bank concentration (i.e. LI), as apart from the significance of the joint coefficients test, the other coefficients are mostly insignificant. The impact of bank concentration has a certain limit or threshold indicating that this relationship is, in fact, non-linear (at least when CR5 is used). This means that the concentration of banks will negatively affect economic growth up to a certain level, when its effect will become positive, showing a "U-shaped" relationship.
Similarly, financial development has a negative impact on economic growth in both linear and non-linear relationships. When indicators of financial development interact with measures of bank concentration, then individually these terms have a negative impact on economic growth. However, the interaction terms are positive, thus reducing the overall negative impact of banking concentration on economic growth.
In general, the impact of banking concentration on economic growth is significantly different for low- and high-income countries. Similarly, a different impact of banking concentration on economic growth is also evident in corrupt countries. In the case of corrupt countries, the negative impact of bank concentration is amplified by the interaction term.
For example, the results of Abuzayed and Al-Fayoumi (2016) reveal that as the quality of institutions in MENA countries deteriorates, the positive effect of banking concentration on economic growth strengthens. This arises from the possible correlation of the lagged or initial value of the dependent variable with the error term, i.e., E[Yi,t–1 (μi + ϵit] ≠ 0 or. This superiority of the GMM system over the difference GMM can may not be completely true in all cases.
In a model without x-variables, the differentiated GMM estimate of the coefficient b appears to be biased downwards in small samples when the instruments are weak. Note, however, as mentioned earlier, that in each model we use one of the two financial development proxies, either FIN_p or FIN_l, to explore its significance to the dependent variable. The relationship between banking competition and financial stability: a case study of the Mexican banking sector.