A thesis submitted to the Faculty of IT and Engineering to meet the requirements for the degree of. 1 The ratio of the most required programming languages in the Jordanian market according to the opinion of the experts………….171 Figure 6.
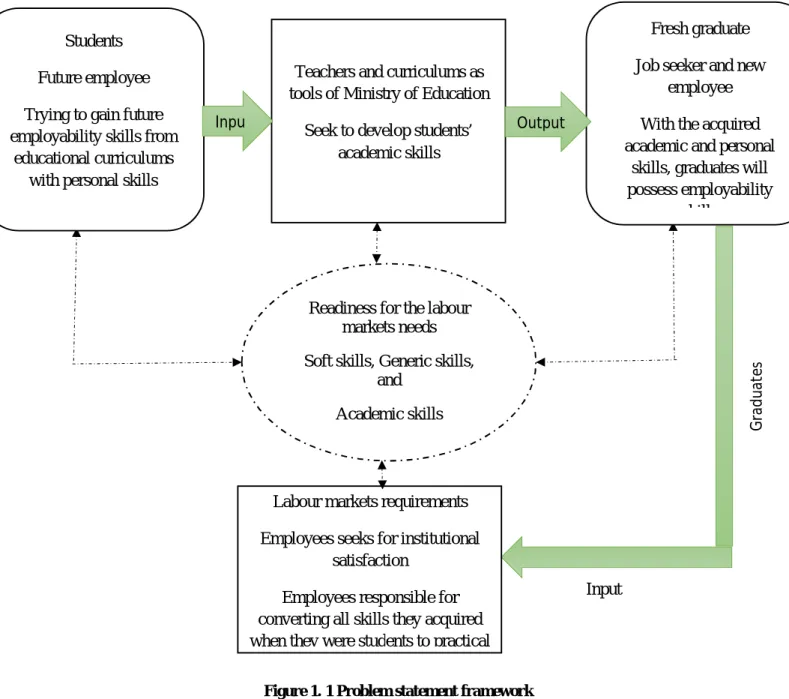
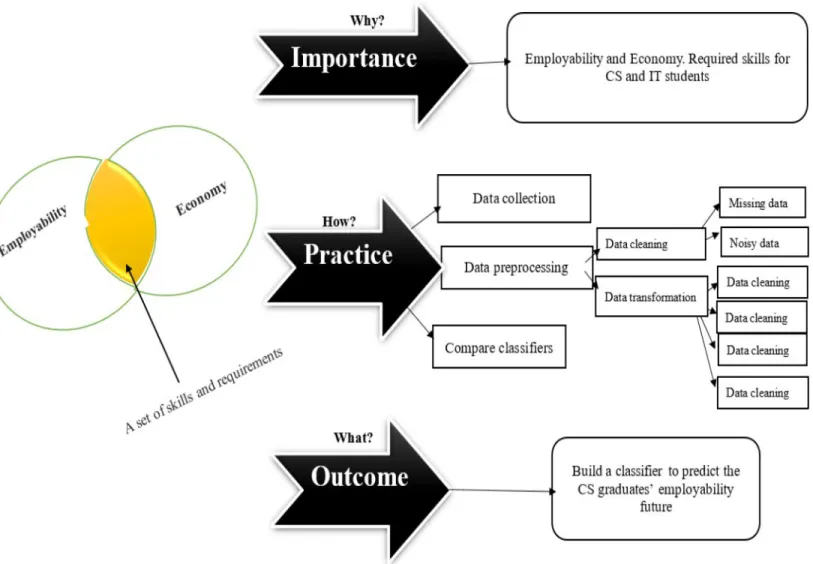
Problem statement
From an educational perspective, these tools are specifically defined as educational data mining (EDM) and learning analytics (LA). The discovered information can support educational decision makers and students' parents.
Significance of the study
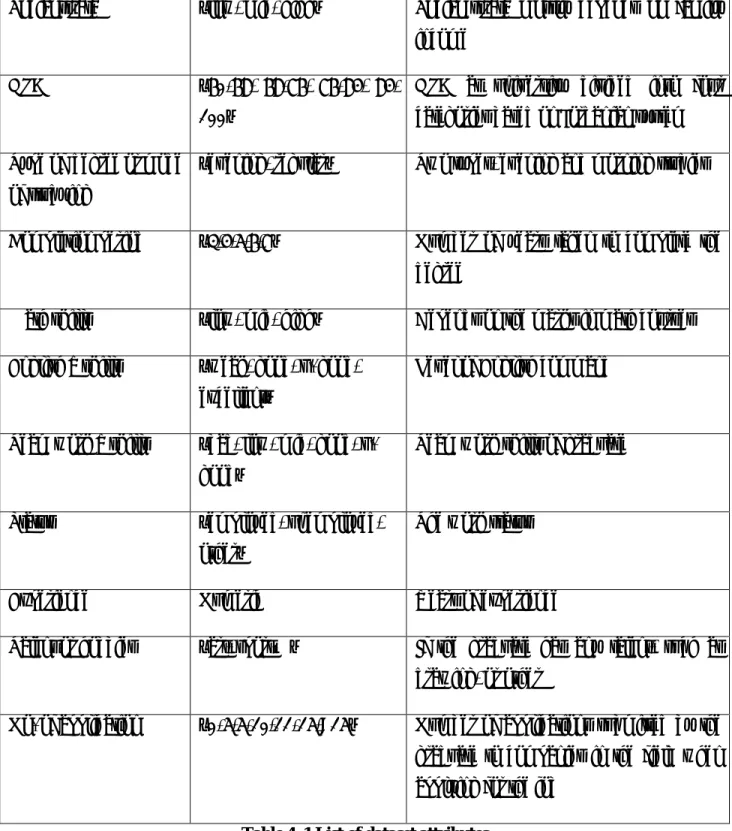
This research study serves to recommend a list of the necessary skills for computer science graduates to match the market requirements in Jordan. Additionally, the study results will provide a set of recommendations to higher education institutions regarding the required skills for CS graduates who will develop curricula.
Conceptual framework
Deep neural network is one of the types that mimic the real human brain neurons (Neapolitan and Neapolitan, 2018). One of the two paths is that of data analysis and the other is that of students' employability (Tomy and Pardede, 2019).
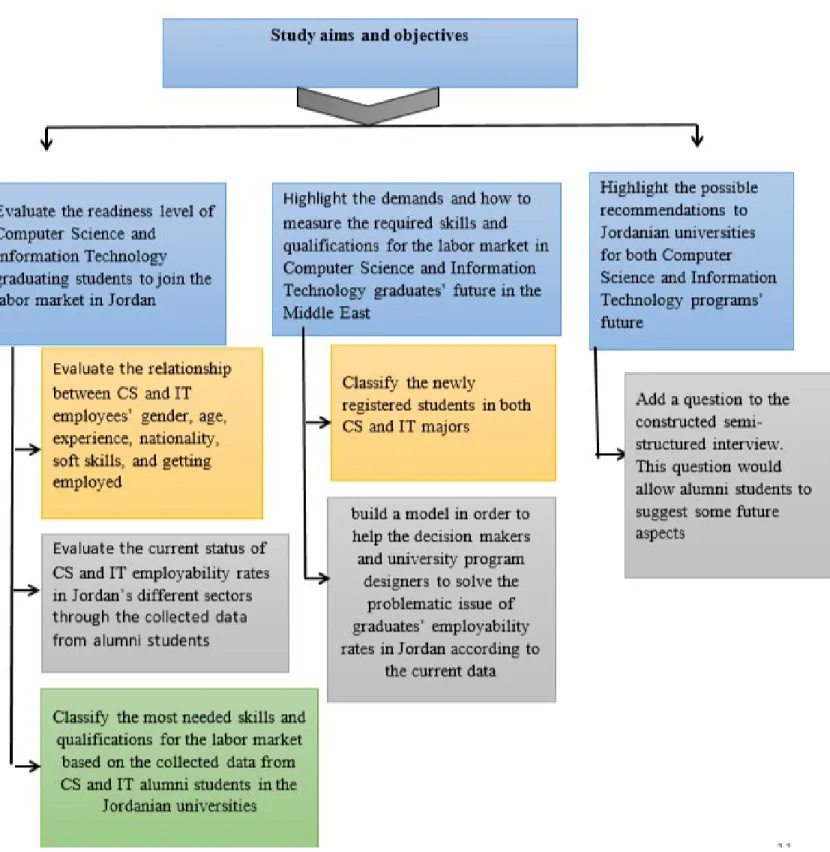
Research aims and objectives
Accordingly, a number of data mining algorithms will be compared in the present study to classify CS and IT alumni students in Jordan according to their employability status. CS and IT are the two major subjects that will be emphasized in this research study.
Research questions
Organization of Dissertation
Educational Data Mining (EDM) is the process of applying Data Mining (DM) techniques to educational data (Wu et al., 2014). It then examines the key techniques and applications for applying educational data mining to employability.
Data mining
Definition
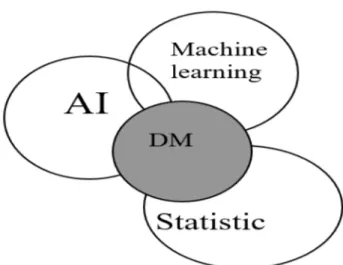
Many people use data mining terms as a substitute for the term "knowledge discovery from data" (KDD), but actually DM is a step in KDD. Data mining is an integral step in the KDD process, which is the most important process in KDD: converting raw data into useful information.
Tasks
Classification
Then the classifier predicts the class ci of the data X if P (xi /ci) P(ci)> P(X /cj)P(cj); this means ci is selected as the data class label x if it has the maximum value (Sivasankar and Rajesh, 2012). It works on the rule of keeping the output of a layer and returning it to the input to help predict the output of the layer (Cho et al., 2014).
Educational data mining
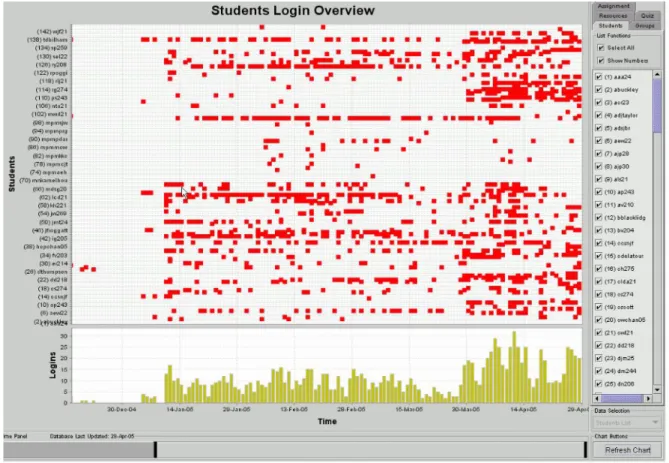
Statistics and Visualization
On the other hand, there are some specific tools for statistical educational data mining, such as Synergo/ColAT (Romero and Ventura, 2007). There are many examples of visualization tools in educational data mining, such as GISMO (Graphical Interactive Student Monitoring System) (Romero, Ventura, & García, 2008).
Web mining
Qualitative predictive models are presented that were able to effectively predict student grades from a training dataset. The study found that students' performance was not only influenced by academic efforts, but also by many other factors (Abu implemented the Decision Tree Method (ID3) as a data mining classification technique to predict students' final grades.
Text mining
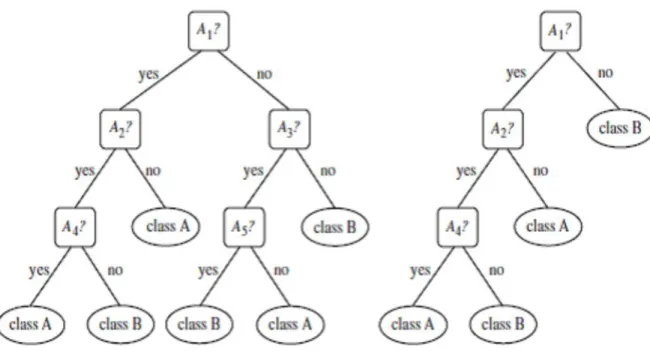
The result of automated analysis provides useful information, including decision trees used for predictions in later experiments. The generated decision trees were also used in the analysis of data using machine learning techniques (Muehlenbrock, 2005).
Neuro-Fuzzy Approach
Most combinations of techniques based on neural networks and fuzzy logic are known as neuro-fuzzy systems. In general, neural networks preprocess the inputs (or postprocess the outputs) of a fuzzy system.
Use of Data Mining and Neural Networks in employability
Data Analytics, Educational Data Mining, and Employability definitions
Despite the fact that the literature provides a range of definitions of 'employability', many policy makers currently use the term to explain 'the skills and attributes of the individual' (McQuaid and Lindsay, 2005). The researcher recommended a research plan to improve the theory and implementations of the concept of employability for future use (Truong, Laura, & Shaw, 2018).
The evolution of predictive models in the fields of Education and Employability
From all the above it can be seen that the concept of employability comes in different areas of the literature with different meanings, obstacles and requirements. Another group of researchers combined both the market requirements (employability) and the university graduates (supply) to improve the future of both sides (Aamodt and Havnes, 2008).
The historical relationship between Education, prediction models, and the evolution of Data Mining:58
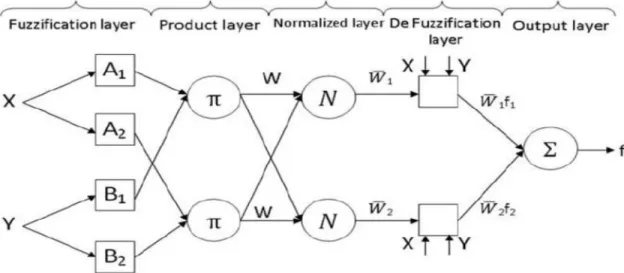
Neuro-fuzzy algorithms combine neural networks with fuzzy logic, where the fuzzy logic system builds according to the structure of the neural network. A fuzzy logic is represented using the structure of the neural networks (NN) and trained using either a backpropagation (BP) algorithm or genetic algorithm (GA).
Chapter Summary
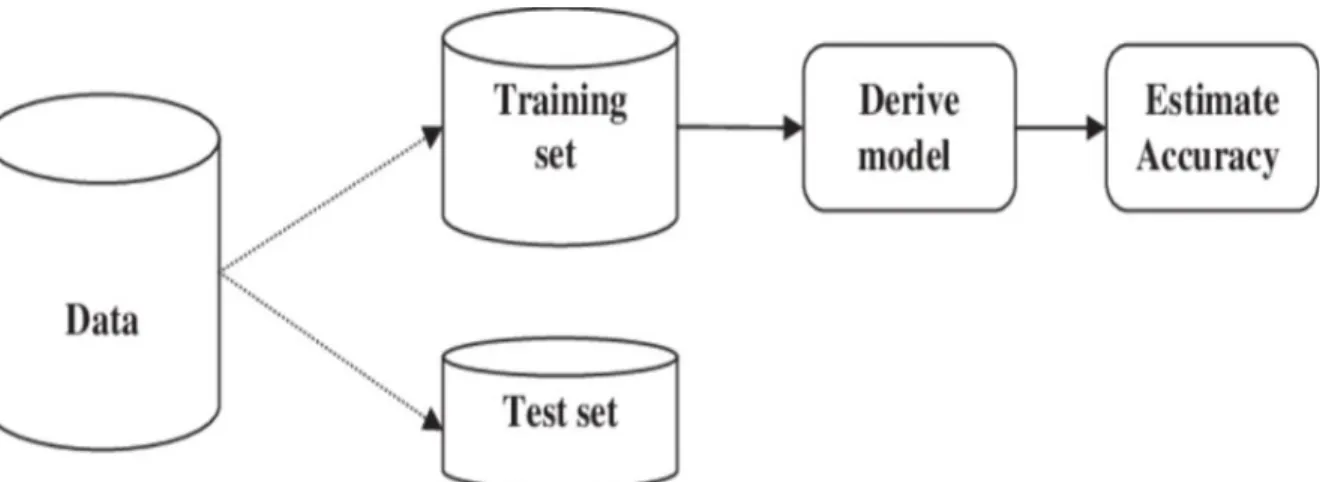
Supervised machine learning occurs when a model is trained on existing data that is properly labeled (Kotsiantis, 2007). Both regression machine learning algorithms and classification machine learning algorithms are classified in the field of supervised machine learning.
Major types of supervised learning methods
Learning step: for building some algorithms of the classification model in order to build a classifier by training the model with the availability of the training set. After that, the model should be trained to predict the correct results (Tang, Alelyani and Liu, 2014).
Classification methods
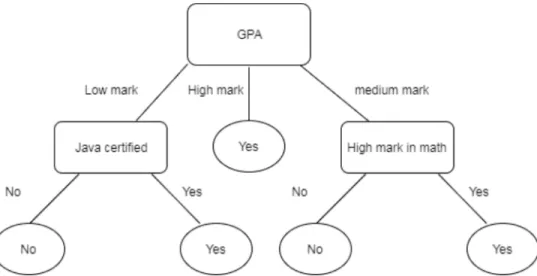
Decision Tree Classifiers
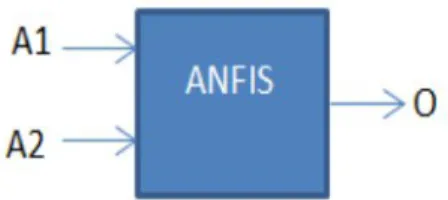
As shown in Figure (4.5), the two inputs are represented using the appropriate membership function distribution (such as triangular, Gaussian, or trapezoidal). As shown in Figure (5.8), the performance of all classifiers has improved the same according to RMSE and Kappa measures.
Bayesian Classifiers
Random Forests
The random forest method performs well for the class imbalance problem on jobs with two classes. The disadvantage of the random forest method is that multi-class tasks are much more difficult when a class imbalance problem arises, where oversampling and moving thresholds are less effective (Biau and Scornet, 2016).
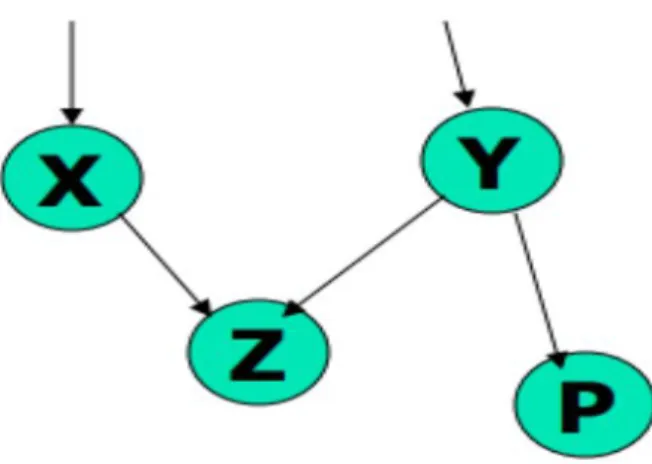
Bayesian Belief Networks
Assign the proportion of the sample with the result "yes" in the total training sample to jaCurrent;. Assign the proportion of the sample that returns "no" in the total training sample to noCurrent;.
Classification by Backpropagation
If the tree graph is built and the factors are visible, the training of the network is explicit. Tree structure undefined, all factors are visible: search through the tree graph space to rebuild tree structure.
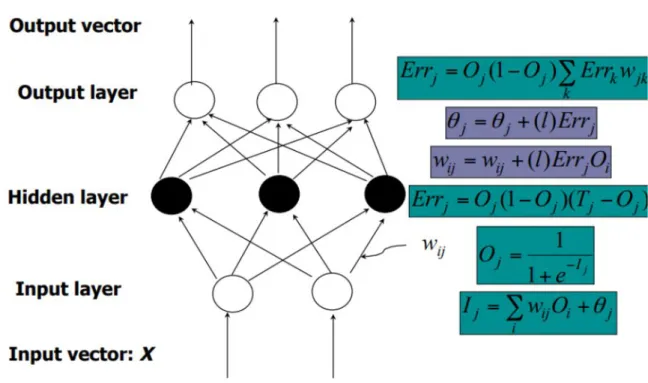
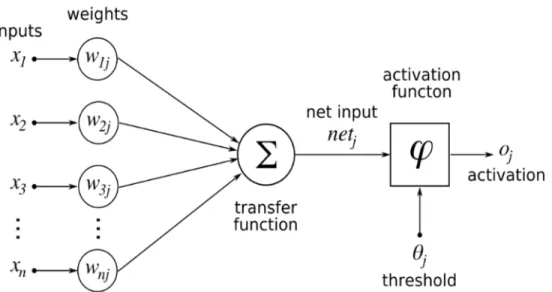
A Multilayer Feed-Forward Neural Network
The inputs to the above network agree with the measured features for each training dataset. The units in the invisible layers and the output layer are known as neurons, due to their representation in a biological way.
Backpropagation Method
The bias represents a threshold in that it serves to change the value of the unit activity. These methods include the dynamic adaptation of the network design and of the learning rate or other parameters, or the application of other error functions.
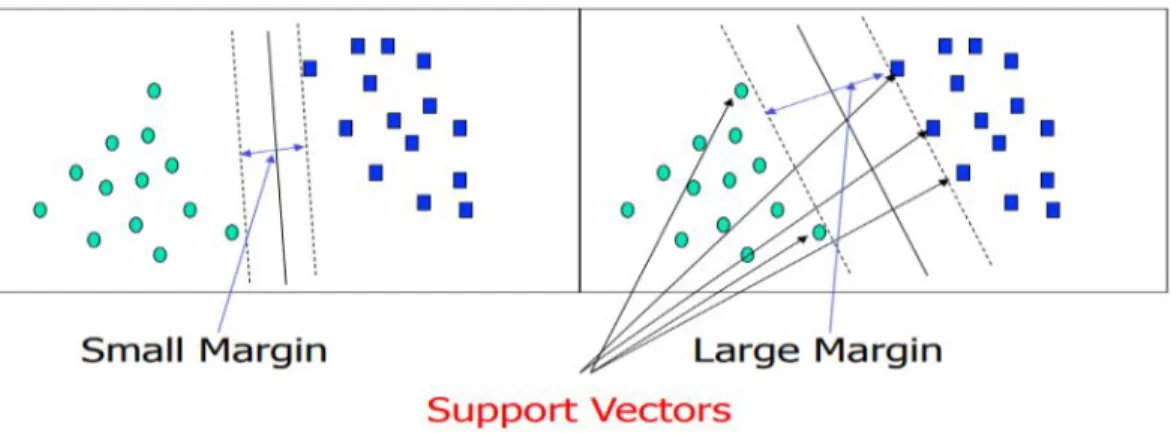
Support Vector Machines
In case the data is not linearly separable, as in (Figure 3.8), no straight line can be drawn that would split the classes. The maximal marginal hyperplane found in the new space corresponds to a nonlinear dividing hypersurface in the original space.
Associative Classification
The transformation process to the new dimension can be done using two steps; in the first step, original input data is transformed into a higher dimensional space using a non-linear mapping. Study the frequent item sets to create association rules for each class that satisfy confidence and support vector points.
Discriminative Frequent Pattern–Based Classification
Fuzzy Classifications Methods
Fuzzy Rule-based Classifier
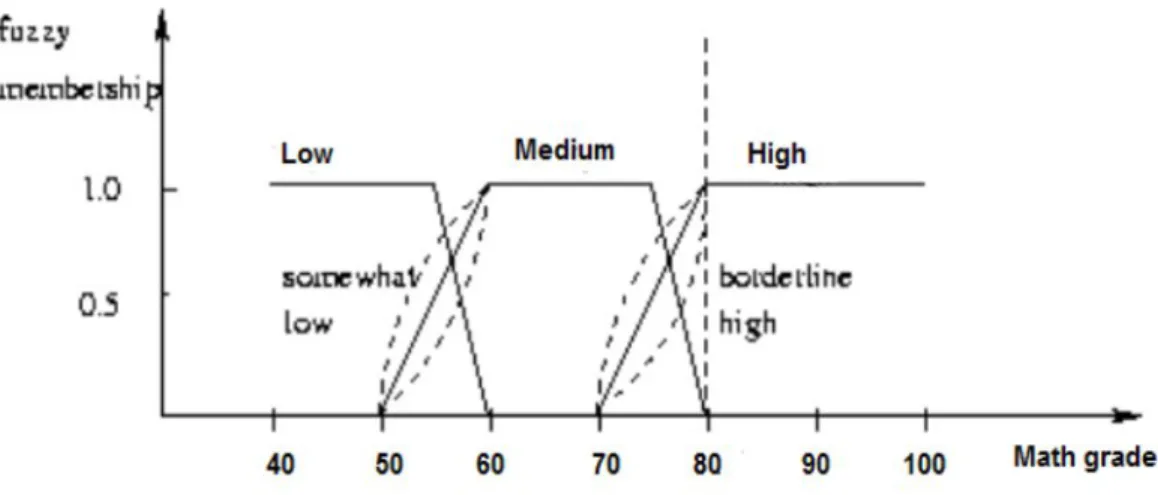
Alternatively, we can classify values into the classes {low_grade, medium_grade, high_grade} and use fuzzy logic to make "fuzzy" thresholds or limits to be assigned for each class. For that reason, we use a fuzzy set approach to build a classification model to predict the level of employability membership of certain classes.
Neuro-Fuzzy Systems
The third step takes the output of step 2 and compares the value of the fire strength of the former node with the sum of all fire strengths (Yao et al., 2009). To simplify this description, think of the algorithm that compares the strength of an output rule from a single node with the strength of other nodes and their underlying rules.
Rule-based Classifiers
The consequence of the rule involves a prediction of the class (in this case, we are predicting whether a student will be hired). For the accuracy of a rule, we calculate their percentage and the rule can classify correctly.
Improving Classification Accuracy Techniques
Bagging
Boosting
The bagging predictor usually has much better accuracy than a classifier derived from the actual training data. Sometimes the output of a "boosted" model can have more accuracy than an individual model generated from the same data.
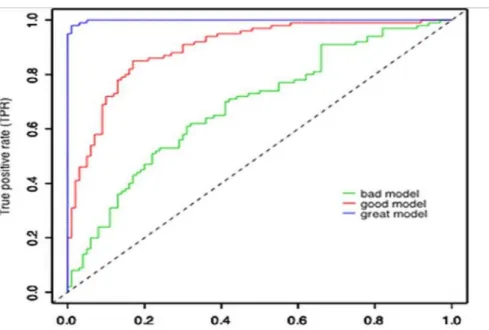
Cost–Benefit and ROC Curves
Classifiers Evaluation
- Holdout Method and Random Subsampling
- Cross-Validation
- Bootstrap
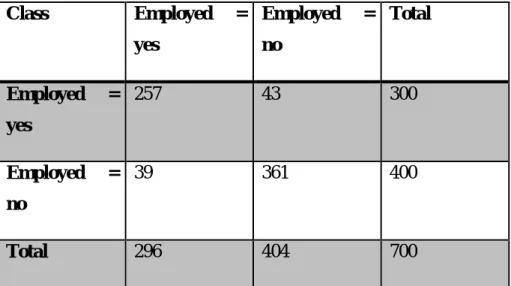
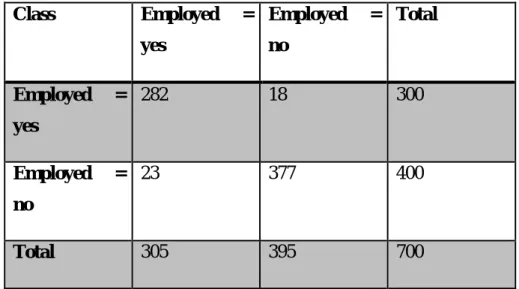
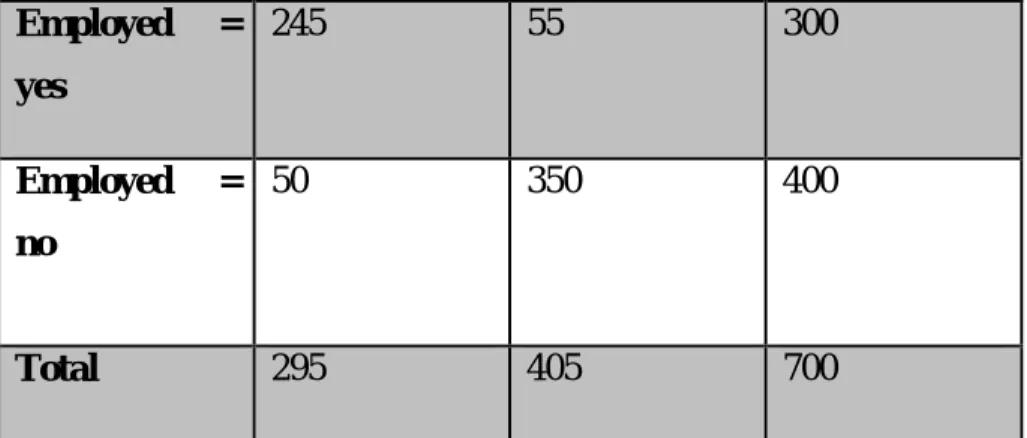
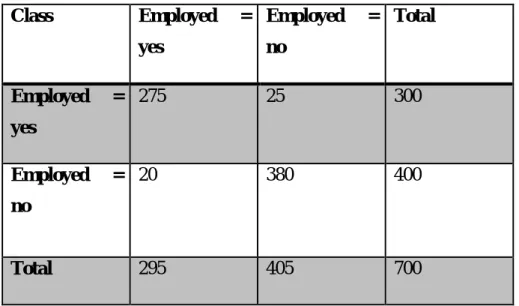
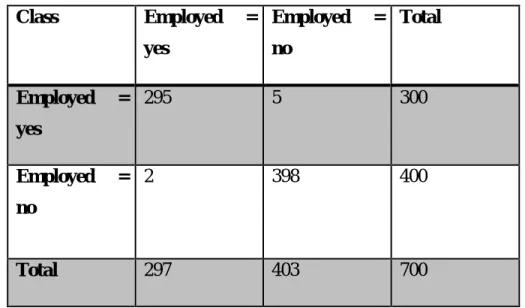
- Confusion Matrix
In this validation technique, the function has one parameter, called k, that represents the number of groups into which to split a given data set. The data items that failed the training set ultimately represent the test set.
Attribute selection approaches
Information Gain
Usually, the midpoint between each pair of adjacent values is designated as a possible split point. The phase with the least information requirement for A is chosen as the split point for A.
Gain Ratio
Given an attribute A that is continuous-valued, rather than discretely valued, for this scenario, we need to determine the "best" split point for A, where the split point is a threshold in A. D1 is the array of items in D satisfying A ≤ pointwise, and D2 is the set of items in D satisfying A > splitpoint.
Gini Index
A neuro-fuzzy approach, which is a combination of neural network and fuzzy logic, can be used to perform classification tasks. A neuro-fuzzy classification approach typically uses the concept of an adaptive neural network, namely an adaptive neuro-fuzzy inference system (ANFIS).
Introduction
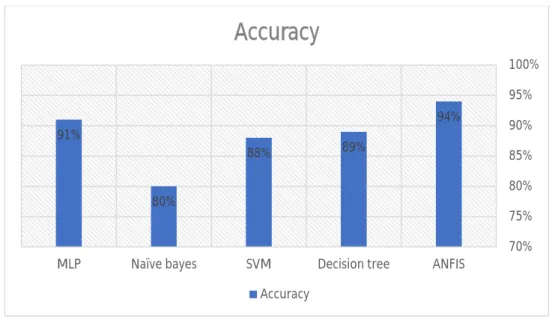
As previously stated, there are many classification techniques reported in the literature and there are many research studies that address employability issues using various techniques such as SVM, K-nearest, naive and artificial neural networks (ANN). In this thesis we will study the employability problem by comparing a neuro-fuzzy technique called ANFIS with many different classifiers.
Statistical insights
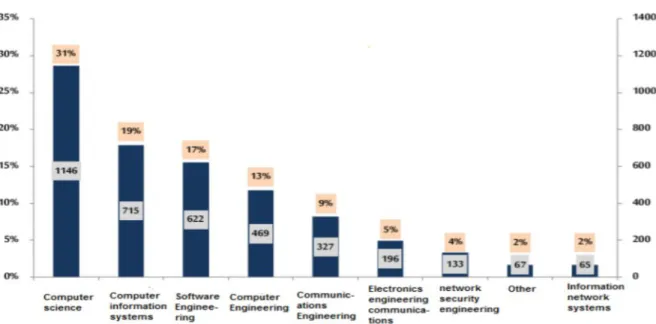
In 2017, the number of IT graduates was 2,869; The computer science major again received the highest ratio, at 29%. As a result of the previous statistics, the attributes that can influence the employment of graduates in the IT market in Jordan are: gender, specialization and university.
The proposed research framework
Data collection
Also, the statistical analysis points to the need for some IT specializations such as computer network security engineering, computer engineering and software engineering. New majors have recently been introduced at the universities, such as cybersecurity and AI.
Data preprocessing
This is used to rewrite the value of the data in a way that reduces redundancy and dependency. These files were prepared and converted to (.csv) format to be compatible with the data mining software such as WEKA and MATLAB used to build the model.
Implement ANFIS
The notation in refers to the number of rules that generate from the linguistic variable of the input parameters. Where the linguistic variable is received as input, five steps are performed to yield a crisp value that roughly corresponds to the consequence of the rule (ie, the class employed, unemployed, or other).
Chapter Summary
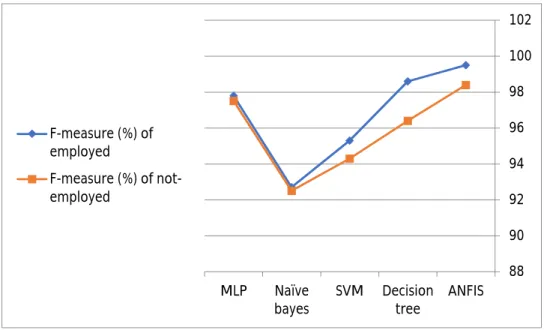
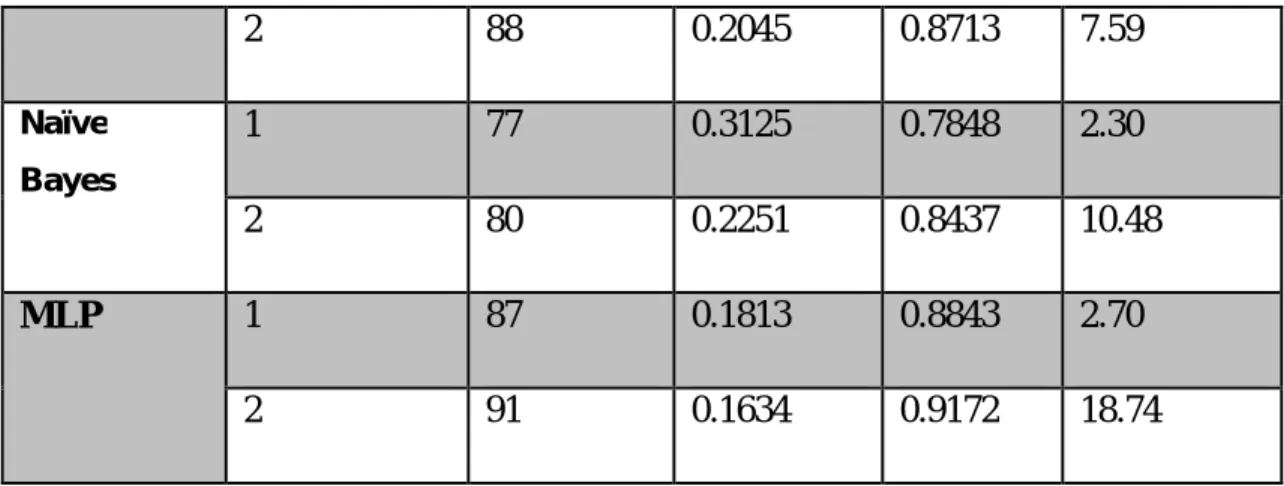
We will use several measures to evaluate the performance, such as KAPPA, RMSE, and accuracy measures, and we will also evaluate the efficiency by measuring the execution time to build the classifiers. Section (5.1) illustrates the techniques and measures that we will use to evaluate the performance of the classifiers.
Performance evaluation
Applying Seven Attributes Using Selection Methods
5 Confusion matrix of MLP classifier using most seven ranking features Accuracy for MLP classifier. 3 False-positive rate of employed and non-employed class for each classifier with the most seven ranking features.
Applying Eleven Attributes
7 False positive rate of employed and unemployed classes for each classifier with eleven attributes. As can be seen from Table (5.16), the execution time for implementing the ANFIS classifier increased when eleven attributes were used.
Applying Fifteen Attributes
As shown in Table (5.24), the execution time for implementing ANFIS classifier using fifteen attributes is increased. As shown in the above table, MLP classifier has the highest value of execution time with 8.84s, then ANFIS with 8.46s.
Applying Nineteen Attributes
15 False-positive rate of employed and non-employed classes for each classifier with nineteen attributes. As shown in Table (5.32), the execution time for the ANFIS classifier application when nineteen attributes are used is increased.
Applying Twenty-Two Attributes
19 False-positive proportion of employed and non-employed classes for each 22-attribute classifier. As shown in Table 5.40, the execution time of using ANFIS classifier using twenty-two attributes has increased significantly.
Final discussion
The decision tree has a lower execution time value of 7.16s, which proves its best time performance compared to other classifiers when increasing the number of attributes. The table separates the accuracy, error ratio, Kappa and runtime values based on the two different approaches we used; we called the use of all 22 attributes “Accession no. 1".
Chapter Summary
In this chapter we will discuss the best model (classifier) based on the experimental studies that were conducted in the fifth chapter of the current research study. In Section 6.2 we will discuss the attributes that most influence the classifier to make it achieve the best performance against other classifiers.
The optimal classifier
In this chapter we will determine the best model, mainly based on accuracy and computational time as the most important factors for evaluating classification techniques and classifiers. As shown in Table 6.1, the best classifier was produced when the number of attributes was seven followed by 22, with dramatic improvement.
The best /attributes determination
GPA: the "GPA" attribute came in third place as the most influencing attribute on accuracy. Programming skills: one of the attributes that achieved the best accuracy was the "programming skills" attribute.
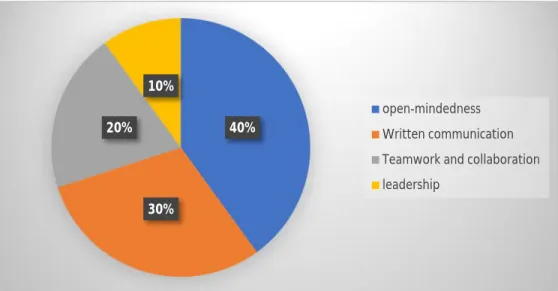
Comparing our classifier with other opinions
Most of the experts confirm that the communication skills factor influences their decision to select employees. 4 The ratio of the most required programming languages in the Jordanian market according to the experts' opinions 30%.
Chapter Summary
In this thesis, we found the most important characteristics that affect the accuracy of the classifier; these factors affect the IT student's employability future the most. The "GPA" feature came in third place among the features that most influence the accuracy of the classifier during experiments.
Contributions
When we compared our results with the opinions of experts on the most important factors affecting the employability of CS and IT students, we observed compatibility between the opinions of experts and our results. English language proficiency must be considered when accepting newly applied students in both CS and IT majors.
Limitations
The experiments showed that the accuracy increased with increasing the number of elements, but the calculation time increased significantly. Data set size: the data set size and the number of rules is the most important factor that affects the calculation time for creating the model from ANFIS.
Implications for Future Work
2018) 'Understanding of a convolutional neural network', in Proceedings of 2017 International Conference on Engineering and Technology, ICET Prediction of Student's Academic Performance Based on Adaptive Neuro-Fuzzy Inference', International Journal of Computer Science and Network Security. 1995) 'Algorithms for fuzzy inference and tuning in the fuzzy inference software FINEST', in IEEE International Conference on Fuzzy Systems.