Traders can implement the same strategies in the forex market that they use to analyze the stock markets. Comparison of Market Hours and Liquidity The volume traded in the forex market is estimated to be more than five times that of the futures market.
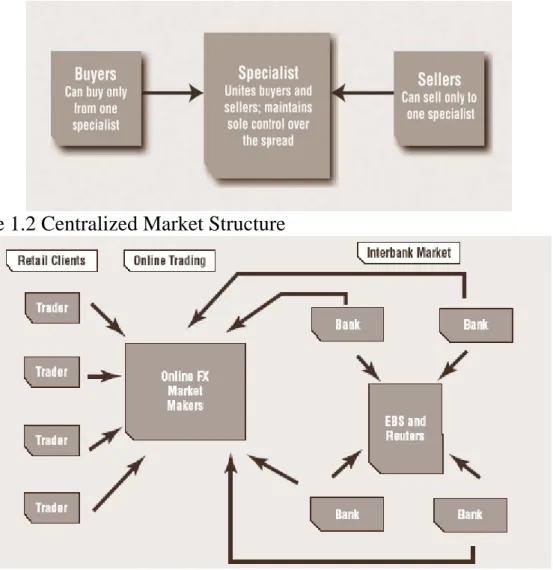
WHO ARE THE PLAYERS IN THE FX MARKET?
Both platforms offer trading on major currency pairs; however, some currency pairs are more liquid and are generally more commonly traded via EBS or Reuters D3000. Intercurrency pairs are generally not traded on any platform, but instead are calculated based on the exchange rates of the major currency pairs and then offset by usage.
Historical Events in the FX Market
BRETTON WOODS: ANOINTING THE DOLLAR AS THE WORLD CURRENCY (1944)
President Richard Nixon of the necessity to address the shortcomings of Bretton Woods, the Smithsonian Agreement unfortunately possessed the same critical weakness: while it did not include gold/U.S. This is undeniably due in part to the Bretton Woods agreement of late: by establishing dollar/gold convertibility, the dollar's role as the world's most accessible and reliable currency was firmly cemented.
END OF BRETTON WOODS: FREE MARKET CAPITALISM IS BORN (1971)
Eventually, the world's exchange rates evolved into a free market, where supply and demand were the only criteria that determined a currency's value. The United Slates, on the other hand, enjoyed significant growth and price stability thanks to the agreement.
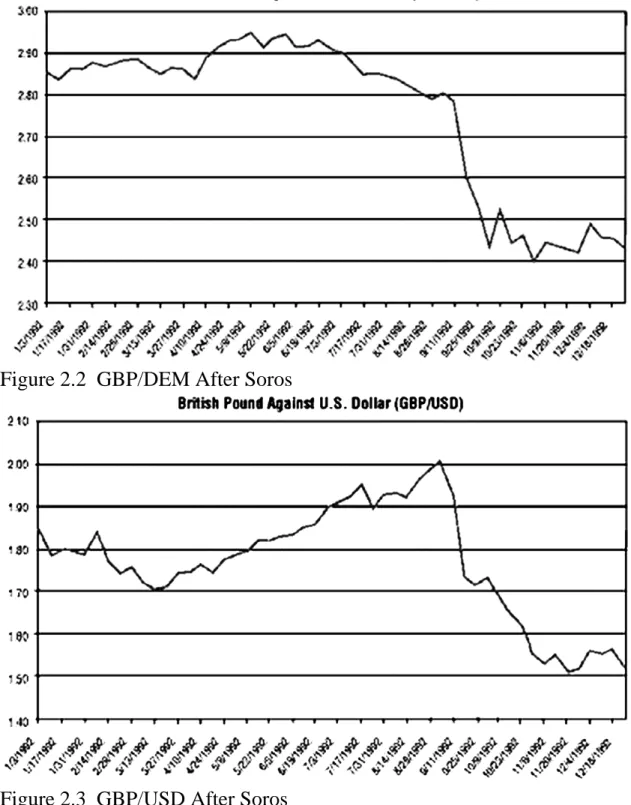
GEORGE SOROS—THE MAN WHO BROKE THE BANK OF ENGLAND
Although Britain was not one of the original members, it would eventually join in 1990 at a rate of 2.95 Deutsche Mark per pound and with a fluctuation margin of +/- 6 percent. Until mid-1992, the exchange rate mechanism appeared to be a success, as a disciplinary effect had reduced inflation across Europe under the leadership of the German Bundesbank.
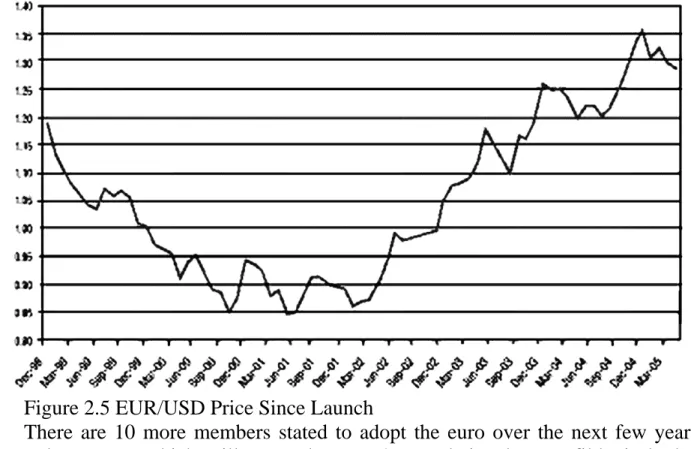
INTRODUCTION OF THE EURO (1999)
However, the euro is not without limitations, political sovereignty issues aside, the main problem is that by adopting the euro, a country essentially loses any independent monetary policy. As a result, the three largest accession countries, Poland, Hungary and the Czech Republic, which account for 79 percent of the combined GDP of the new members, are unlikely to adopt the euro anytime soon.
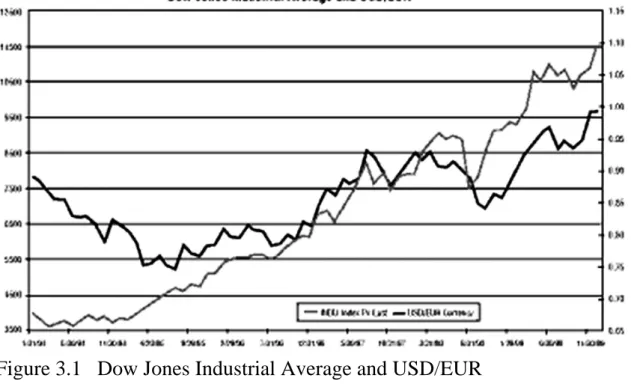
What Moves the Currency Market in the Long Term?
However, this relationship has changed since the US tech bubble burst, as foreign investors remained relatively risk-averse, causing a lower correlation between US performance. However, a relationship still exists, making it important for all traders to keep an eye on global market performances in search of market opportunities. In such a scenario, the natural outcome would be for US residents to sell their dollars and buy British pounds to take advantage of the UK rally.
CURRENCY FORECASTING — WHAT BOOKWORMS AND ECONOMISTS LOOK AT
By the end of the century, international capital flows often dwarfed trade flows in the foreign exchange markets. However, until the 1990s, capital flows played a very minor role in the world economy, so that the balance of trade formed the largest part of the balance of payments for most countries. Asset market theory is actually the opposite of balance of payments theory because it takes into account a country's capital account rather than its current account.
This currency substitution model is a continuation of the monetary model as it takes into account a nation's investor flows.
What Moves the Currency Market in the Short Term?
Minutes
You can compare the breakdowns of the average pip spreads for EUR/USD shown in Table 4.1 with the average daily spread for EUR/USD in 2004, which was about 110 pips.
RELATIVE IMPORTANCE OF DATA CHANGES OVER TIME
GROSS DOMESTIC PRODICT — NO LONGR A BIG DEAI,
HOW CAN YOU USE THIS TO YOUR BENEFIT?
34; Macroeconomic Implications of Foreign Exchange Traders' Beliefs and Behavior,” www.georgetown.edu/faculty/evansml/New%20Micro/chinn.pdf.
A DEEP LOOK INTO THE FX MARKET
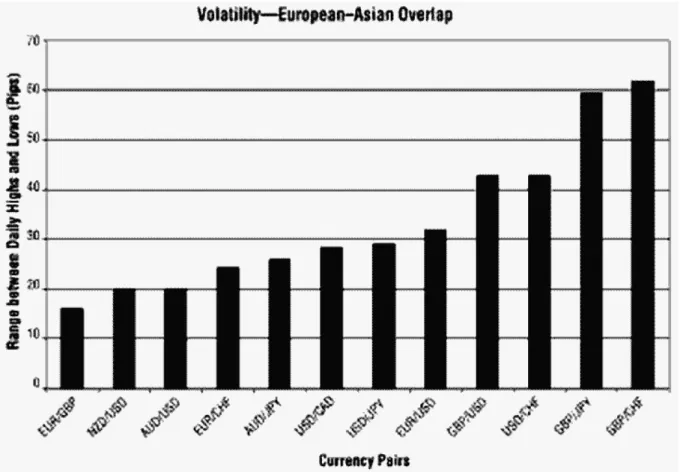
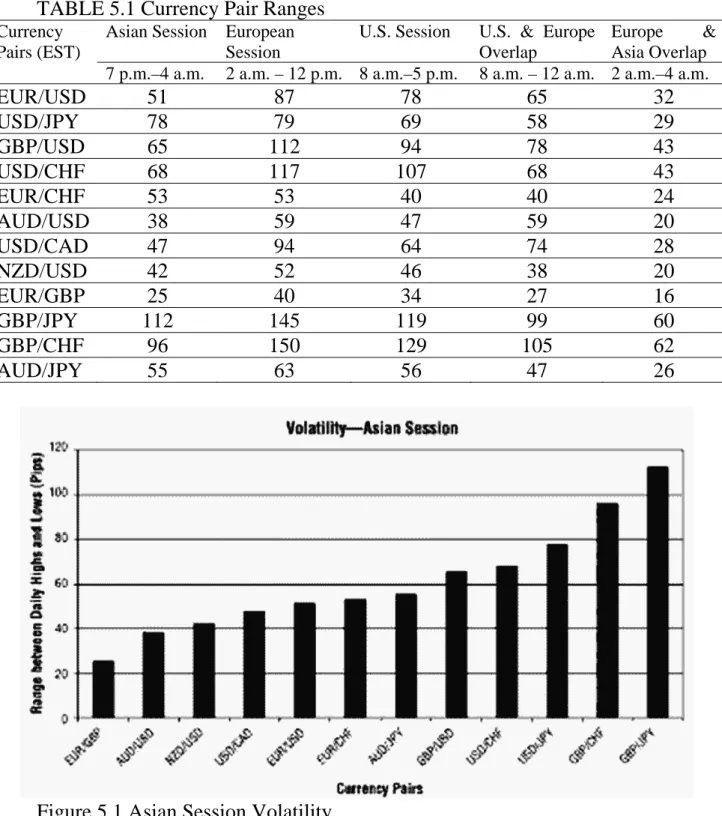
What Are The Best Times to Trade for Individual
Currency Pairs?
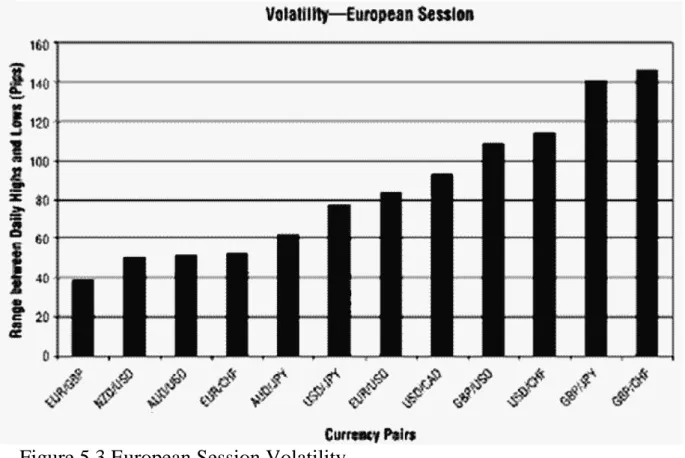
The majority of trades took place in the US at midday, a period of high liquidity as European traders are still in the market. Therefore, a GBP/JPY trade involves two different currency trades, GBP/USD and USD/JPY, and its volatility is ultimately determined by the correlations of the two derivative currency pairs. Most major banks' trading desks are located in London; the majority of major currency transactions are completed during London hours due to the high liquidity and efficiency of the market.
As mentioned earlier, the trade between the European currencies and dollars is increasing again because the major participants have to reshuffle their portfolios for the opening of the U.S.
What Are Currency Correlations and
Use Them?
While we have only seen a strong positive correlation with the NZD/USD, the EUR/USD has a very negative relationship with the USD/CHF. On the other hand, the USD/CHF and AUD/USD pair showed a strengthening trend in the most recent data. An even more dramatic example of the extent to which those numbers can change can be found in the GBP/USD and AUD/USD pairing; there was a -0.87 correlation between the two for the year-long data.
At the bottom of the two columns, go to an empty space and type =CORREL.
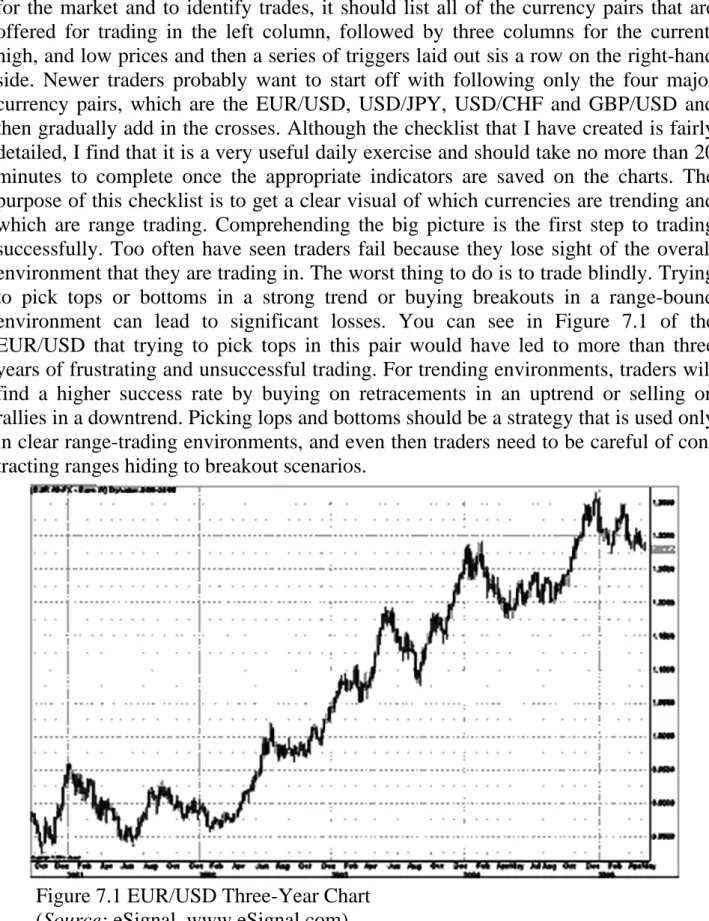
Trade Parameters for Different Market Conditions
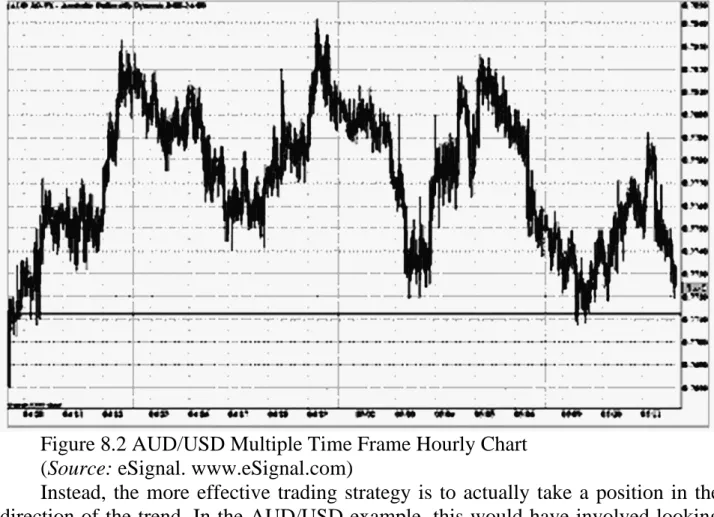
Too often have seen traders fail because they lose sight of the overall environment in which they are trading. You can see in Figure 7.1 of EUR/USD that trying to pick tops in this pair would have led to more than three years of frustration and disappointment and unsuccessful trading. As you can see in the chart, the first two columns after the daily high and low prices are the 10-day high and low levels.
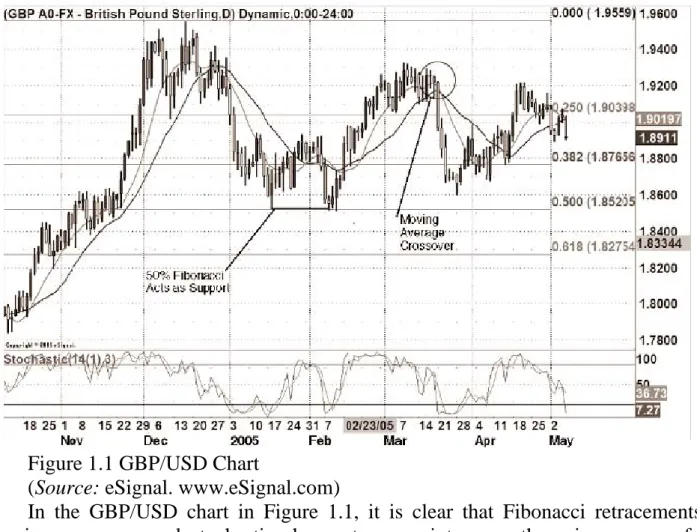
With moving averages, crossovers in the direction of the trend can be used as further confirmation.
Trades That I Am Waiting For
Existing or Completed Trades
Under this premise, I prefer to avoid deals that conflict with my fundamental view. For example, if there is a rally in both GBP/USD and AUD/USD due to the US, my bias to choose AUD/USD over GBP/USD would be even stronger if AUD/USD already offered a higher spread than GBP/USD .
If it is a cross-currency pair like GBP/JPY, I will continue to determine whether the technical view coincides with the fundamental outlook using Fibonacci retracements, ADX, moving averages, oscillators and other technical tools.
HAVE A TOOLBOX — USE WHAT WORKS FOR THE CURRENT MARKET ENVIRONMENT
STEP ONE – PROFILE TRADING ENVIRONMENT
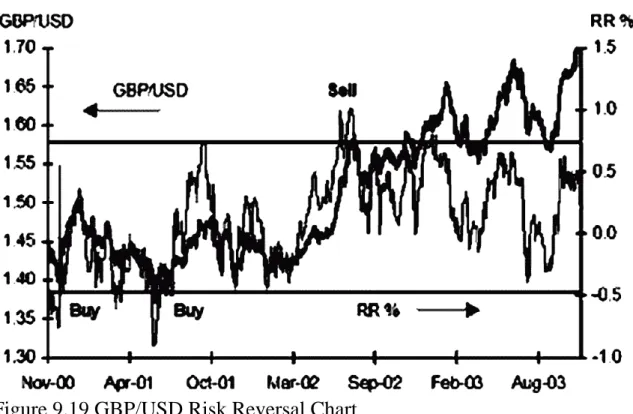
Risk Cancellation Switching between buy and sell options Risk cancellation consists of a pair of options, a buy and sell offer, for the same currency. Thus, risk reversal can be used as a substitute for measuring positions in the foreign exchange market. In spread-bound environments, risk aversion tends to switch between favoring calls and puts.
Options (Risk Reversals) With a trending environment, we look for risk reversals to strongly favor calls or puts.
STEP TWO – DETERMING TRADE TIME HORIZONE
Most forex traders will look for oscillators to point strongly in the direction of the trend. Refer back to the characteristics of a trending environment - look for those parameters that must be met. Although risk management is one of the simpler topics to grasp, it appears to be the most difficult to follow for most traders.
Two-Day Low Method These volatility-based lows involve placing your stop-loss order approximately 10 pips below the pair's two-day low.
Technical Trading Strategies
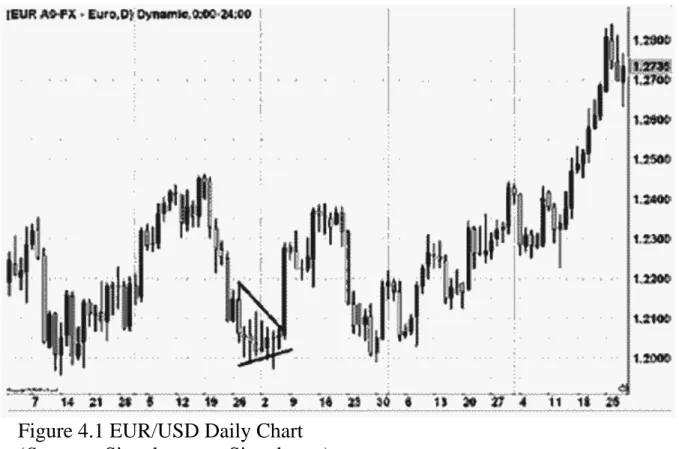
We then sell half the position when the currency pair rises by twice the amount we risked at 1.2835. The stop on the remaining half of the position is then moved to the reversal point at 1.2795. The stop on the remaining half of the position is then moved to the low at 104.95.
The stop on the remaining half of the position is then moved to breakeven at 1.1995.
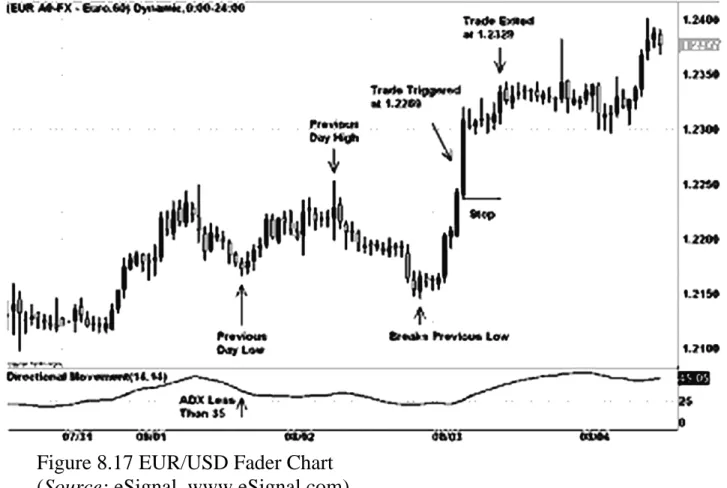
THE FADER
When prices double the amount we risked to 1.6208, we exit the entire position for a 200 pip profit. More aggressive traders can also trade more than one position, allowing them to lock in the profit on the first half of the position when prices rise at double the risk and then follow the stop on the remaining position. In general, these breakout trades are the precursors to major trends, and using trailing stops would allow traders to participate in the trend movement and make some profit at the same time.
Strategy Rules
Either way, any breakout on the back or the release is more likely to be a real one and not one you want to fade. This strategy works best with currency pairs that are less volatile and have narrower trading ranges. Applying the rules just given, we see the 14-period ADX drop below 35, at which point we start looking for prices to break below the previous day's low of l.2166 by 15 pips.
The exit order is triggered a few hours later for a total profit of 60 pips with a risk of 30 pips.
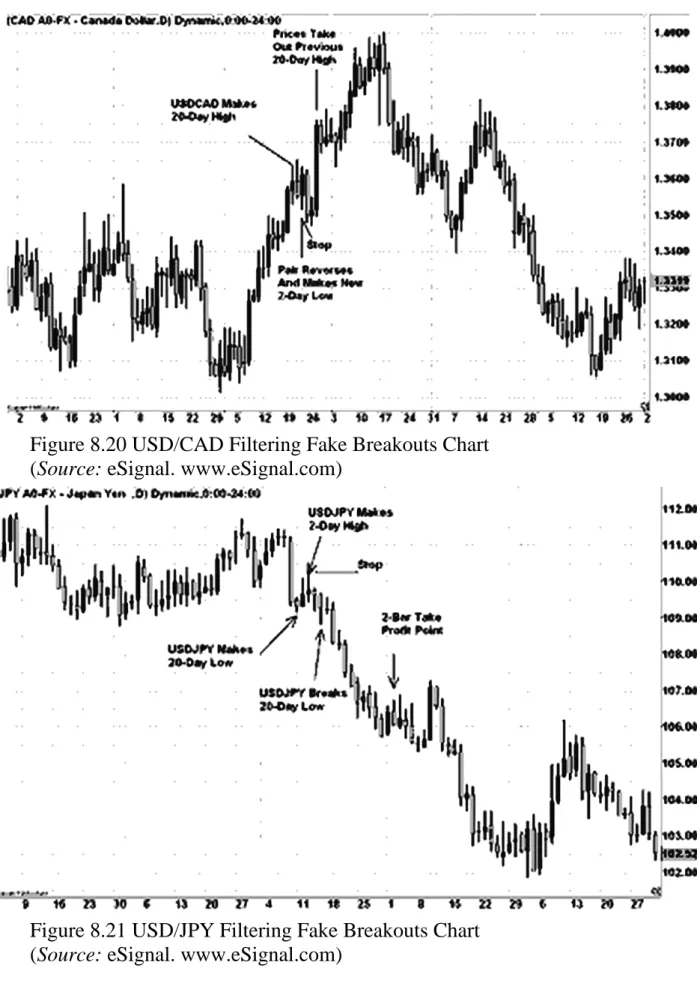
FILTERING FALSE BREAKOUTS
As the currency moves in our favor, we have two choices: either take profits at twice the amount we risked, which would be 220 pips in profits, or use a trailing stop, such as a height of two bars. Most, if not all of the price activity of the currency pair should fall between the two channel lines. We will look to identify situations where price trades within a narrow channel and then trades towards an exit from the channel.
A trailing stop could also have been used, similar to the one we talked about in our risk management section in Chapter 7.
PERFECT ORDER
Fundamental Trading Strategies
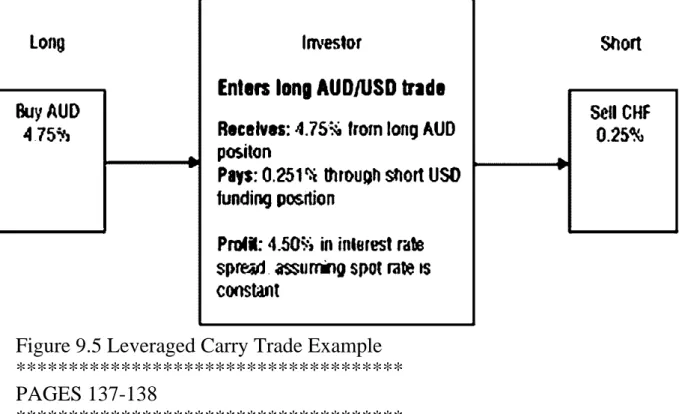
LEVERAGED CARRY TRADE
The way a carry trade works is to buy a currency that offers a high interest rate while you sell a currency that offers a low interest rate. To summarize: A carry trade works by buying a currency that offers a high interest rate while selling a currency that offers a low interest rate. Therefore, to work, carry trades require investors as a group to have low risk aversion or be willing to take the risk of investing in the higher interest currency.
An increase in risk aversion is generally beneficial for low-interest-rate currencies: sometimes investor sentiment changes quickly—investors.
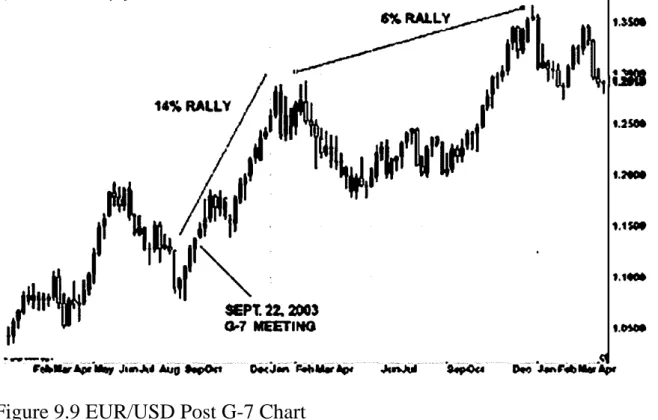
FUNDAMENTAL TRADING STRATEGY: STAYING ON TOP OF MACROECONOMIC EVENTS
EUR/USD bore the brunt of the dollar's depreciation, while Japan and China aggressively intervened in their currencies. As a Bush victory became more apparent and later confirmed, the dollar sold off against major currencies as the market anticipated that the maintenance of the status quo was likely to end. The Swiss franc was one of the main beneficiaries due to the country's political neutrality and safe haven status.
Although the United States is the world's second largest producer of gold (behind South Africa), an increase in gold prices does not result in an appreciation of the dollar.
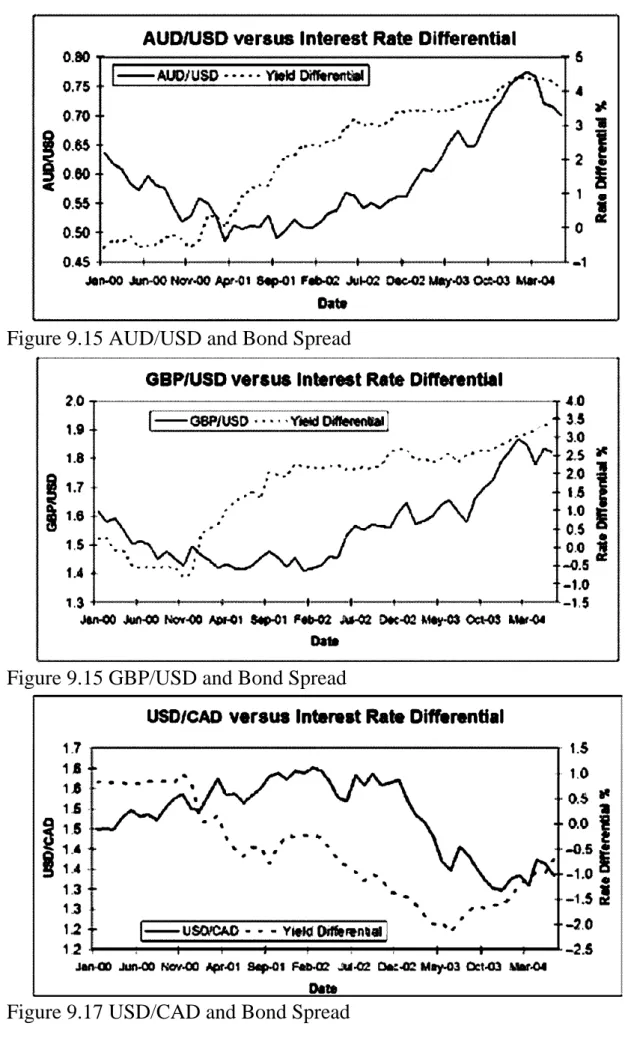
USING BOND SPREADS AS A LEADING INDICATOR FOR FX
For example, if interest rate differentials predict future currency pair prices, interest rate differentials would be leading indicators of currency pair prices. Whether interest rate spreads are a leading, coinciding, or lagging indicator of currency pair prices depends on how much investors care about future interest rates versus current interest rates. If currency traders consider both current and future interest rates, you would expect interest rate differentials to be a leading indicator of future currency prices.
For example, GBP/USD interest rate spreads should be the 10-year gift rate minus the 10-year U.S.
FUNDAMENTAL TRADING STRATEGY: RISK REVERSALS
Interest rate differentials are then calculated by subtracting the yield of the first currency from the yield of the second currency in the pair. In the AUD/CAD volatility chart in Figure 9.20, short-term volatility is mostly quite close to long-term volatility. A potential breakout is likely to work in the trader's favor if the current position is close to the limit and far from the stop.
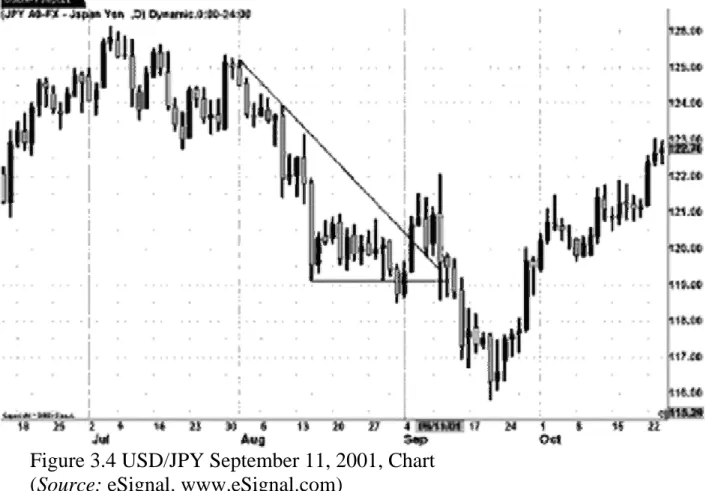
In the first case study shown in Figure 9.23, the Japanese government entered the market and bought the US.