This provides water managers with the ability to identify the optimal combination of sources to meet both current and future Abu Dhabi requirements. Finally, a decision support system for water resource managers is then provided by linking the main components of these models (ADWBM and ADWCPM) and is called “Sustainable Water Budgeter for Abu Dhabi” (SuWaB-AD).
Introduction
- Overview
- Statement of the Problem
- Motivation and Objectives of the Research
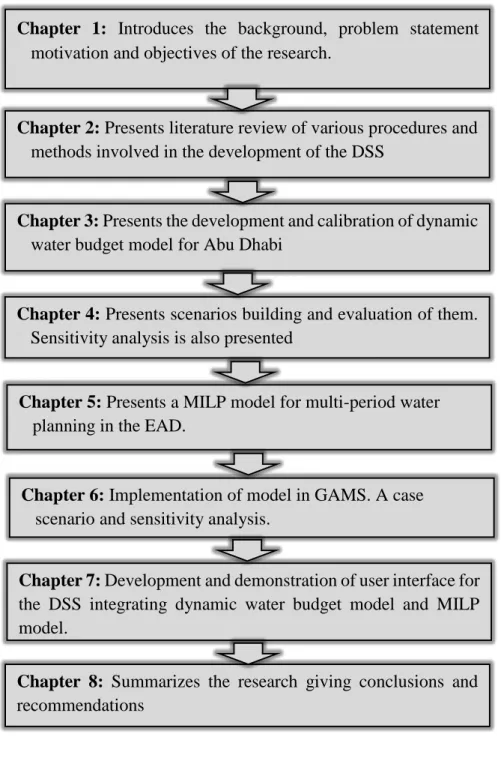
- Dissertation Structure
Currently, water consumption in the Emirate of Abu Dhabi (EAD) is unsustainable and a business as usual (BAU) scenario would result in a tripling of desalinated water demand by 2030 and the depletion of available groundwater (fresh and brackish). in about 50 years or earlier in areas of extensive irrigation (RTI International, 2015). Develop a dynamic water budget model for Abu Dhabi that will be able to provide future water budget scenarios considering future trends (eg 20, 30 years).
Literature Review
- Water Balance Models
- Scenario Analysis
- Optimization Methods in Water Management and Capacity Planning
- Decision Support Systems in Water Management
- Chapter Summary
Evaporation calculation using the Surface Evaporation Capacitor (SEC) model was included in some of the research (Lehmann et al., 2019). Scenarios are used to evaluate potential risks and assist in the implementation of water conservation plans (Carter et al., 2007).
Development of a Dynamic Water Budget Model for Abu Dhabi
Study Area
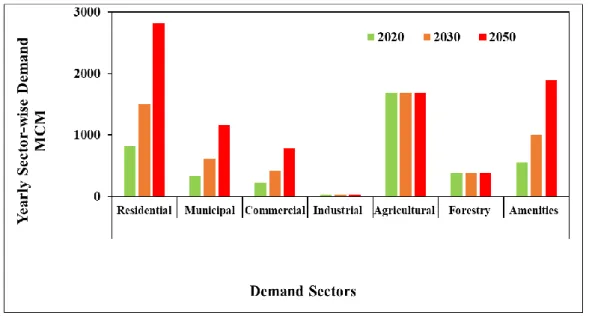
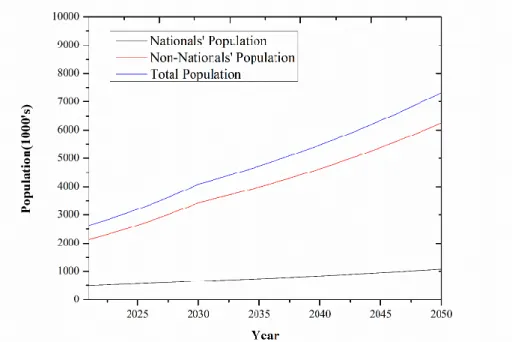
The population of the Emirate of Abu Dhabi has grown many times over the past few decades, driving much of the increase in water consumption in the Emirate, especially residential, industrial and municipal consumption (Statistics Center - Abu Dhabi, 2015). Much of the water consumption in the Emirate of Abu Dhabi has increased as a result of population growth, particularly in the residential, industrial and municipal sectors.

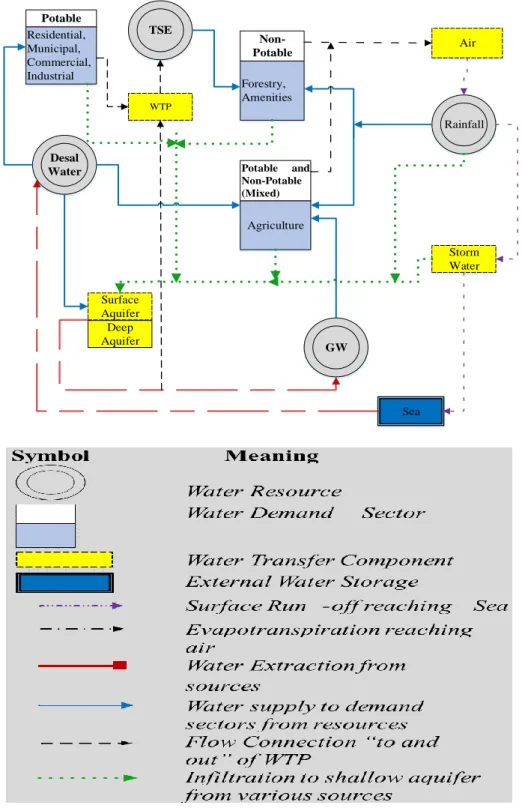
Conceptual Water Balance Model
- Mass Balance Equations for Water Supply Subsystem
- Mass Balance Equations for Water Demand Subsystem
- Mass Balance Equations for Water Transfer Subsystem
The water demand subsystem covers all water demand sectors that are water consumers in the EAD. The SDS collects and discharges stormwater to the sea from precipitation occurring in the urban EAD zones.
Development of Dynamic Water Budget Model
- Population Forecast Module
- Water Supply Forecast Module
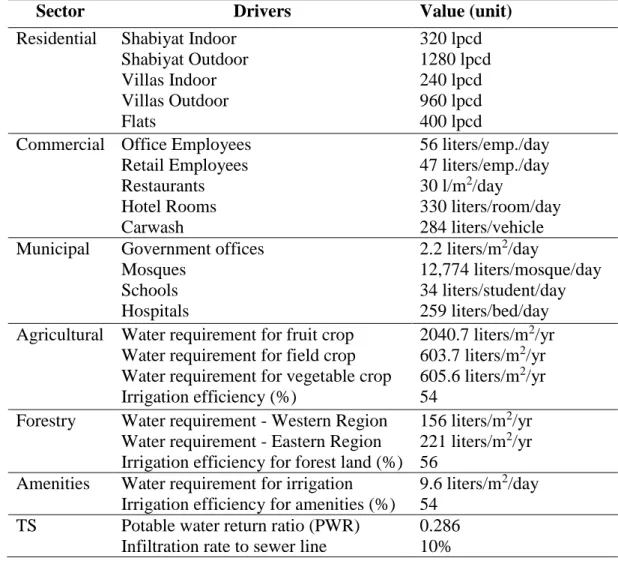
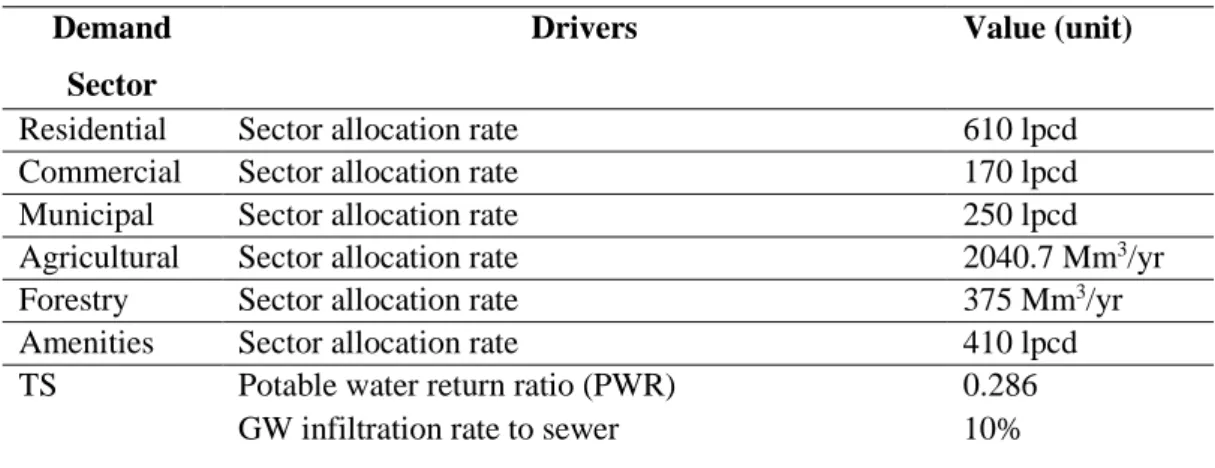
- Water Demand Forecast Module
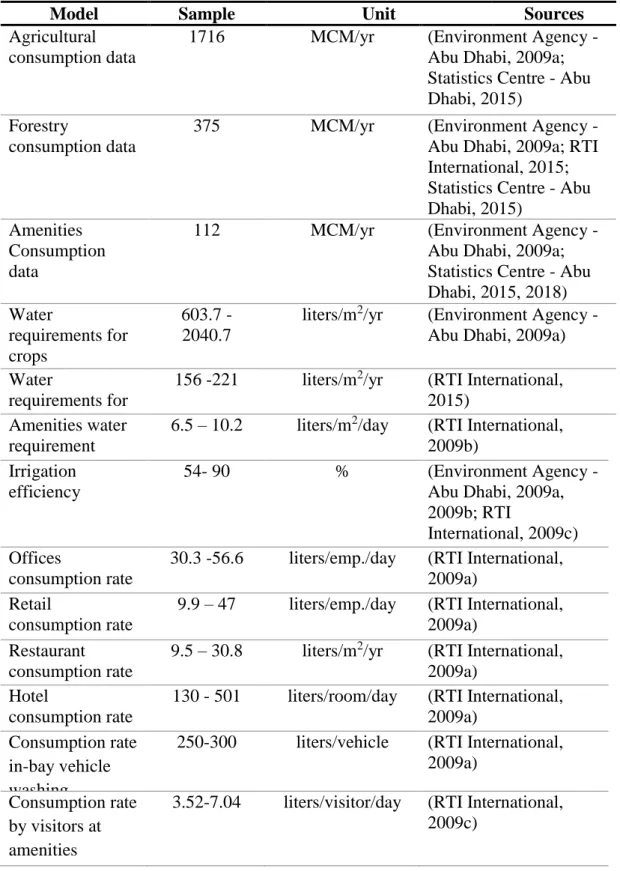
Metered data, which are collected at the household level, are the simplest data on direct use. The total housing demand is calculated based on EAD's aggregation of use by household types, where Nj is the number of households of type j. DAm=(∑ (AmRk*Ark) /IEAm + Lr, where DAm is the annual facility water demand in MCM/year, k-type facilities, AmRk is the annual facility water demand per unit area for type k facilities, Ark is the irrigated area of k-type facilities, IEAm is the irrigation efficiency for landscape irrigation and Lr is the leaching requirement.
Model Calibration and Validation
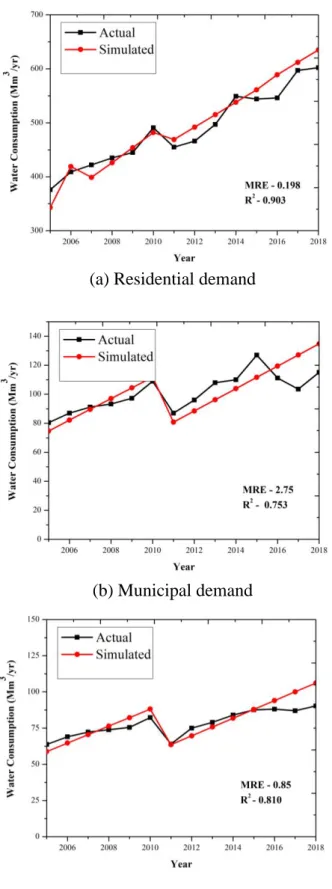
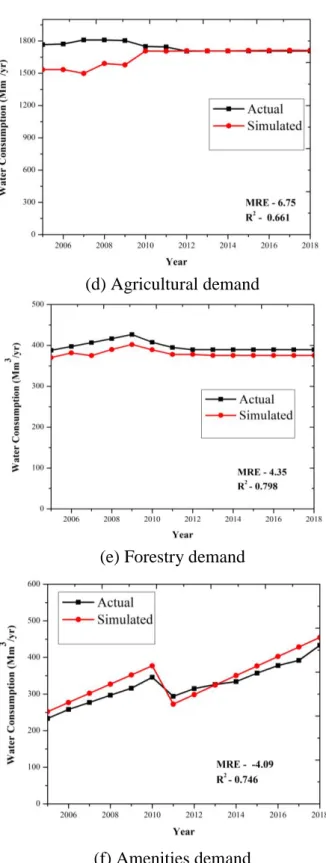
R2, a number between 0 and 1, was used to calculate the accuracy of the model by describing the collinearity between the model and real values. The plots (Figure 5) show that the model was able to reproduce the results that fit well with the historical values. Therefore, the overall results of the calibration and validation showed that the model is able to reproduce the water demand and supply trends sufficiently well and is suitable for use.
Chapter Summary
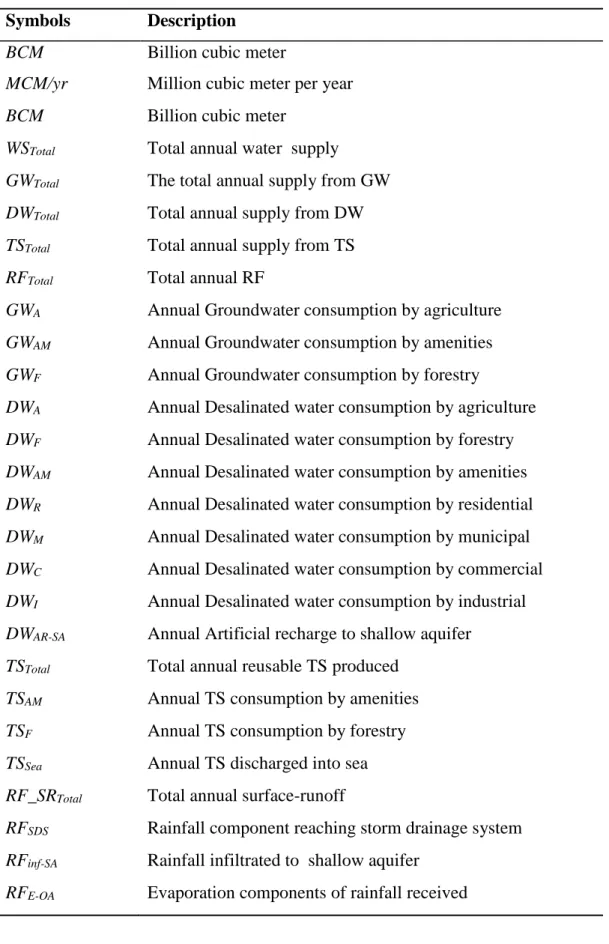
TSAM Annual consumption of TS by facilities TSF Annual consumption of TS by forestry TSSea Annual consumption of TS discharged to sea RF_SRTotal Total annual surface runoff RFSDS. CRjn Consumption rate of j type of households by citizens CRjnn Consumption of j type of households by citizens CRjni Internal consumption by j type of households by citizens CRjnx External consumption by j type of households by. Daily amenity demand per inhabitant AmRk Water demand for amenity type k Type of amenity.
Scenario Analysis using ADWBM and Sensitivity Analysis
Basis for Scenarios Building
The increase in MF represents high immigration rates to the United Arab Emirates for continued rapid economic growth in the region. The average population growth P3 represents a balanced environment and gradual economic growth in Abu Dhabi while the lowest population growth P4 represents a green economy. The availability of renewable water resources depends on climatic factors such as rainfall and temperature, and their availability may be adversely affected by future climate changes in the region.
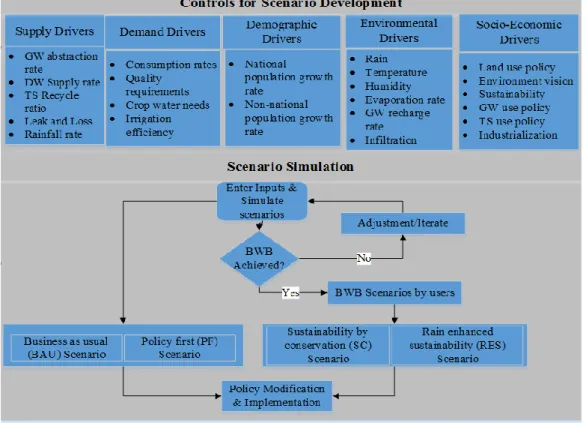
Scenarios Development
- Business as Usual (BAU) Scenarios
- Policy First (PF) Scenarios
- Sustainability by Conservation (SC) Scenarios
- Rainfall Enhanced Sustainability (RES) Scenarios
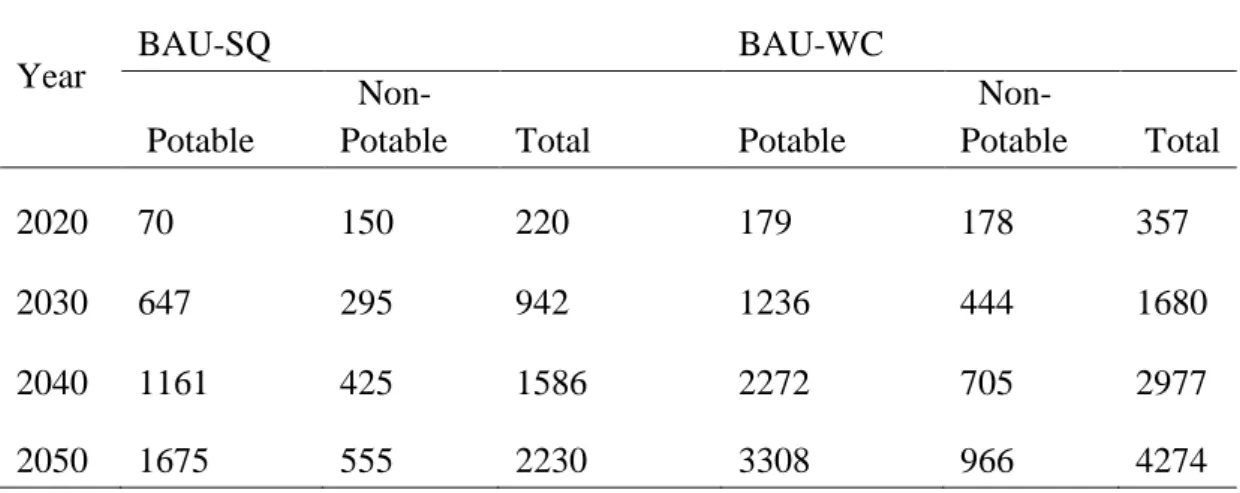
Two population growth models, medium (P3) and very high (P1), were used to develop the BAU scenarios. The BAU-Worst Case scenario (BAU-WC) considers a very high population growth rate, P1, without balanced environmental and economic growth. The SC sub-scenarios were developed considering three population growth models, Sustainability from Conservation-Balanced Growth (SC-BG) using P3, Sustainability from Conservation-First Market (SC-MF) using P2 and Sustainability from Save-First Environment (SC -EF) using P4.
Evaluation and Analysis of Scenarios Using ADWBM
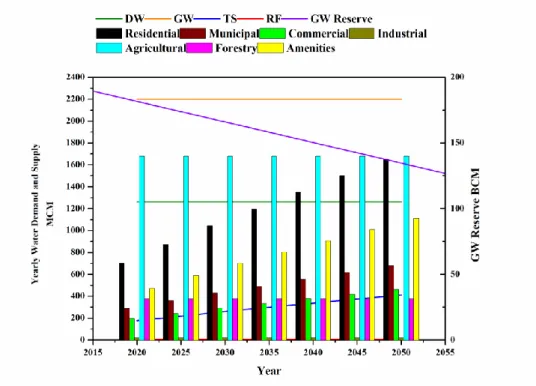
- Simulation Results
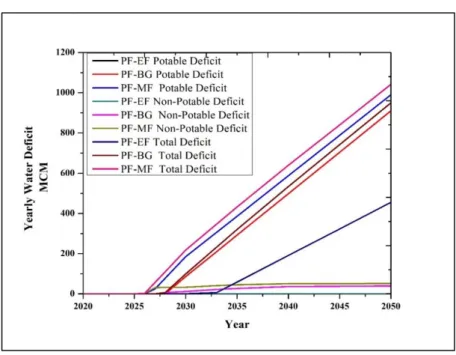
However, in the case of the PF-EF scenario, the low population growth will maintain a positive water balance until 2033 (Figure 10). The distribution of driver-level reductions to achieve a BWB in the four major demand sectors is shown in Table 8. This is because the expected reductions in the residential sector are in outdoor use.
Sensitivity Analysis
In the utility sector, government service areas and their consumption rates are the drivers that mainly affect municipal water demand in 2050. In the agricultural sector, the controllable driver is irrigation efficiency and cultivated area (fruit, fields and vegetables). ) strongly influence the requirements of agriculture. In the recreation sector, irrigated land is generally divided into two categories, parkland and ornamental land.

Strengths and Limitations
According to the effect on commercial water demand, the most influential input parameters for all three time horizons are water consumption by restaurants. Retail workers and the number of office workers have a similar impact on demand. Car wash and hotel water consumption has minimal effect on commercial water demand.
Chapter Summary
The model parameters, such as the drivers of different demand sectors, that form the basis for future demand forecasting, are included based on the data available at the time of model development. The data of the driving forces (such as the consumption figures of different sub-sectors) should be updated in the coming years to improve the accuracy of the model in predicting the future.
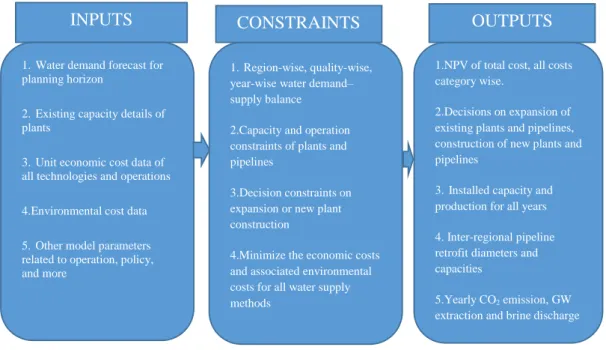
Abu Dhabi Water Capacity Planning Model
Problem Statement
These plants associated with DW and TS plants differ in capital, operating and environmental costs. TS supply system can be otherwise called as non-potable system which involves the collection and transportation of waste water from all population centers to the treatment plants to produce TS, and a distribution network of TS to the users. This was neglected because this study assumed that a sewage system and TS distribution already exist in all the major population centers and the expansion of these systems costs less when compared to the overall cost.
Capacity Planning Model Development
- Model Constraints
- Objective Function
𝐶𝐴𝑃_𝐷𝐸𝐶𝑂𝑀𝑟,𝑘,𝑙,𝑛,𝑡𝑃𝑙𝑎𝑛𝑡 Capacity decommissioned n number of plants (DW and TS) at factory location l within the region r working on the factory technology k in year t. 𝐶𝐴𝑃𝑟,𝑙,𝑘,𝑛,𝑡𝑃𝑙𝑎𝑛𝑡 Installed capacity of n plant (DW and TS) at production location l in region r by working on production technology k in year t. 𝐶𝐴𝑃𝑟,𝑡𝑃𝑙𝑎𝑛𝑡 Total installed capacity of all plants (applicable to both DW and TS) in a region r in year t.
Chapter Summary
Implementation of Abu Dhabi Capacity Planning Model
Background and Scenario Setting
Therefore, for DW; regional production, interregional transmission and external imports from external facilities are possible. The demand for non-potable water in EAD is mainly satisfied by GW and TS. The population centers in each region are assumed to be at sea level, and therefore elevation differences are not taken into account in the interregional transport of water.
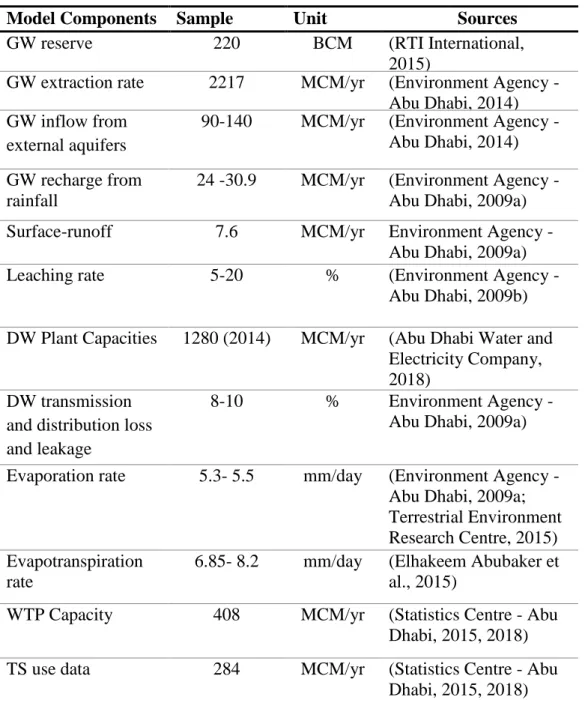
Key Data in the Study Area
- Projected Water Demands
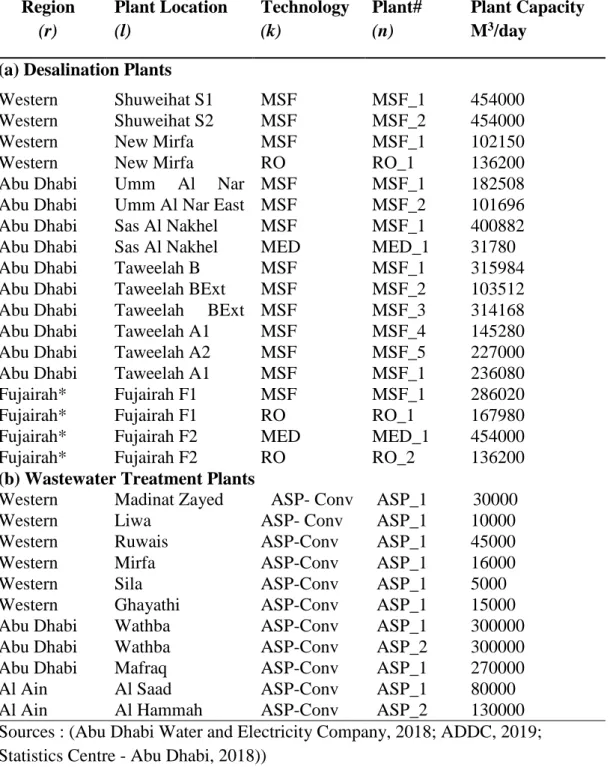
- Existing Water Treatment Facilities
- Water Transmission System
- Other Parameters
All existing infrastructure in Abu Dhabi for water production and pipeline transmission is considered. Furthermore, it is assumed that there is no significant difference in the heights of the connection points. The capital costs of different technologies in DW and TS plants considered in the case study are given in Table 14.
GAMS Outputs
- Overall Costs and Its Breakdown
- Capacity Expansion
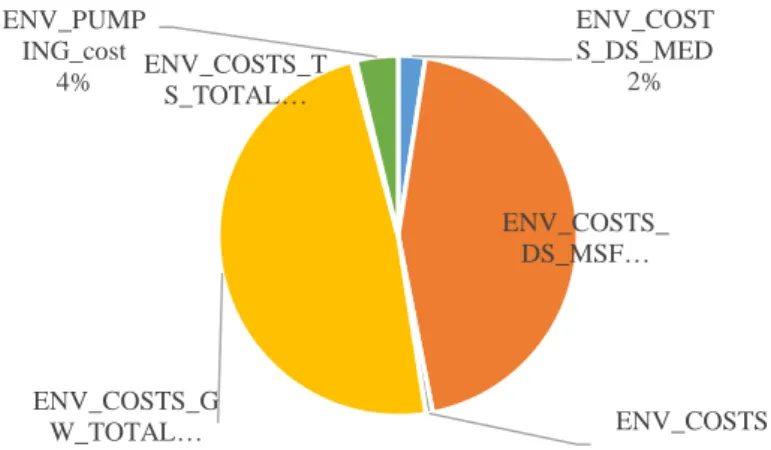
- Environmental Indicators
It can be seen that the model has opted for capacity expansion by opting for more RO. This is compensated in the optimal solution by the model with the increase in GW use for such years. The model has solved the capacity expansion problem taking into account the constraint to minimize CO2 emissions.
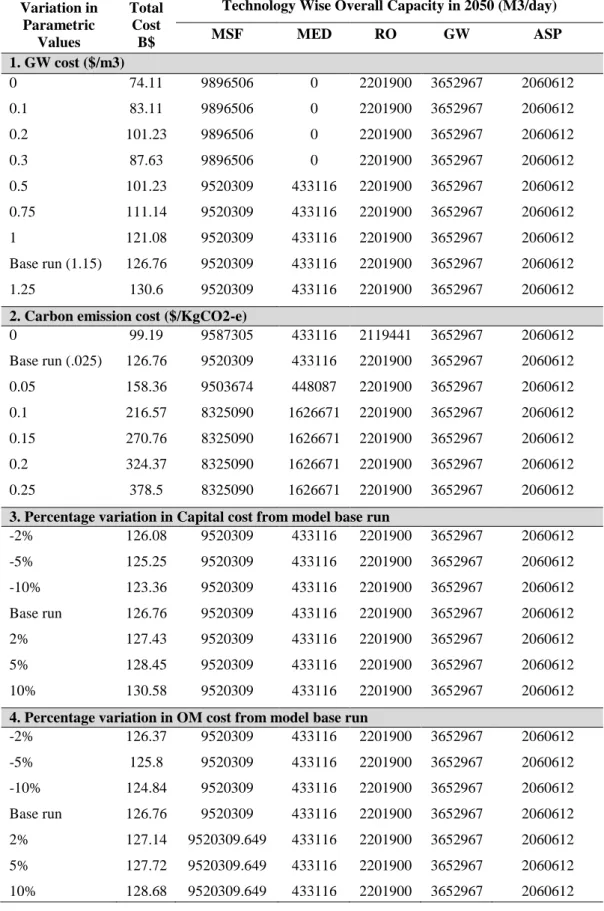
Sensitivity Analysis of Key Parameters
The values of the sensitivity analysis showed that assigning a lower economic value to GW (less than $0.3/m3) does not have much significant impact on the total cost of water planning and infrastructure expansion. When carbon costs were assigned to a value greater than $0.1/kg-CO2-e, they had a major impact on total costs and on the selection of desalination technologies. The results showed a low impact on total costs; for example, an increase of less than 2% for an increase of 10%.
Chapter Summary
A Decision Support System for Sustainable Water Planning in Arid
Development of DSS: SuWaB-AD
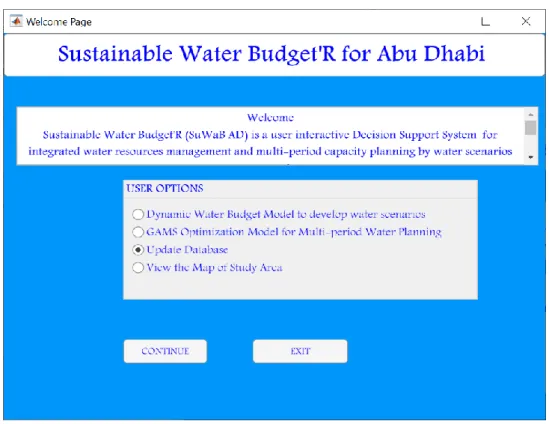
- User Interface of the SuWaB-AD
- Models of the SuWaB-AD
- Database for the SuWaB-AD
The key user controllable inputs incorporated into the SuWaB-AD are discussed in Chapter 5. During the ADWBM run, data generated to run the MILP in the ADWCPM is transferred to the database in the DSS. All data for the study area can be stored in the model's database in the form of spreadsheet rows and columns.
Application of SuWaB-AD
- Simulation of a Water Scenario using ADWBM Module
- Results from ADWCPM Module
- Overall Costs and Breakdown
- Capacity Expansion Plan
- Environmental Indicators
The predicted population by SuWaB-AD using the module included in ADWBM (Kizhisseri et al., 2021) for the SES is shown in Figure 28. The growth of water shortages for the SES obtained from the SuWaB-AD is shown in Figure 31. The total environmental costs are approximately 20% of the total accumulated costs for the planning period.
Chapter Summary
Brine discharge from the various water plants supplying water to Abu Dhabi is addressed by the ADWCPM module and is included in Figure 34. A case study to demonstrate the SuWaB-AD methodology has shown that the tool can be helpful to those making water decisions after to the whole world. In conclusion, the main importance of SuWaB-AD is its utility for policy makers in supporting sustainability plans.
Summary, Conclusions and Recommendations
Summary and Conclusions
Therefore, in the third phase, a set of future water scenarios were simulated to represent different future water conditions in Abu Dhabi (Chapter 4). Thus, in the fourth phase, a multi-period MILP optimization model was developed to determine the necessary capacity expansion path for Abu Dhabi's water sector to meet future water needs with minimal cost, CO2 emissions and brine disposal. The model therefore considered all possible water allocation and supply options feasible under UAE conditions.
Recommendations
Future Improvements
- Future Improvements in ADWBM
- Future Improvements in ADWCPM
In future work, the model can be modified to include the geographic location of new DW plants. The location of new stations can directly affect both transmission losses and local distribution strategies. The model can be reformulated into a multi-objective function that minimizes the total water cost and other target boundaries simultaneously.