The Saudi Insurance Market Report
2021
The General Department of Insurance Control
Table of Content
Insurance Sector Highlights - 2021
• Highlights of the Saudi Insurance Sector 5
• Major Regulatory Developments in 2021 6
Insurance Market Performance - Overall
• Gross Written Premiums 8
• Insurance Penetration 9
• Insurance Density 10
• Gross Written Premiums by Line of Business 11
• Net Written Premiums by Line of Business 13
• Gross Written Premiums by Client Segment 15
• Gross Written Premiums by Geographic Regions 16
• Gross Written Premiums by Distribution Channel 17
• Retention Ratio by Line of Business for General and Health Insurance 18
• Gross Claims Paid by Line of Business 19
• General and Health Net Earned Premiums vs. Net Claims Incurred 20
• Market Profitability 21
• Balance Sheet - Policyholders’ Assets 22
• Balance Sheet - Shareholders’ Assets 23
• Balance Sheet - Policyholders’ Liabilities and Equity 24
• Balance Sheet - Shareholders’ Liabilities and Equity 25
Insurance Market Performance - By Line of Business
• Health Insurance 27
• Motor Insurance 29
• Property/ Fire Insurance 30
• Engineering Insurance 31
• A&L and Other Insurance 32
• Marine Insurance 33
• Energy Insurance 34
• Aviation Insurance 35
Other Market Indicators
• Gross Commissions Incurred by Line of Business 37
• Employees of Insurance Companies by Nationality 38
• Employees of Insurance intermediaries by Nationality 39
• Insurance Market Structure 40
• Capitalization of Insurance Companies 41
Appendix: Data Tables
• Table 1: Gross Written Premiums by Line of Business 43
• Tables 2 & 3: Insurance Penetration and Density 44
• Table 4: Net Written Premiums by Line of Business 45
• Table 5: Gross Written Premiums by Distribution Channel 46
• Table 6: Gross Written Premiums by Client Segments 47
• Table 7: Retention Ratio by Line of Business 48
• Table 8: Gross Commissions Incurred by Line of Business 49
• Table 9: Gross Claims Paid by Line of Business 50
Table of Content
Insurance Sector Highlights - 2021
• The insurance sector witnessed a premium growth of 8.4% in 2021*, with total written premiums reaching SR 42.0 Billion. Protection and Savings and property insurance witnessed notable increases in written premiums
• Percentage of online sales through Insurance companies platform and insurance aggregator channel increased from 6.9% in 2020 to 7.5% in 2021.
• The penetration ratio of the sector to non-oil GDP slightly decreased from 1.92% in 2020 to 1.91% in 2021
• The overall loss ratio increased from 76.7% in 2020 to 83.4% in 2021 as the volume of claims returned to its normal level as before the Covid-19 pandemic
• Overall, the insurance sector made a net loss of SR 47 Million in 2021. The increase in investment income helped offset the impact of operational losses.
• The overall Saudization ratio increased from 75% in 2020 to 77% in 2021
• During the year 2021, two companies, namely. Aljazirah Takaful and Solidiarity Takaful, merged, a development that was in line with the Central Bank's efforts to encourage consolidation and have fewer and stronger companies that are capable of meeting the objectives of Vision 2030 and deliver in line with the Financial Sector Development Program. This will also improve the level of protection offered to policyholders, enhance customer services, benefit from economies of scale, promote creativity in insurance product design and attract talented resources
• Two more binding agreements were signed during 2021, namely between Arabian Shield and Al-Ahli Takaful**, and between Wala'a and SABB Takaful. In addition, Al-Sagr and Gulf-Union-Al-Ahlia announced that they had started initial discussions to explore the possibility of merger
Highlights of the Saudi Insurance Sector
(*) This report is based on the sector data collected from 29 insurance and reinsurance companies.
Major Regulatory Developments in 2021
• The Cooperative Insurance Companies Control Law was amended as part of continuing governmental efforts towards ensuring the sustainability and stability of the financial sector, These amendments are expected to enhance the Central Bank's ability to preserve the rights of policyholders,
beneficiaries and investors
• Rules and regulations in several other areas were improved/issued. Among those, the following two were of particular importance:
– Rules of Forming and Managing Health Insurance Risk Pools through Brokers, which aims to support SMEs by facilitating to their access to adequate insurance coverages at affordable prices
– The Standard Insurance Policy of Medical Malpractice, which sets the minimum coverage to be obtained by medical practitioners to cover against claims of medical malpractice
• As a continuation of the role of the Central Bank to develop insurance industry in the Kingdom, a number of insurance products were introduced, most notably: coverage of self-driving vehicles, third-party liability insurance for a crafters and professional business, private sports insurance product to cover property risks and injuries to players and participants at such sports facilities, and parcel insurance
• Significant progress was made during the year in the 'four phase' implementation road map for IFRS17 issued by the Central Bank. Phase 3 was completed successfully and the sector moved on to the fourth and final phase. A key milestone was achieved in Phase 4 during 2021 as all insurance companies completed the first dry run exercise, with the remaining two dry runs due to be completed in 2022. This new reporting standard is
intended to provide more accurate, transparent and quality information to the users of insurance companies' financial statements
• In addition to the two existing aggregator licenses, approval was granted to two more aggregators to launch pilot programs. Moreover, Health insurance was added to the existing aggregator channels, increasing ease of access particularly for SMEs
Insurance Market Performance - Overall
16,327.4 14,028.4 14,280.7 14,678.3 15,213.9 19,035.5
19,883.4 22,474.9 22,836.8 25,109.3
1,140.3
1,102.7
1,134.9 1,263.6
1,707.2
2017 2018 2019 2020 2021
Gross Written Premiums
Protection Insurance Health Insurance General Insurance 35,014
36,503 37,890
SRMillion
2017 2018 2019 2020 2021 Change
2020-2021 Line of Business SR M % of Total SR M % of Total SR M % of Total SR M % of Total SR M % of Total
Health Insurance 19,035.5 52.1% 19,883.4 56.8% 22,474.9 59.3% 22,836.8 58.9% 25,109.3 59.7% 10.0%
General Insurance 16,327.4 44.7% 14,028.4 40.1% 14,280.7 37.7% 14,678.3 37.9% 15,213.9 36.2% 3.6%
Protection Insurance 1,140.3 3.1% 1,102.7 3.1% 1,134.9 3.0% 1,263.6 3.3% 1,707.2 4.1% 35.1%
Total 36,503.2 100% 35,014.5 100% 37,890.5 100% 38,778.7 100% 42,030.5 100% 8.4%
38,778
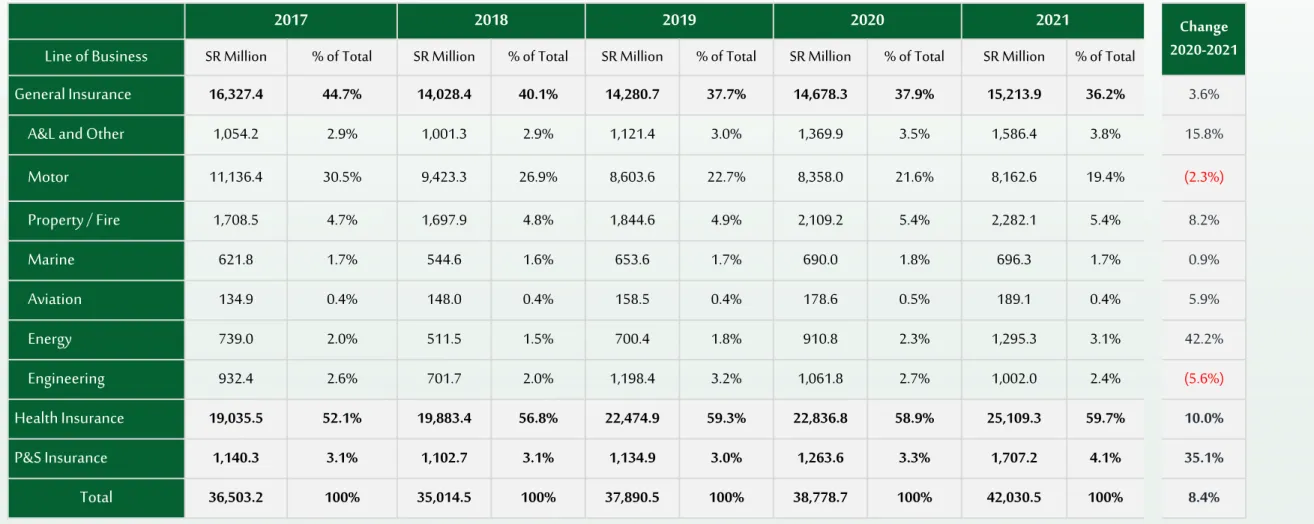
• In 2021, the total Gross Written Premiums grew by 8.4 percent in 2021, reaching SR 42.03 Billion compared to SR 38.78 Billion in 2020
• Health insurance remained the largest line of business in 2021, growing at 10%. Its contribution to total GWP in 2021 reached 59.7%
• General insurance’s contribution to total GWP reached 36.2% in 2021. compared to 37.9% in 2020
• Protection and Savings insurance, representing the smallest line of business, notably increased in 2021 attaining 4.1% share in total premiums
42,030
Gross Written Premiums
0.89% 0.73% 0.70% 0.73% 0.69%
1.04%
1.03% 1.10% 1.13% 1.14%
0.06%
0.06% 0.06% 0.06% 0.08%
2017 2018 2019 2020 2021
Insurance Penetration of Non-Oil GDP (2)
General Insurance Health Insurance Protection Insurance
0.64% 0.48% 0.48% 0.56% 0.49%
0.74%
0.68% 0.76% 0.87%
0.80%
0.04%
0.04% 0.04%
0.05%
0.05%
2017 2018 2019 2020 2021
Insurance Penetration of Total GDP (1)
General Insurance Health Insurance Protection Insurance
Insurance Penetration
-2.7%
1.20% 1.42%
1.27%
-1.5%
1.82%
1.99%
1.87%
1.48%
1.92%
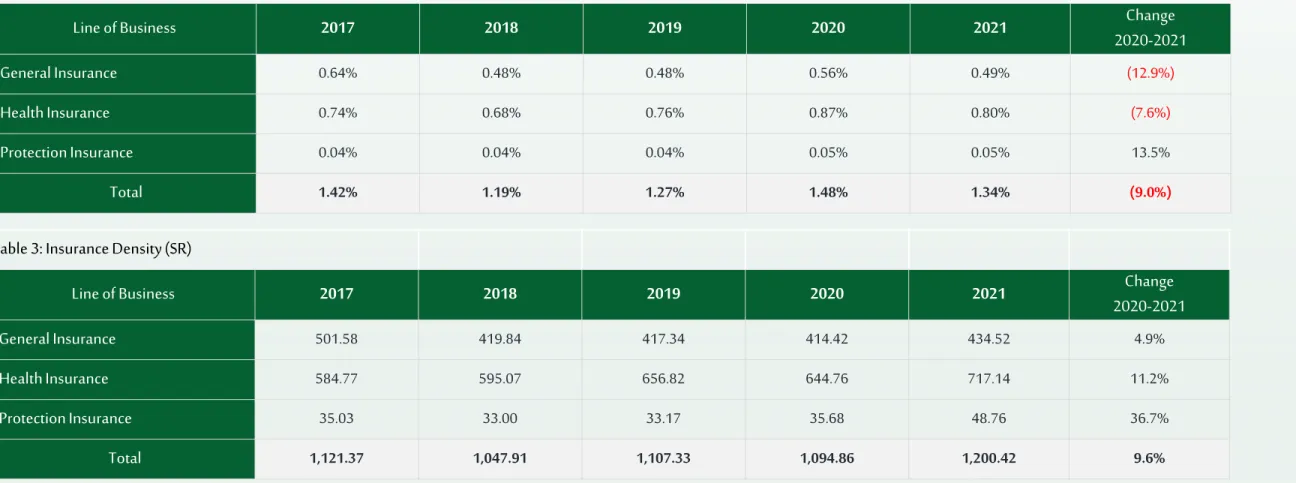
• The insurance penetration (ratio of insurance premium to GDP) decreased from 1.48 percent in 2020 to 1.34 percent in 2021 due to the increase in GDP
• Over the course of 5 years, compound annual growth rate for insurance penetration has been -2.7%
• The penetration of insurance to non-oil GDP reached 1.91 percent in 2021 compared to 1.92 percent in 2020
1.34%
1.91%
Insurance Density
(1)501.58
419.84 417.34 414.42 434.52
584.77
595.07 656.82 644.76
717.14 35.03
33.00
33.17 35.68
48.76
2017 2018 2019 2020 2021
Insurance Density
General Insurance Health Insurance Protection Insurance
1,121
1,048
0.69%
1,107 1,095
• Insurance density is defined as Gross Written Premiums per Capita
• The Insurance density increased by 10% to reach SR 1,200 in 2021 compared to SR 1,095 per Capita in 2020
• Over the course of 5 years, compound annual growth rate for insurance density has been 0.69%
1,200
Gross Written Premiums by Line of Business (1 of 2)
2017 2018 2019 2020 2021 Change
2020 - Line of Business SR M % of Total SR M % of Total SR M % of Total SR M % of Total SR M % of Total 2021
Aviation 134.9 0.4% 148.0 0.4% 158.5 0.4% 178.6 0.5% 189.1 0.4% 5.9%
Energy 739.0 2.0% 511.5 1.5% 700.4 1.8% 910.8 2.3% 1,295.3 3.1% 42.2%
Marine 621.8 1.7% 544.6 1.6% 653.6 1.7% 690.0 1.8% 696.3 1.7% 0.9%
P&S 1,140.3 3.1% 1,102.7 3.1% 1,134.9 3.0% 1,263.6 3.3% 1,707.2 4.1% 35.1%
A&L and Other 1,054.2 2.9% 1,001.3 2.9% 1,121.4 3.0% 1,369.9 3.5% 1,586.4 3.8% 15.8%
Engineering 932.4 2.6% 701.7 2.0% 1,198.4 3.2% 1,061.8 2.7% 1,002.0 2.4% (5.6%) Property / Fire 1,708.5 4.7% 1,697.9 4.8% 1,844.6 4.9% 2,109.2 5.4% 2,282.1 5.4% 8.2%
Motor 11,136.4 30.5% 9,423.3 26.9% 8,603.6 22.7% 8,358.0 21.6% 8,162.6 19.4% (2.3%(
Health 19,035.5 52.1% 19,883.4 56.8% 22,474.9 59.3% 22,836.8 58.9% 25,109.3 59.7% 10.0%
Total 36,503.2 100% 35,014.5 100% 37,890.5 100% 38,778.7 100% 42,030.5 100% 8.4%
• Motor and Health insurance represent 79.1% of total GWP in 2021
• Health insurance including the compulsory and non- compulsory remained the largest line of business in 2021 accounting for 59.7% of total GWP, and experiencing 10% premium growth during 2021
• Motor insurance stood in the second place with a 19.4%
share of total GWP. Its’ gross written premiums decreased by 2.3% in 2021
19,035.5 19,883.4 22,474.9 22,836.8 25,109.3
11,136.4 9,423.3
8,603.6 8,358.0
8,162.6 1,140.3
1,102.7
1,134.9 1,263.6
1,707.2 5,191.0
4,605.0
5,677.0 6,320.3
7,051.3
2017 2018 2019 2020 2021
Other General P&S
Motor Health
Gross Written Premiums by Line of Business (2 of 2)
37,890 36,503
35,014
SR Million
38,778 42,030
Net Written Premiums by Line of Business (1 of 2)
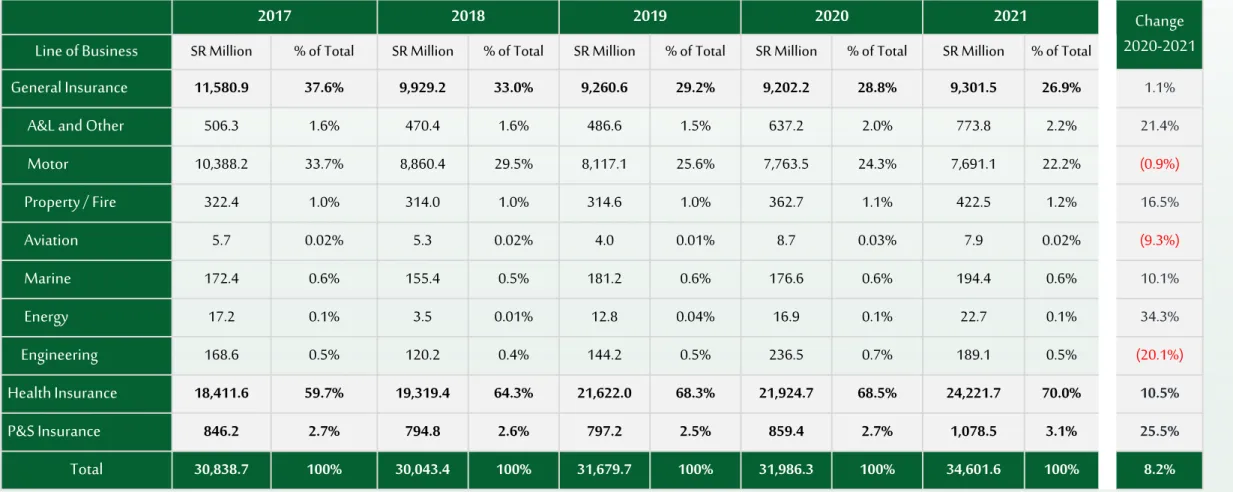
• Net Written Premiums (NWP) is defined as the premiums retained by the insurance company, after the subtraction of the premiums ceded to local or international reinsurers from Total GWP
• Total NWP increased by 8.2% from SR 31.99 Billion in 2020 to SR 34.6 Billion in 2021
• General Insurance (excluding Motor) share of total NWP increased slightly from 4.5% in 2020 to 4.7%
in 2021
• Health insurance accounted for 70% of total NWP in 2021, whereas Motor insurance share was 22.2%
of total NWP in 2021
2017 2018 2019 2020 2021
Change 2020-2021 Line of Business SR M % of Total SR M % of Total SR M % of Total SR M % of Total SR M % of Total
Aviation 5.7 0.02% 5.3 0.02% 4.0 0.01% 8.7 0.03% 7.9 0.02% (9.3%)
Energy 17.2 0.06% 3.5 0.01% 12.8 0.04% 16.9 0.05% 22.7 0.07% 34.3%
Marine 172.4 0.56% 155.4 0.52% 181.2 0.57% 176.6 0.55% 194.4 0.56% 10.1%
Engineering 168.6 0.55% 120.2 0.40% 144.2 0.46% 236.5 0.74% 189.1 0.55% (20.1%) P&S 846.2 2.74% 794.8 2.65% 797.2 2.52% 859.4 2.69% 1,078.5 3.12% 25.5%
Property / Fire 322.4 1.05% 314.0 1.05% 314.6 0.99% 362.7 1.13% 422.5 1.22% 16.5%
A&L and Other 506.3 1.64% 470.4 1.57% 486.6 1.54% 637.2 1.99% 773.8 2.24% 21.4%
Motor 10,388.2 33.69% 8,860.4 29.49% 8,117.1 25.62% 7,763.5 24.27% 7,691.1 22.23% (0.9%) Health 18,411.6 59.70% 19,319.4 64.30% 21,622.0 68.25% 21,924.7 68.54% 24,221.7 70.00% 10.5%
Total 30,838.7 100% 30,043.4 100% 31,679.7 100% 31,986.3 100% 34,601.6 100% 8.2%
18,411.6 19,319.4
21,622.0 21,924.7
24,221.7
10,388.2 8,860.4
8,117.1 7,763.5
7,691.1 846.2
794.8
797.2 859.4
1,078.5 1,192.7
1,068.8
1,143.5 1,438.6
1,610.3
2017 2018 2019 2020 2021
Other General
P&S
Motor
Health
Net Written Premiums by Line of Business (2 of 2)
31,680
30,839 30,043
31,986
34,601
SR Million
% of Total GWP
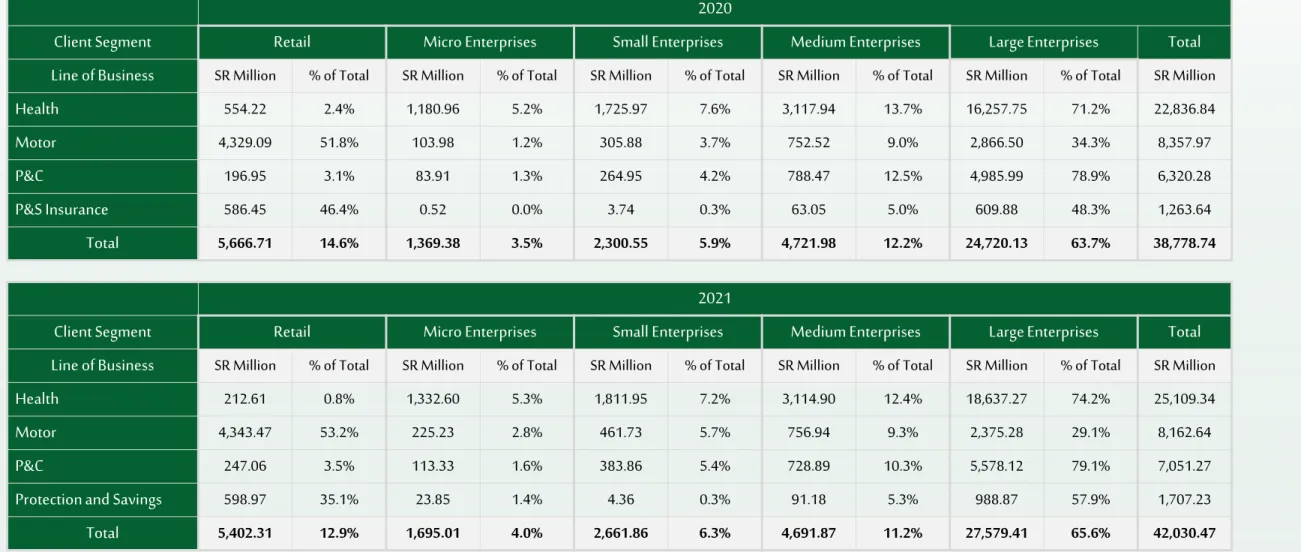
Gross Written Premiums by Client Segment
• Retail insurance GWP totaled SR 5.4 Billion, representing 12.9%
share of total market GWP in 2021. Under motor insurance, individual policyholders represent 53.2% share of total motor premium
• Micro enterprises, small enterprises, and medium enterprises insurance represents 4.0%, 6.3%, and 11.2% share of total market GWP respectively
• Large Enterprises’ insurance represents 65.6% of total market GWP.
Under health insurance, large enterprises’ GWP reached SR 18.64
Billion, representing 74.2% of total health insurance GWP 14.6%
3.5% 5.9%
12.2%
63.7%
12.9%
4.0% 6.3%
11.2%
65.6%
Retail Micro Enterprises Small Enterprises Medium Enterprises Large Enterprises
GWP by Client Segment
2020 2021
% of Total GWP
3.0%
16.0%
31.0%
50.0%
2.7%
19.0%
27.5%
50.8%
Other Eastern Westren Central
GWP by Geographic Regions
2020 2021
Gross Written Premiums by Geographic Regions
• Central region remained the highest in GWP reaching a 51%
share of total GWP in 2021
• Western region stood in second place with a 28% share of total GWP in 2021 even though the decrease of its market share
• Eastern region’s share of total GWP increased from 16% in 2020 to reach 19% in 2021
GWP by Distribution Channel
56% 55%
31% 33%
7% 5.2%
2.4% 1.9%
4.5% 5.6%
2020 2021 2020 2021 2020 2021
insurance company Insurance Broker Agent
GWP By Distribution Channel
Online Direct
% of Total GWP
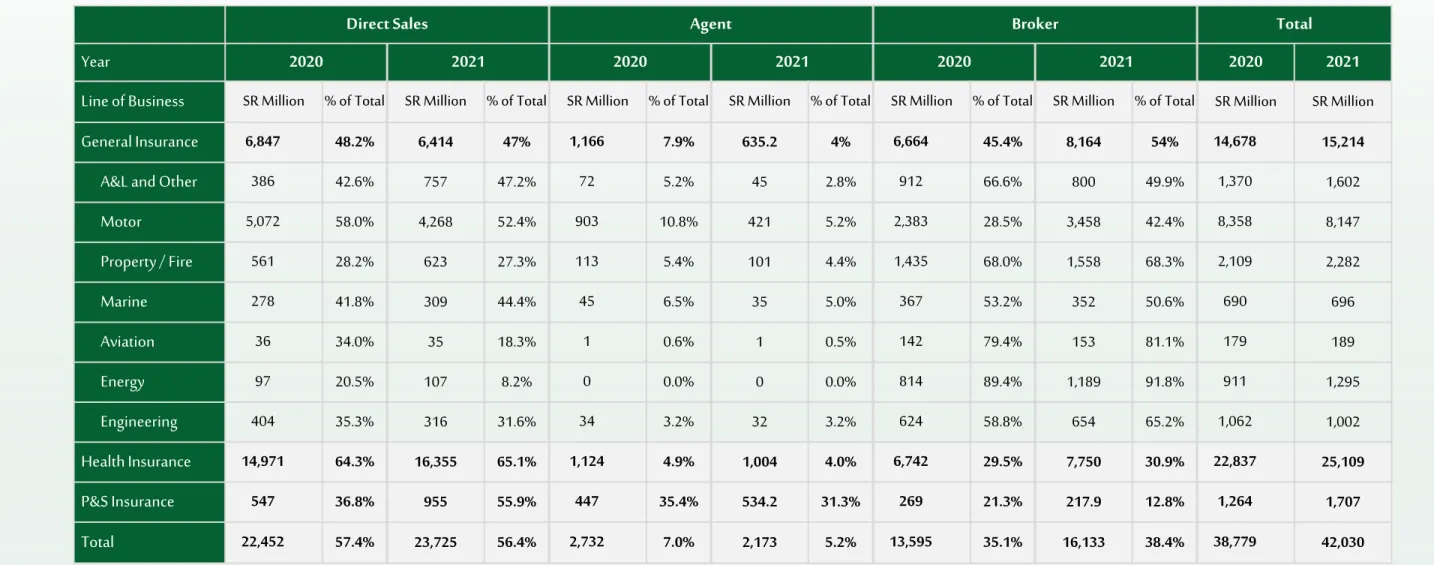
• Sales by Insurance companies remained the largest distribution channel in 2021. Its’ contribution to total GWP in 2021 was 56% compared to 58% in 2020
• Sales through brokers increased from 35% in 2020 to reach 38% in 2021. In addition, online sales through insurance broker increased from 4% to 6% of the total GWP
• Agent Sales dropped from 7% in 2020 to 5% in 2021
96%
94%
49%
28%
19%
19%
4%
2%
96%
93%
47%
26%
22%
17%
5%
2%
96%
94%
43%
28%
12%
17%
3%
2%
0% 20% 40% 60% 80% 100%
Health Motor A&L and Other Marine Engineering Property / Fire Aviation Energy
2019 2020 2021
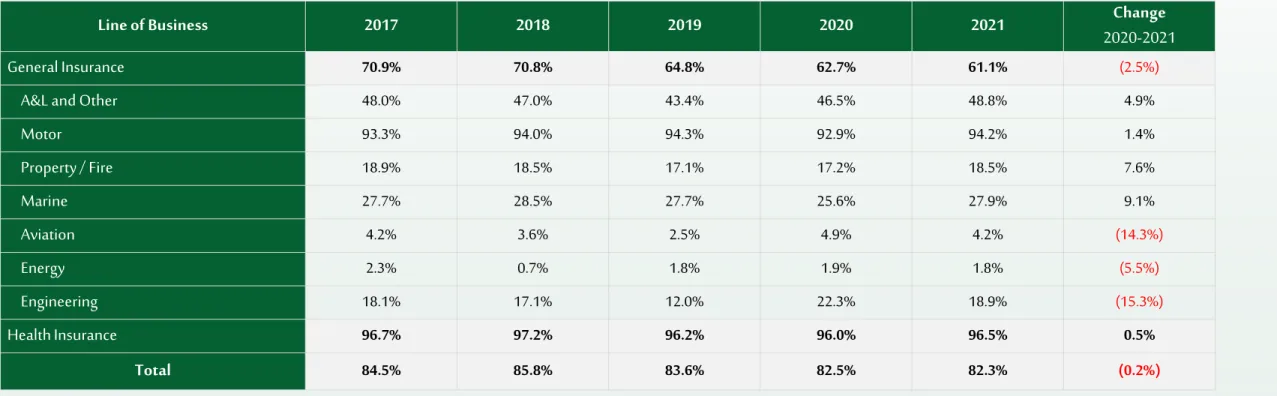
Retention Ratio by Line of Business for
General and Health Insurance
Weighted average excluding Motor and Health insurance30.7%
Weighted average including all lines of business
• The retention ratio measures the written premiums retained by the insurance 82%
company after excluding the reinsurers’ share, which is considered a measure of the net risk carried by the insurer. Retention ratio is calculated by dividing the NWP by the GWP
• The overall retention ratio reached 82% in 2021 compared to 83% in 2020
• The retention for health and motor insurance classes remained high, at 96% and 94% respectively
• For other general insurance classes in aggregate, the retention ratio reached 30.7% in 2021 compared to 23% in 2020
Notes:
• All licensed companies are required to adhere to a minimum retention ratio of 30% of its total insurance premiums (as per Article 40 of the Implementing Regulations)
• Retention ratios are not shown for Protection & Savings insurance as the savings element of the contract must be retained by the company. Therefore retentions
15,479.2 17,628.9 18,540.9 18,664.6 20,217.5 8,314.1
6,929.8 6,507.0 5,478.6
6,842.6
498.5 629.3 578.8
652.2
1,029.9
2,264.2 2,048.8 2,826.5
2,114.2
1,747.8
2017 2018 2019 2020 2021
Other General P&S
Motor Health
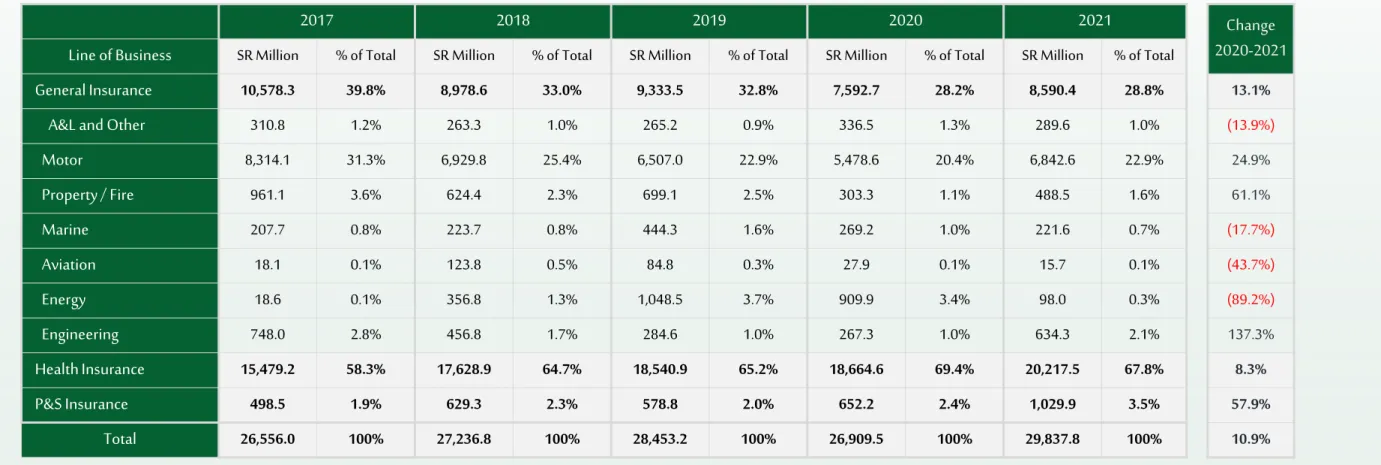
Gross Claims Paid by Line of Business
26,556
28,453 27,236
SR Million
Health Motor P&S Other General
26,910
• Total gross claims paid increased from SR 26.91 Billion in 2020 to SR 29.84 Billion in 2021, which represents an increase of 10.9%
• In 2021, Health gross claims paid increased by 8%
whereas Motor gross claims paid increased by 25% over 2020
• Table 9 in the appendix contains all the gross claims paid data by line of business from 2017 to 2021
29,837
General and Health Net Earned Premiums vs. Net Claims Incurred
29,919 29,211 30,253
30,836 31,773
24,314 24,027 24,769
23,637
26,511 81.3%
82.3%
81.9%
76.7%
83.4%
72%
74%
76%
78%
80%
82%
84%
0 5,000 10,000 15,000 20,000 25,000 30,000 35,000
2017 2018 2019 2020 2021
Net Earned Premiums Vs. Net Claims Incurred
NEP NCI
Loss Ratio %NEP
• Net Earned Premiums (NEP) is equal to NWP minus the change in net unearned premium reserve
• The insurance market’s General and Health NEP totaled SR 31.77 Billion in 2021, compared to SR 30.84 Billion in 2020, an increase of 3%
• General and Health Net Claims Incurred (NCI), is equal to the total of net claims paid plus the change in outstanding and IBNR claims reserve
• In 2021 General and Health net claims incurred increased by 12.2% to reach SR 26.51 Billion
• In 2021 General and Health net Loss ratio increased and reached 83.4% from 76.7% in 2020
SR Million
Market Profitability
• Insurance Operations Income is equal to insurance revenues minus related insurance expenses
• The net income is equal to the sum of revenues minus the sum of expenses and Zakat & Tax
• In 2021, the Insurance Operations Income recorded a loss of SR 1.21 Billion, compared to a profit of SR 551 Million in 2020
• Net Investment Income increased in 2021 by 38.7% reaching SR 1.16 Billion compared to SR 835.4 Million in 2020
• Insurance companies recorded an overall Net Loss of SR 47 Million in 2021, compared to a Net profit of SR 1.39 Billion in 2020
• Return on Assets (ROA) is the ratio of net income (loss) to total assets. In 2021, insurance market’s ROA was -0.07%
• Return on Equity (ROE) is the ratio of net income (loss) to total equity. In
550.6
835.4
1,385.9
(1,205.7)
1,158.7
(47.0)
Insurance Operations Income
Net Investment Income Net Income
SR MILLION
Profitability
2020 2021
(0.07%)
ROA ROE
Insurance Market ROA/ ROE (% of Net Income to Assets/ Equity)
2021
Balance Sheet - Policyholders’ Assets
• Total Policyholders’ assets amounted to SR 47.92 Billion in 2021 compared to SR 46.33 Billion in 2020
• Investments accounted for the largest share of
policyholders’ assets, with a value of SR 18.10 Billion in 2021 compared to SR 17.46 Billion in 2020
• At the end of 2021 insurance companies held SR 4.78 Billion in cash and cash equivalents in their policyholders’
accounts compared to SR 4.88 Billion in 2020
General and Health Insurance Protection and Savings Insurance Total Insurance
2020 2021 2020 2021 2020 2021
Cash and cash equivalents 4,669,582 4,501,823 210,869 276,913 4,880,451 4,778,736
Receivables, net 10,510,947 10,889,410 322,373 390,153 10,833,320 11,279,563
Reinsurance recoverables 8,700,784 8,713,785 521,191 659,370 9,221,975 9,373,155
Deferred policy acquisition cost 845,335 1,086,128 4,878 4,409 850,213 1,090,537
Prepaid expenses 1,497,107 1,656,606 8,624 12,290 1,505,731 1,668,896
Investments 14,198,588 14,440,686 3,261,042 3,655,518 17,459,629 18,096,204
Deposits at financial
institutions 9,138,054 9,400,351 68,141 36,904 9,206,195 9,437,255
Loans - - - - - -
Debt securities and fixed
income 3,593,212 3,551,523 9,888 9,892 3,603,100 3,561,415
Shares (common, preferred) 317,788 436,826 - - 317,788 436,826
Real estate 62,138 60,850 - - 62,138 60,850
Investment in subsidiaries &
affiliates - - - - - -
Other * 1,087,395 991,136 3,183,013 3,608,722 4,270,408 4,599,858
Tangible assets 444,479 483,926 6,143 6,059 450,622 489,985
Intangible assets 79,527 128,941 - - 79,527 128,941
Other policyholders assets 1,018,327 992,646 27,696 22,682 1,046,023 1,015,328
Total
Amount In Thousands
Balance Sheet - Shareholders’ Assets
• Shareholders’ assets amounted to SR 21.76 Billion in 2021 compared to SR 21.32 Billion in 2020
• Investments accounted for the largest share of shareholders’
assets, with a value of SR 17.21 Billion in 2021 compared to SR 15.51 Billion in 2020
• At the end of 2021, insurance companies’ shareholders held SR 2.24 Billion in cash and cash equivalents compared to SR 2.87 Billion in 2020
• Insurance companies’ total assets amounted to SR 69.68 Billion in 2021 compared to SR 67.64 Billion in 2020
Amount In Thousands
2020 2021
Cash and cash equivalents 2,868,429 2,235,347
Receivables, net 295 215,469
Investments 15,510,237 17,208,392
Deposits at financial institutions 7,516,955 7,907,406
Loans - -
Debt securities and fixed income 4,037,497 5,026,692
Shares (common, preferred) 1,583,286 1,958,176
Real estate 5,435 314
Investment in subsidiaries & affiliates 215,195 243,355
Other 2,151,869 2,072,448
Tangible assets 375,555 341,692
Accrued interest, rent, income 135,251 151,299
Intangible assets 1,121,397 1,329,044
Distributions due from policyholders account 991,871 120,293
Other shareholders assets 311,995 160,262
Total Shareholders Assets 21,315,029 21,761,797
Total Assets 67,642,521 69,683,142
Balance Sheet - Policyholders’ Liabilities and Equity
• At the end of 2021, insurance companies held SR 34.90 Billion in technical reserves, which consist of unearned premiums, outstanding claims, IBNR and adjustment expense reserves, compared to SR 32.41 Billion in 2020
• Mathematical reserves amounted to SR 3.73 Billion in 2021 compared to SR 3.37 Billion in 2020
• Total policyholders’ liabilities and equity amounted to SR 47.92 Billion in 2021 compared to SR 46.33 Billion in 2020
Amount In Thousands
General and Health
Insurance Protection and Savings
Insurance Total Insurance
2020 2021 2020 2021 2020 2021
Total Policyholders liabilities 41,295,794 42,201,211 4,275,897 4,927,750 45,571,692 47,128,961
Policyholders payables 1,001,986 1,148,223 22,538 20,187 1,024,524 1,168,410
Reinsurance balances payable 1,756,375 2,134,071 88,993 196,497 1,845,367 2,330,569
Technical reserves 31,778,526 34,025,372 628,676 870,576 32,407,202 34,895,948
Unearned premium 16,518,420 18,373,958 125,561 157,884 16,643,981 18,531,841
Outstanding claims, IBNR
and adjustment expenses 15,260,106 15,651,414 503,115 712,692 15,763,221 16,364,107
Mathematical reserves 3,372,983 3,732,910 3,372,983 3,732,910
Other reserves 861,263 685,144 10,556 10,009 871,818 695,153
Unearned reinsurance
commissions 283,354 255,352 2,207 2,409 285,561 257,760
Accrued expense and deferred
income 3,412,480 2,900,073 118,674 58,661 3,531,154 2,958,734 Declared dividend payable
Distribution due to shareholders
account 977,894 140,839 13,977 (20,546) 991,871 120,293
Other policyholders liabilities 1,223,918 912,137 17,293 57,047 1,241,211 969,184
Accumulated surplus 668,880 692,736 86,918 99,645 755,798 792,381
Total Policyholders liabilities and Equity
Balance Sheet - Shareholders’ Liabilities and Equity
• At the end of 2021, shareholders’ liabilities increased to SR 2.89 Billion from SR 2.88 Billion in 2020 and shareholders’
equity increased to SR 18.87 Billion in 2021 compared to SR 18.44 Billion in 2020
• Share capital increased to SR 13.16 Billion in 2021 compared to SR 12.49 Billion in 2020
• Shareholders’ liabilities and equity increased to SR 21.76 Billion in 2021 compared to SR 21.32 Billion in 2020
Amount In Thousands
2020 2021
Total Shareholders liability 2,876,783 2,892,697
Shareholders payables 303,481 209,590
Zakat 1,182,076 1,207,004
Accrued expenses and deferred income 189,100 180,559
Other shareholders liabilities 1,202,127 1,295,544
Total Shareholders equity 18,438,246 18,869,103
Share capital 12,488,539 13,159,539
Statutory reserves 2,726,161 2,921,670
Retained earnings 2,599,571 1,906,002
Other shareholders equity 623,975 881,892
Total Shareholders Liabilities & Equity 21,315,029 21,761,800
Total Liabilities & Equity 67,642,519 69,683,142
Insurance Market Performance By
Line of Business
Health Insurance
MillionSR
• Health insurance, which includes both compulsory and non- compulsory lines, accounted for 59.7% of the 2021 total market gross written premiums (GWP) with SR 25.11 Billion in
underwritten premiums
• Health insurance accounted for 70% of the market’s net written premiums (NWP) as insurance companies retained SR 24.22 Billion of their Health insurance GWP, which was the highest of all business lines representing a 96.5% retention ratio
• Health insurance’s net earned premiums (NEP) registered SR 22.76 Billion, representing 69.3% of the insurance market’s NEP.
• Health insurance’s net claims incurred (NCI) amounted to SR 19.73 Billion, and resulted in a loss ratio of 86.7%
% of Total
GWP NWP NEP NCI
2020 58.9% 68.5% 68.8% 74.1%
2021 59.7% 70.0% 69.3% 72.0%
Retention Ratio Loss Ratio
2020 96.0% 82.6%
22,837
21,925 21,789
17,991 25,109
24,222
22,760
19,735
10.0% 10.5%
4.5%
9.7%
GWP NWP NEP NCI
Health
2020 2021
MillionSR
• Protection and Savings insurance’s GWP totaled SR 1.71 Billion in 2021, which represents a 4.1% contribution to the market’s total business volume
• Protection and Savings insurance accounted for 3.1% of the market’s NWP, as insurance companies retained SR 1.08 Billion of GWP
• Protection and Savings insurance’s NEP registered SR 1.08 Billion, which represents a share of 3.3% of total NEP
• Protection and Savings insurance accounted for 3.3% of total market’s NCI in 2021 and amounted to SR 900.8 Million
% of Total
GWP NWP NEP NCI
2020 3.3% 2.7% 2.7% 2.6%
2021 4.1% 3.1% 3.3% 3.3%
Protection and Savings Insurance
1,263.6
859.4 854.6
640.0 1,707.2
1,078.5 1,077.0
900.8 35.1%
25.5% 26.0%
40.7%
GWP NWP NEP NCI
P&S
2020 2021
Retention ratio and loss ratio are not shown due to the savings part of the
MillionSR
• Motor insurance’s GWP totaled SR 8.16 Billion in 2021, which represents a 19.4% share of total market GWP
• Insurance companies retained 94.2% of their Motor underwritten premiums Motor insurance NWP totaled SR 7.69 Billion
• Motor insurance’s NEP amounted to SR 7.52 Billion and accounted for 22.9% of the insurance market’s NEP
• Insurance companies recorded SR 6.20 Billion in Motor insurance’s NCI and resulted in a loss ratio of 82.5%
% of Total
GWP NWP NEP NCI
2020 21.6% 24.3% 24.5% 21.3%
2021 19.4% 22.2% 22.9% 22.6%
Retention Ratio Loss Ratio
2020 92.9% 66.6%
Motor Insurance
8,358.0
7,763.5 7,761.9
5,171.5 8,162.6
7,691.1 7,517.2
6,199.6 (2.3%)
(0.9%) (3.2%)
19.9%
GWP NWP NEP NCI
Motor
2020 2021
MillionSR
• Property/ Fire insurance’s GWP totaled SR 2.28 Billion in 2021, which represents a 5.4% share of total market GWP
• Insurance companies retained 18.5% of their Property/ Fire insurance premiums, as the business line’s NWP amounted to SR 422.5 Million. Property/ Fire insurance contributed 1.2% to total market NWP in 2021
• Property/ Fire insurance’s NEP amounted SR 400.4 Million
• Insurance companies recorded SR 189.3 Million in Property/ Fire insurance’s NCI, and resulted in a loss ratio of 47.3%
% of Total
GWP NWP NEP NCI
2020 5.4% 1.1% 1.0% 0.7%
2021 5.4% 1.2% 1.2% 0.7%
Retention Ratio Loss Ratio
2020 17.2% 49.9%
Property/ Fire Insurance
2,109.2
362.7 322.8
161.1 2,282.1
422.5 400.4
189.3 8.2%
16.5% 24.0%
17.5%
GWP NWP NEP NCI
Property / Fire
2020 2021
MillionSR
• Engineering insurance’s GWP totaled SR 1.0 Billion in 2021, which represent a 2.4% contribution to total market GWP
• Insurance companies retained 18.9% of their Engineering
underwritten premiums. Engineering insurance NWP amounted SR 189.1 Million
• Engineering insurance NEP amounted to SR 176 Million and accounted for 0.5% of the insurance market’s NEP
• Engineering insurance recorded a loss ratio of 32.5%, with NCI, totaling SR 57.3 Million
% of Total
GWP NWP NEP NCI
2020 2.7% 0.7% 0.6% 0.2%
2021 2.4% 0.5% 0.5% 0.2%
Retention Ratio Loss Ratio
2020 22.3% 21.6%
Engineering Insurance
1,061.8
236.5
181.1
39.1 1,002.0
189.1 176.0
57.3 (5.6%)
(20.1%)
(2.8%)
46.6%
GWP NWP NEP NCI
Engineering
2020 2021
MillionSR
• Accident and Liability (A&L) insurance includes the following lines of business: personal accident, work related, employer’s liability, third party liability, general liability, product liability, medical liability, professional liability, theft & burglary, fidelity, safe burglary inside the premises and in transit and other liability products
• Insurance companies underwrote SR 1.59 Billion in A&L and Other general insurance premiums in 2021
• Insurance companies retained SR 773.8 Million of A&L and Other general insurance underwritten premiums, with a 48.8% retention ratio
• A&L and Other general insurance NEP totaled SR 702.6 Million, which represents a 2.1% contribution to market’s NEP
• Insurance companies recorded SR 245.1 Million in A&L and Other general insurance’s NCI, which resulted in a loss ratio of 34.9%
% of Total
GWP NWP NEP NCI
2020 3.5% 2.0% 1.8% 0.7%
2021 3.8% 2.2% 2.1% 0.9%
Retention Ratio Loss Ratio
2020 46.5% 30.1%
A&L and Other Insurance
1,369.9
637.2
586.2
176.2 1,586.4
773.8
702.6
245.1 15.8%
21.4% 19.8%
39.1%
GWP NWP NEP NCI
A&L and Other
2020 2021
MillionSR
• The Marine insurance line of business includes both marine cargo and marine hull insurance
• Marine insurance GWP totaled SR 696.3 Million in 2021, which represents a 1.7% contribution to market’s GWP
• Insurance companies retained 27.9% of their Marine insurance underwritten premiums, as the business line’s NWP amounted to SR 194.4 Million
• Marine insurance’s NEP recorded SR 188.2 Million, which represents a 0.6% share of market’s NEP in 2021
• Marine insurance’s NCI amounted to SR 77.4 Million. This
resulted in a loss ratio of 41.1% % of Total
GWP NWP NEP NCI
2020 1.8% 0.6% 0.5% 0.3%
2021 1.7% 0.6% 0.6% 0.3%
Retention Ratio Loss Ratio
2020 25.6% 48.5%
Marine Insurance
690.0
176.6 171.7
83.2 696.3
194.4 188.2
77.4 0.9%
10.1% 9.6%
(7.0%)
GWP NWP NEP NCI
Marine
2020 2021
MillionSR
• In 2021, Energy insurance GWP totaled SR 1.3 Billion, which represents a 3.1% share of total market’s GWP
• Energy insurance NWP amounted to SR 22.7 Million, accounting for only 0.07% of the insurance market’s NWP
• Energy insurance’s NEP amounted to SR 21.7 Million, accounting 0.07% of the insurance market’s NEP
• Energy insurance’s NCI amounted to SR 5.7 Million. This resulted in a loss ratio of 26.5%
% of Total
GWP NWP NEP NCI
2020 2.3% 0.05% 0.05% 0.07%
2021 3.1% 0.07% 0.07% 0.02%
Retention Ratio Loss Ratio
2020 1.9% 110.2%
Energy Insurance
910.8
16.9 14.5 16.0
1,295.3
22.7 21.7 5.7
42.2%
34.3% 49.8% (64.0%)
GWP NWP NEP NCI
Energy
2020 2021
MillionSR
• Aviation insurance GWP reached SR 189.1 Million in 2021, a 0.4%
contribution to market’s GWP
• NWP for Aviation insurance reached SR 7.9 Million, resulting in a retention ratio of 4.2%
• Aviation insurance’s NEP totaled SR 7.1 Million, accounting for only 0.02% of the insurance market’s NEP
• Aviation insurance’s NCI amounted to SR 1.6 Million, resulting in a loss ratio of 22.7%
% of Total
GWP NWP NEP NCI
2020 0.5% 0.03% 0.02% 0.002%
2021 0.4% 0.02% 0.02% 0.01%
Retention Ratio Loss Ratio
2020 4.9% -7.0%
Aviation Insurance
178.6
8.7 7.9
-0.6 189.1
7.9 7.1 1.6
5.9%
(9.3%) (10.6%)
(390.2%)
GWP NWP NEP NCI
Aviation
2020 2021
Other Market Indicators
780.8
502.6 521.1 560.2 644.0
762.8
615.8
769.7
1,180.7
894.5 30.5
19.4
52.7
73.9
51.5 299.3
264.9
420.0
456.4
506.6
2017 2018 2019 2020 2021
Other General P&S
Health
Motor
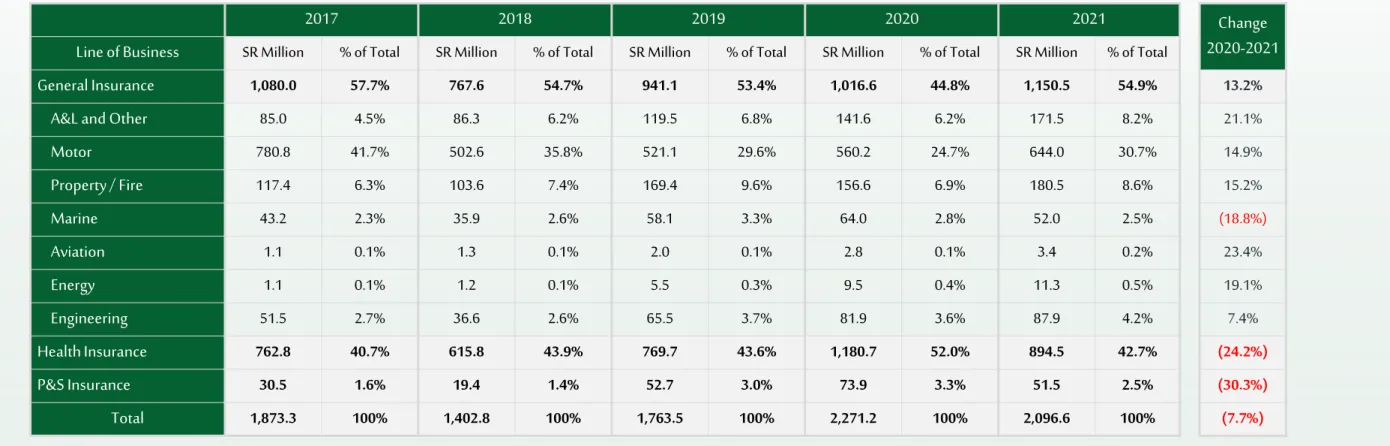
Gross Commissions Incurred by Line of Business
1,873
1,764
1,402
SR Million
Motor Health P&S Other General
Change
2020-2021 15% (24%) (30%) 11%
2,271
• Total commissions incurred amounted to SR 2.10 Billion in 2021, compared to SR 2.27 Billion in 2020, which represents a decrease of 7.7%
• General insurance related commissions accounted for 54.9% of total commissions incurred in 2021
• Health insurance’s share of total commissions incurred represented 42.7% in 2021
• Protection and Savings insurance’s commissions incurred was 2.5% of total commissions incurred in 2021
2,097
Employees of Insurance Companies by Nationality
• The total number of insurance companies’ employees in Saudi Arabia was 10,902 in 2021, compared to 11,015 in 2020
• The ratio of Saudi nationals employed by insurance companies in 2021 increased to 77% of the total workforce
• The Saudization ratio for non-managerial positions in 2021 increased to 80%, while the Saudization ratio for managerial positions increased to 68%
2020 Total
2020
2021 Total
Nationality Non-Managerial Managerial Non-Managerial Managerial 2021
Non-Saudi 1,814 889 2,703 1,724 731 2,455
Saudi 6,645 1,667 8,312 6,921 1,526 8,447
Total 8,459 2,556 11,015 8,645 2,257 10,902
Saudization Ratio 79% 65% 75% 80% 68% 77%
75% 77%
Saudization in insurance sector
65%
79%
68%
80%
Saudization Ratio by Managerial position
Non-Managerial Managerial
2021 2020
Employees of Insurance intermediaries by Nationality
20%
40%
60%
80%
Saudization in Non-Managerial Positions
Saudization in Managerial Positions
Saudization Ratio by Managerial position
74%
2021 Total
Nationality Non-Managerial Managerial 2021
Non-Saudi 1,168 297 1,465
Saudi 4,186 835 5,021
Total 5,354 1,132 6,486
Saudization Ratio 78% 74% 77%
78% 20%
40%
60%
80%
Saudization Ratio
Saudization Ratio
77%
• The total number of employees in insurance intermediaries was 6,486 in 2021
• The percentage of Saudi nationals employed in insurance intermediaries was 77% in 2021
• The Saudization percentage in non-managerial positions in 2021 was 78%, while the Saudization ratio in managerial positions was 74%
Insurance Market Structure
• In 2021, the top 8 insurance companies generated 77.2% of the insurance market’s GWP
• The remaining 21 insurance companies included in the report accounted for the remaining 22.8% of total market premiums
9,583 942
1,116 1,454
2,236 2,339
2,760
10,219
11,382
9,395 782
935 1,418
2,535 1,473
2,733
9,062
10,447
9,859 835
793 1,410
2,421 1,215
2,570
8,376
10,411
0 2000 4000 6000 8000 10000 12000
Gross Written Premiums by Company
Remaining 21 Companies Company 8 Comapny5 Comapny4 Comapny3 Company2 Company1
Comapny6 Comapny7
Capitalization of Insurance Companies
• Insurance companies’ equity increased to SR 18.87 Billion in 2021 compared to SR 18.44 Billion in 2020
Notes: The Law on Supervision of Cooperative Insurance Companies stipulates a minimum capital of SR 100 Million for insurance companies and SR 200 Million for companies that undertake insurance and reinsurance activities
- 2,000 4,000 6,000 8,000 10,000 12,000
(500) - 500 1,000 1,500 2,000 2,500 3,000 3,500 4,000 4,500
Insurance Companies’ Equity vs. NWP
NWP
Shareholders’ Equity Number of Companies
500 M and Above 11
200 M to 500 M 12
150 M to 200 M 1
100 M to 150 M 1
50 M to 100 M 2
Up to 50 M 2
SRMillion