Alberto Doria is currently Associate Professor in Mechanisms and Mechanical Science at the Department of Industrial Engineering at the University of Padova, where he teaches Mechanical Vibrations and Applied Mechanics. Matteo Massaro is currently Associate Professor in Applied Mechanics at the Department of Industrial Engineering at the University of Padova, where he teaches Vehicle Dynamics, Applied Mechanics and Modeling and Simulation of Mechanical Systems.
Final Remarks
Design of a stability enhancement system for an unmanned helicopter based on adaptive control techniques.Appl. Terrestrial laser communication servo turntable control technology through a new digital sliding mode controller. Appl.
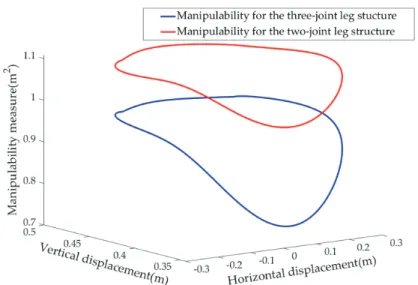
Leg Trajectory Planning for Quadruped Robots with High-Speed Trot Gait
Introduction
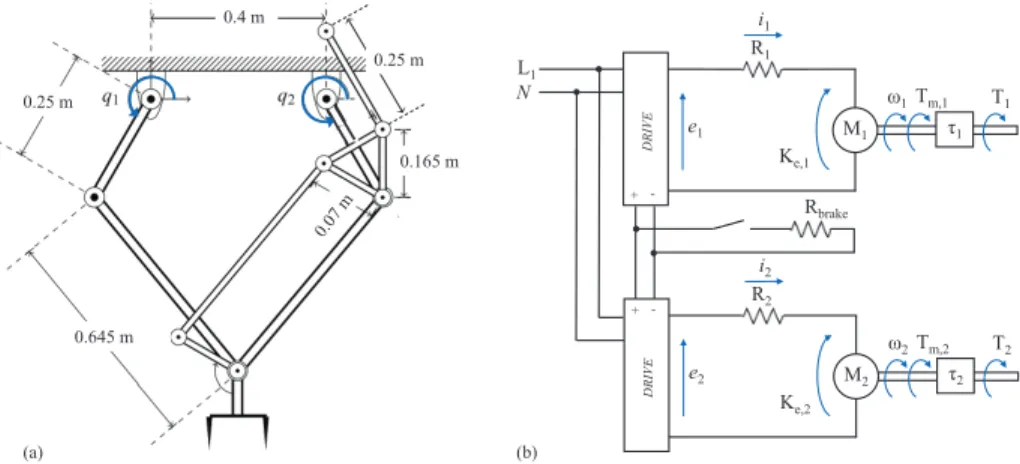
The method of placing the motors on the shoulder is adopted to reduce the inertia of the leg during the swing. Proper foot structure and high efficiency walking path are analyzed and verified on the foot platform.
Materials and Methods
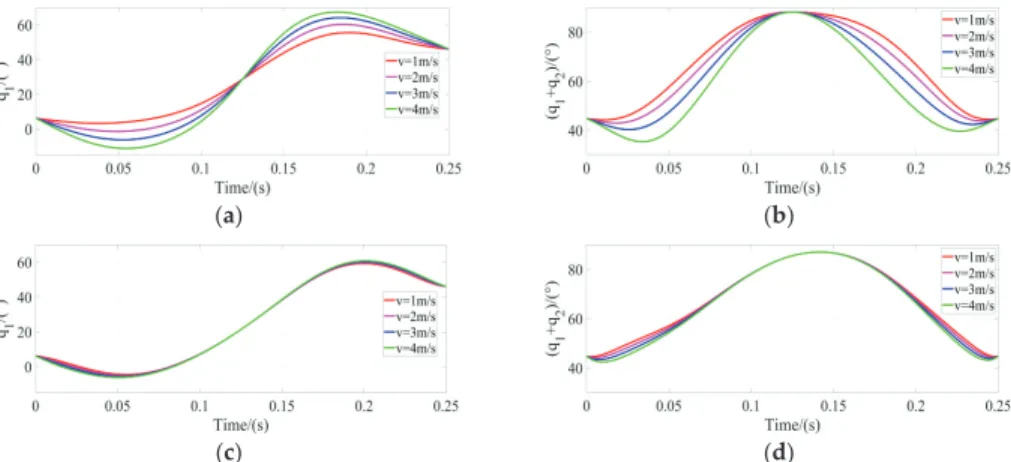
Therefore, it is necessary to confirm the strength of the leg through Finite Element Analysis (FEA). The leg model is shown in Figure 10, where q1 represents the rotation angle of the shoulder part.
Results
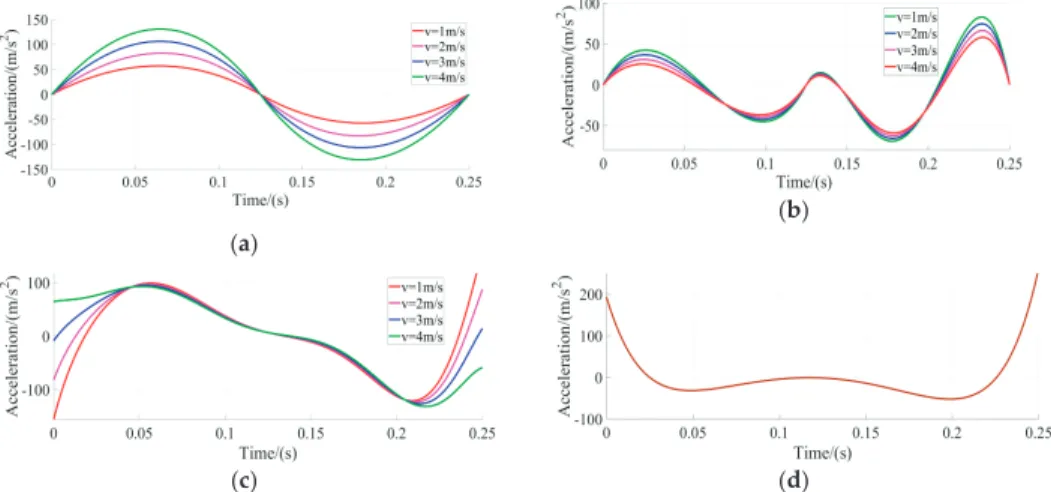
Whether the motion is stable and energy consumption is low are directly related to the efficiency of the trajectory design. In particular, the time traces of leg swing energy with Vdesired=2 m/s for the two schemes can be found in Figure 21.
Discussion
Conclusions
In Proceedings of the 2016 IEEE/RSJ International Conference on Intelligent Robots and Systems (IROS), Daejeon, South Korea, 9–14 October 2016. In Proceedings of the 2017 IEEE/RSJ International Conference on Intelligent Robots and Systems (IROS), Vancouver, BC – 27 September 2016, Canada; pp.
Natural Motion for Energy Saving in Robotic and Mechatronic Systems
Mechanical Design for Natural Motion
The stretched linear spring is hinged to the center of the cam and roller. In this way, the spring is stretched non-linearly in relation to the rotation of the joint.

Design of Desired Natural Dynamics
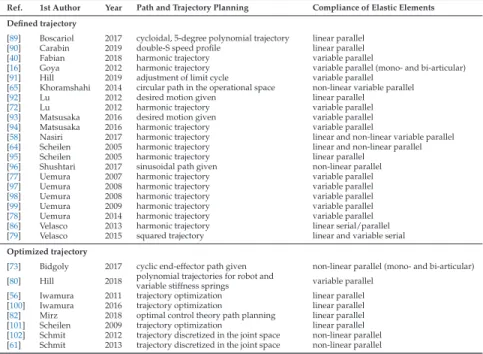
Iwamura [101] simultaneously optimizes the constant linear spring stiffness (mounted in parallel with the actuator) and the joint paths in terms of energy consumption and exploits the optimal control theory. By imposing the system's initial desired position (pick position) and taking a first guess at the spring parameters, the simulator calculates the system positions and velocities after the task time, which are compared to the desired ones (place positions and velocities).
![Figure 4. The 1-DOF mechanism with linear spring used by P. Boscariol et al. [89].](https://thumb-ap.123doks.com/thumbv2/1libvncom/9201446.0/46.723.260.458.328.467/figure-dof-mechanism-linear-spring-used-p-boscariol.webp)
Design Optimization with Natural Motion
A few works use objective functions based on task time and positions [103], end effector position and velocity [81], or position and velocity errors [91]. Results shown in the last column of Table 2 indicate that all assessed approaches to the optimal design problems in natural motion consistently reduce energy consumption.
Discussion
Conclusions
In Proceedings of the IEEE International Conference on Robotics and Automation (ICRA), Shanghai, China, 9–13 May 2011; pp In Proceedings of the IEEE/RSJ International Conference on Intelligent Robots and Systems (IROS), Daejeon, Korea, 9–14 October 2016; page
Study of Personal Mobility Vehicle (PMV) with Active Inward Tilting Mechanism on Obstacle
Multibody Dynamics Model 1. Vehicle Model
1. 1. 1. GHJ GHJ GHJ GHJ䚷GHJ䚷䚷䚷䚷GHJ。
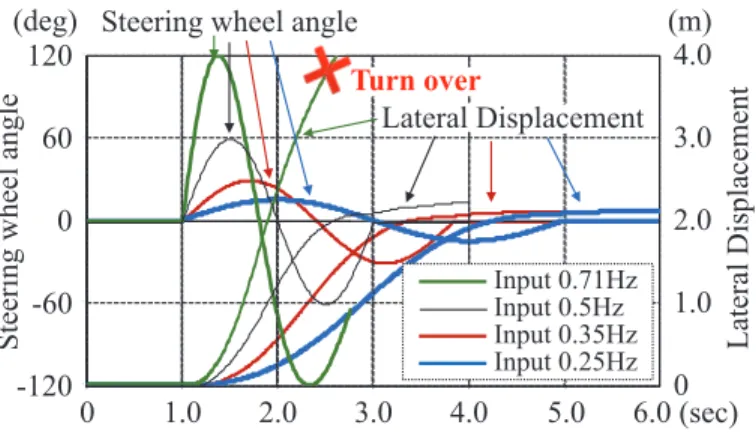
Inner Wheel Lifting Phenomena
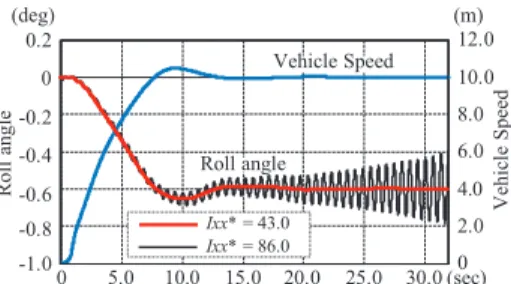
Steering input angle MA in proportion to the square of steering input frequencyf gives maintained LD, as shown in Figure 9. Steering input angle MA inversely proportional to the square of vehicle speed v gives retained LD, as shown in Figure 11. The effects of three-axis moments of inertia on front inside wheel lift-up phenomena by sudden steering inputs were investigated at 36 km/h (10 m/s).
However, since the turning moment of inertia balances dynamically with the turning moment due to lateral acceleration, there is a slight delay in the lateral transfer of vertical loads.
Energy Consumption on Active Tilting System
As shown on the right in Figure 36, energy savings caused by the avoidance of swing resistance occur much more frequently than the energy consumption for tilting. The energy consumption for tilting is only about one-thirteenth of the saving effect of resistance in turning. The energy consumption of an active rocker mechanism is much less than the energy savings due to avoiding roll resistance by using the camber angle.
This shows that there is no need to worry about power consumption with active tilt mechanisms.
Study on Low-Speed Stability of a Motorcycle
Experimental Motorcycle and Methodology 1. Motorcycle Details
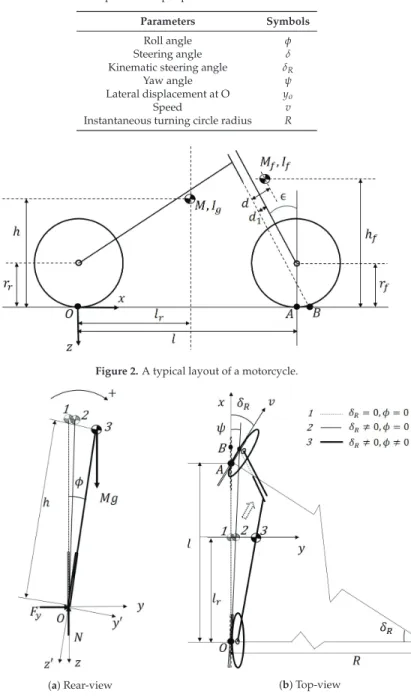
The figure shows that the rider estimates the required input using the motorcycle's state feedback. The objective of the rider is to keep the motorcycle stable while maintaining the reference value of the output parameters (ie, the angle of rotation (φ) to be zero in this case). In this research, the stability of the motorcycle at low speed is studied using theoretical and experimental methods.
The input and output parameters of the motorcycle from the experiments were analyzed using a statistical method.
Linear Motorcycle Model
Initially, the equations for the open-loop and closed-loop systems of the motorcycle were derived for stability in the direction of rotation using a linear model of the motorcycle. The lateral acceleration of the motorcycle about point O is a function of centrifugal force and lateral velocity. Therefore, low speed stability for the open motorcycle system cannot be achieved.
The motorcycle is stable at a point where all the real parts of the eigenvalues are negative for a particular value of τ.
Experiment and Analysis 1. Experiments Details
Second, the theoretical results were validated with the experimental results using the relationship between the steering angle and the roll parameters in equations (12) and (13). Figure 11a shows that the regression correlation between the identified output parameters (i.e. roll angle and roll speed) and steering angle was stronger than the same with steering torque. The lead time and the MCC for the steering torque with the steering angle are shown in Figure 11b.
The steering angle was estimated from the roll angle and the roll speed using the MRA equation (19).
![Figure 6. Steering angle and roll angle curve of a rider normalized in [ − 1,1] range @ 3.1 km/h.](https://thumb-ap.123doks.com/thumbv2/1libvncom/9201446.0/94.723.211.511.417.683/figure-steering-angle-angle-curve-rider-normalized-range.webp)
A Multi-Physics Modeling-Based Vibration
Prediction Method for Switched Reluctance Motors
Vibration of the Switched Reluctance Motor
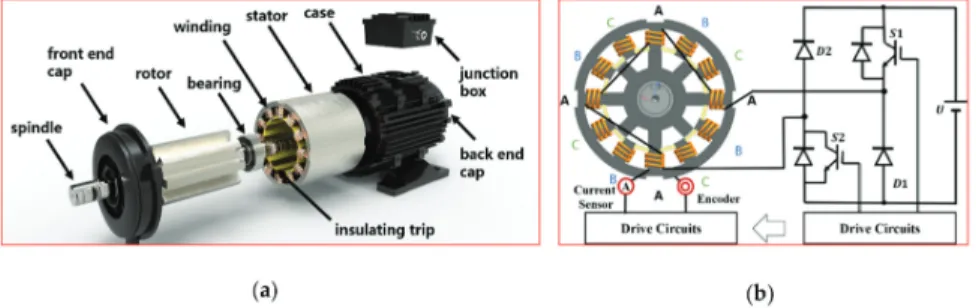
Both the stator and rotor use a salient pole structure formed by laminating silicon steel plates. It is mainly due to the change of the electromagnetic force between the magnetic fields of the air gap of the stator and the rotor. At this time, electromagnetic forces are generated between the stator and the rotor, as shown in Figure 2.
The electromagnetic forces acting on the stator and rotor, FsandFr, respectively, are a pair of forces and reaction forces.
The Proposed Multi-Physics Modelling-Based Method
The algebraic equations of the node function can be obtained by transforming the variation problem into another problem of finding the extremum of the energy function W. The modal identification integrates the constrained modal simulation and takes into account the effects of stator, rotor, shell winding, end cover, bearing, gravity and mounting stress on the rigidity of the installed motor. Solving equations (9) and (10) yields the eigenfrequencies ω and eigenvectors {uf} of each order of modes, which correspond to the eigenfrequencies and modal modes of the vibrational system, respectively.
The motor surface displacement is the displacement of the measurement point, which is on the outer surface of the stator core and directly above the salient pole of any phase (e.g. phase A), as shown in Figure 4.
Experimental Results and Verification
Both stator and rotor in SRM are laminated from the silicon steel plate (grade 50W470). Meanwhile, Figure 9 shows that the flux linkage curve of SRM is non-linear, which is related to the rotor angle and current magnitude. The system modal of the SRM is obtained by using the simulation method presented in Section 3.3.
Test results and torque improvement of 50 kW intermittent reluctance motor designed for hybrid electric vehicles.IEEE Trans.
Dynamics of a Turbine Blade with an Under-Platform Damper Considering the Bladed Disc’s Rotation
Mechanical Model and Dynamics Equations 1. Blade-Damper Model
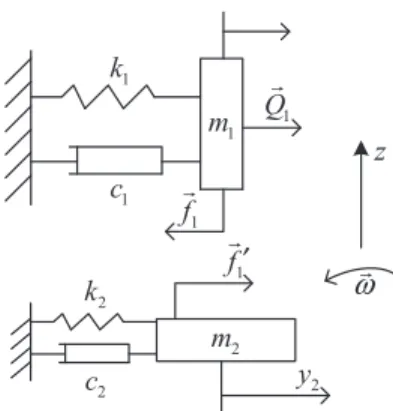
Total equivalent mass of the damper and elastic beam given by the ism2 energy method. In their plan, the damper and platform sizes are neglected when calculating the convective acceleration. In Figure 3, the movement of the damper relative to the blade disc can be approximated as a linear movement along their direction.
Obviously, normal pressure is caused by the normal component of the convective inertia force (centrifugal force) and the Coriolis inertia force of the damper.
Numerical Simulation
In the same way, the response of the leaf before0 can be defined asy1t, and aftert0can be defined asy1s. In Figure 11, EdtandEdsvary with the increase of the damper massm3; some peaks of EdtandEds exist. The influence of damper mass on the reduction of the maximum absolute value of vibration response.
The effect of a damper's vibration stiffness on the vibration reduction of the blade with an under-platform damper was studied.
Conclusions
Literature review of dry friction damper model and analysis method for damping vibration of rotating blade.Adv. Dynamic response of a simplified turbine blade model with dry friction dampers under the platform, taking into account normal load variation. Application. Dissipated energy and boundary condition effects associated with dry friction on the dynamics of vibrating structures.Mech.
An efficient numerical method for computing nonlinear dynamics of structures with dry friction: Application to predict the vibration response of blades with under-platform dampers. Nonlinear Dyn.
Validating the Model of a No-Till Coulter
Assembly Equipped with a Magnetorheological Damping System
Results and Discussion
The analyzes of the RMSE percentage and RMSD showed good agreement between the simulated and the measured outputs. Figures 8 and 9 show the frequency content of the measured and the simulated damper forces, for the driving speed of 10 km h−1 and 12 km h−1 respectively, together with the corresponding coherence, with current inputs of 0.3 A, 0.5 A and 0.7 A applied to the MR damper. A mathematical model was developed of the vertical movement dynamics in the blade assembly with the MR attenuator.
Modeling and simulation of the dynamic performance of a soilless planting assembly with a semi-active damper.

Control Technology of Ground-Based Laser
Communication Servo Turntable via a Novel Digital Sliding Mode Controller
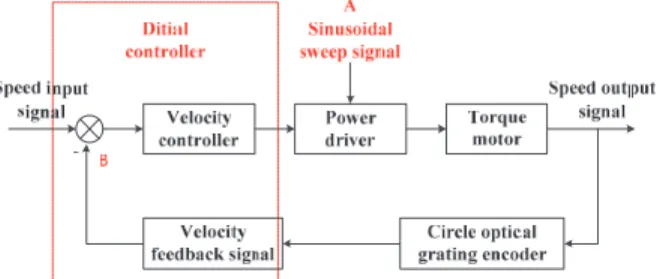
- Model Identification of Ground-Based Laser Communication Servo Turntable 1. System Frequency Domain Characteristic Test
- Design and Simulation of a Velocity Loop Controller Based on Discrete SMC
- Experimental Verification of Control Algorithm
- Conclusion
Converging motion is the state of a system that gradually approaches the sliding mode surface driven by the reaching law. The trajectories of the system from any initial state must arrive at the sliding mode surface driven by the proposed algorithm. According to the discrete state equation of the system, the sliding mode coefficient shown in Equation (12) is a matrix of three rows, so Ce=[Ce1,Ce2,1], the parameters must be chosen as [1,2,1] to satisfy Lemma 1.
The high-frequency noise caused by the sliding mode jitter of the ref is evident in the error curve.
Numerical Investigation on Unsteady Separation Flow Control in an Axial Compressor Using
Detached-Eddy Simulation
- Numerical Approach
- Compressor Test Model
- Results
- Discussion on the Application of PSVC
The vortices separated almost at the trailing edge of the blade in the high flow rate. According to previous studies [9-13], excitation at the vortex shedding frequency had a remarkable effect on control of the flow field. In this section, the generation by the frequency of shower vortices on the separation flow was also carried out.
This can cause the reduction of the working range and increase the loss in the flow field.
Application of Multiple-Scales Method for the Dynamic Modelling of a Gear Coupling
- Model of the System
- Definition of Mesh Stiffness
- Excitation Force
- Forced Response Computation with MMTS
- Forced Response Computed on Test-Cases
It is easy to extract the pair and relate it to the revolution periods of the two gears, namely T1 and T2. As a result, the analytical solution of the modal response up0 (Equation (67)) due to the harmonic of the excitation force P1(t) is derived. The gears are joined by means of a web stiffness of the same type described in Section 3.
Here, the forced response (expressed as P2Pmeasure of the multi-harmonic response developed in the time domain) of the teeth of the two gears, in a certain operating speed range (the reference speed is the speed of G1) where the excitation of the mode shape in Figure 8 occurs, is calculated.