José Cabral Vieira Department of Economics and Business, University of the Azores and CEEAplA, Ponta Delgada, Portuga, [email protected]. Ana Moniz Department of Economics and Management, University of the Azores, Ponta Delgada, Portugal, [email protected].
Research Needs on the Tourist Nexus
Prologue
The increased demand for tourist facilities can in certain places lead to a destruction of the environment which is the source of tourist attraction. The aim of the present volume – the second in a series – is to present a collection of appropriate and sophisticated analysis tools for the study of tourist behavior in a complex local-environmental system from both the supply and demand side.
Organization of the Book
It deals with the use of the model of time-varying parameters in the forecasting of tourism demand. An important trend in modern tourism is the emergence of the aviation sector in the context of modern leisure society.
Retrospect and Prospect
In this context, Susana Teles, Manuela Sarmento and Álvaro Matias offer a contribution on tourism and strategic competition in the air transport industry. The authors, Jean-Christophe Dissart, Francis Aubert and Stéphanie Truchet, aim to assess the importance of tourism in the rural economy.
Due to drastic changes in human behavior – with increased frequency of leisure travel and long-distance movements – tourism is a popular economic sector for enhanced growth initiatives. The range of such impact studies is very diverse and may cover areas such as the attractiveness of tourist areas, the socio-economic effects of tourism, multifaceted policy responses to new tourism challenges, the expected effects of new logistics and electronic services, drastic structural changes in the airline industry (e.g. the emergence low-cost carriers), inclusion of environmental externalities in tourism-economic research, etc.
A Meta-analytic Comparison of Regional
Output Multipliers at Different Spatial Levels
Economic Impacts of Tourism
Introduction
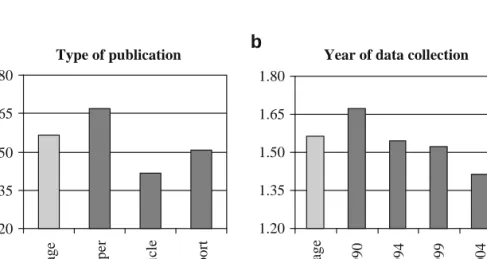
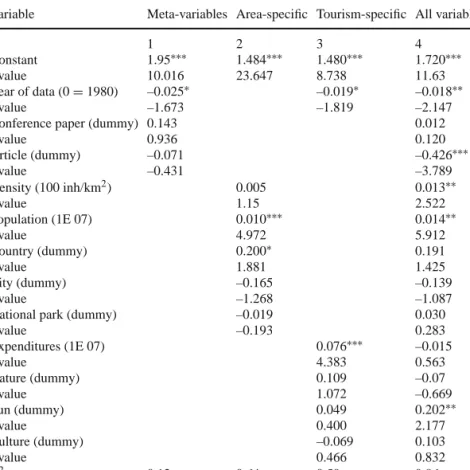
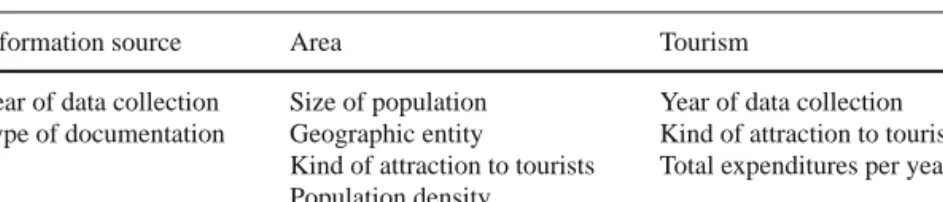
What characteristics of the tourism sector, the research area or the type of publication in which a study appeared can explain variations in the size of the tourism multiplier. 2.4 we explain the order of magnitude of the multipliers, followed by an initial analysis of the empirical data.
Meta-analysis
Since multiplier values reflect the size of the multiplier effect with respect to a specific feature of the economy, such as income or employment, these values can help policy makers learn something about the size of tourist spending. In meta-analysis, there is often a concern that only studies that have achieved significant and expected results (at least the right sign) are published.
Input–Output Analysis and Multipliers
It is possible that studies using sound methods and good data will not be reported because the results are not as expected (Begg 1994). For a meta-analysis, it is therefore important to be aware of this bias and, if possible, to search for publications in all kinds of fields and from different sources (such as refereed journals, research articles or reports).
Data Analysis of Tourist Multipliers
- The Database
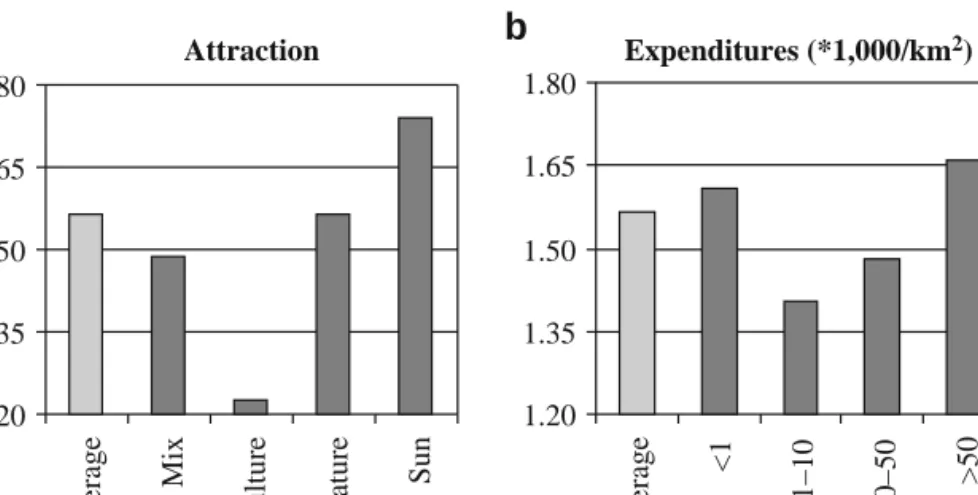
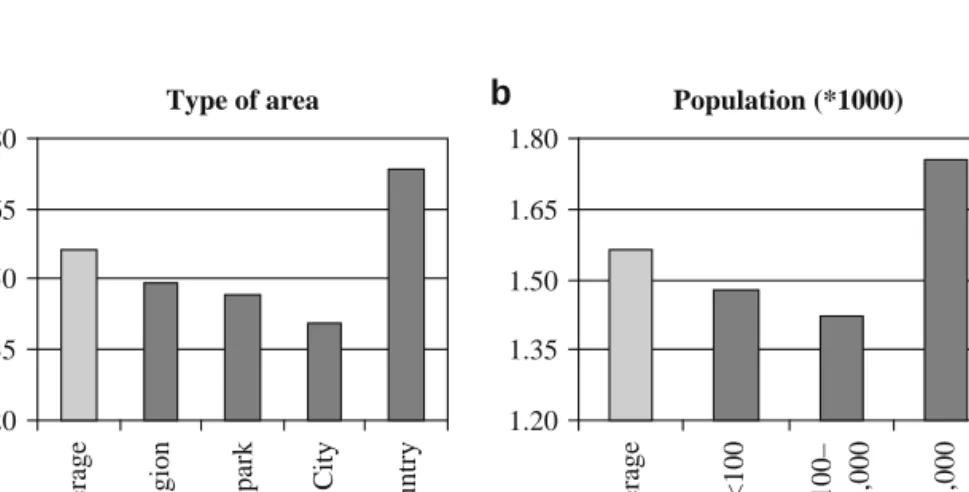
The parts of the studies with the highest population density are related to urbanized areas or cities. Of course, all these figures show only the average values of the multiplier and do not reveal anything about any relationship or coherence between the various indicators and the size of the output multipliers.
Linear Regression Results .1 Introduction
- Results of the Regression Analysis
Therefore, the size of the land area or the size of the population can be expected to have a positive effect on the multiplier. Based on the values of the parameters, we can say that the output multiplier published in an article is 0.43 lower than the multiplier found in an average report commissioned by a client.
Rough Set Analysis .1 Introduction
- The Minimal Set of Reducts
- The Decision Rules
On the other hand, a country with a mix of attractions is related to higher multipliers; apparently the size of the area has a stronger effect than the type of attraction. Finally, the tourism-related rules reaffirm the importance of the year of the data, as well as the attraction variable.
Tourism Multipliers for Dutch Towns
- Expectations Resulting from the Meta-analysis
- Composition of Local Tourism Multipliers
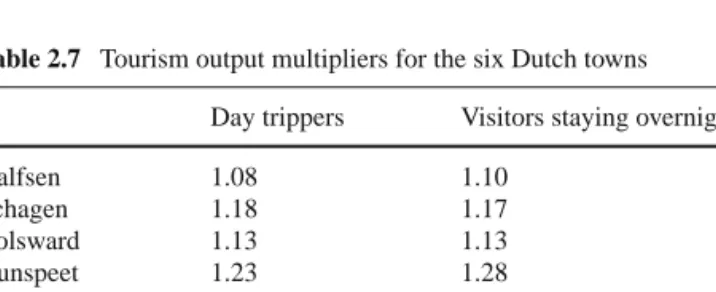
- Tourism Output Multipliers for the Six Dutch Towns and their Hinterland
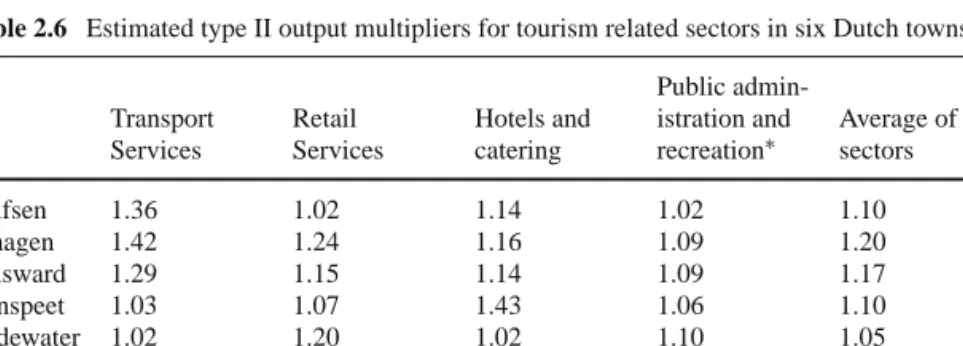
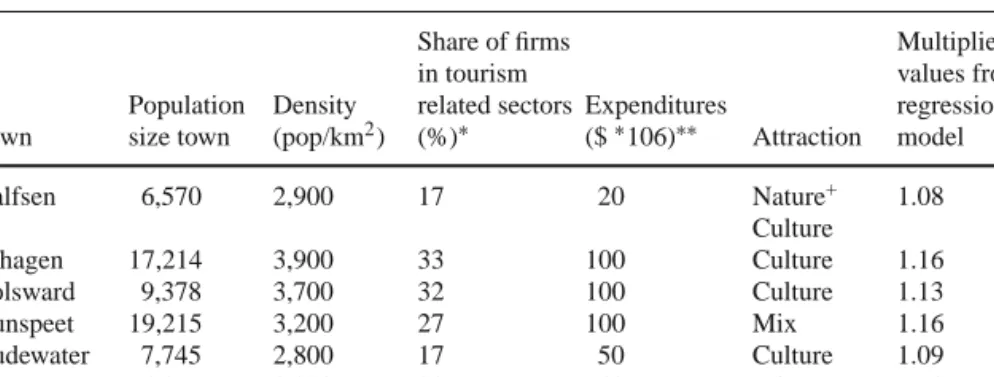
Moreover, Table 2.4 also shows the value of multiplier derived with the help of linear regression model. However, in some of the studies used for the meta-analysis, how tourism multipliers are derived is described.
Conclusions
Although the regression model predicts a relatively high multiplier value (1.16), the actual value is even higher. Furthermore, the multiplier value of Gemert is lower than expected from the regression model.
Publications Used for the Meta-analysis
Dept of Park Recreation and Tourism Resources, East Lansing MI Sun Y, Stynes DJ, Propst D (2002) Economic impact of visitors to Rainier National Park 2000. Dept of Park Recreation and Tourism Resources, East Lansing MI Var T, Quayson J (1985) ) Turismens multiplikatorvirkning i Okanagan.
Attribute Classes When Using Two Equal Classes
Butcher G, Fairweather JR, Simmons DG (2003) Economic impact of tourism on Christchurch City and Akaroa District. Frechtling DC (1994) Estimating the Economic Impact of Travel and Tourism - An Introduction to the Economic Impact Assessment of Travel.
An Optimized System Dynamics Approach for a Hotel Chain Management
Introduction
State of the Art and Theoretical Background
- Data Envelopment Analysis
- System Dynamics
One of the most important characteristics of DEA is its flexibility in the choice of weights for the various inputs and outputs. As long as such a dynamic model is a good representation of the problem under investigation, it runs.
The Model
- Customer Side
- Hotel Management Side
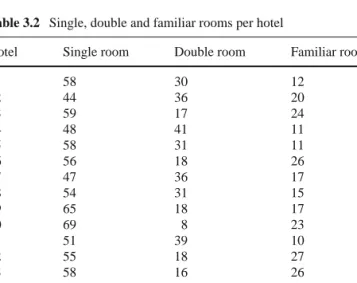
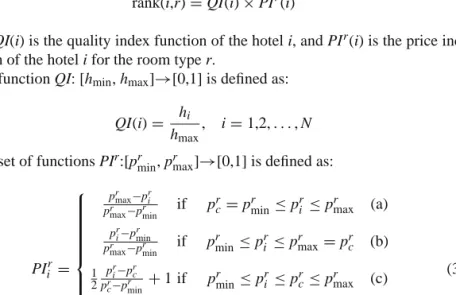
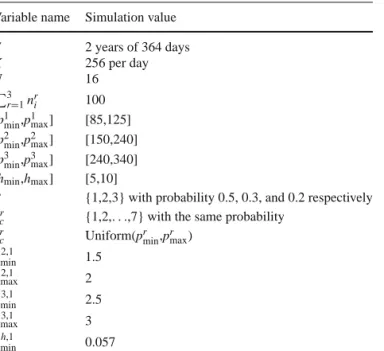
We use to indicate the price of the room type r for the i-th hotel, while prcis is the price the customer wants to pay for the room type r. Let hibe be the hedonics and nri the number of rooms of type r for the ith hotel of the chain.
HOTEL MANAGEMENT
Experimental Results
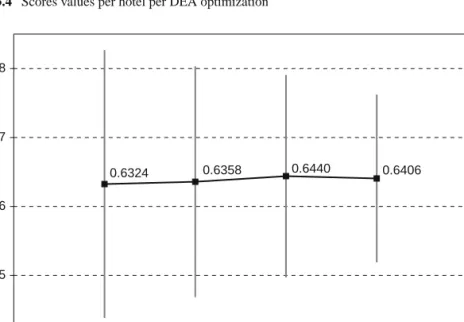
It is clear that from the first semester to the fourth semester there is a significant improvement in the score values obtained. Moreover, this result shows a homogenization of the hotels' revenue efficiency together with the DEA (technical efficiency) score.
Conclusions
Charnes A, Cooper WW, Gollany B, Seiford L, Stutz J (1985) Foundations of data envelope analysis for pareto-merchant efficient empirical production functions. Thanassoulis E, Dyson RG, Foster MJ (1987) Relative efficiency assessments using data envelope analysis: an application to fare division data.
Demand for Tourism in Malaysia by UK and US Tourists: A Cointegration
- Introduction
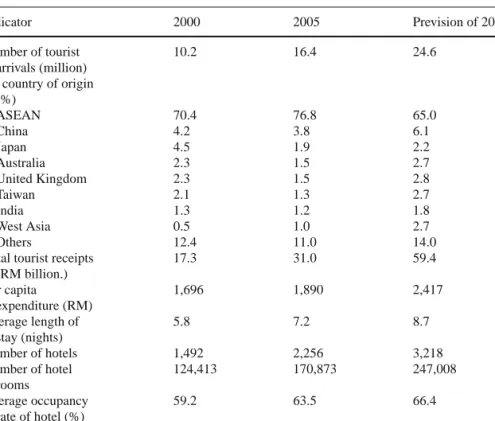
- Overview of the Malaysian Tourism Industry
- Review of Literature
- Data and Methodology
- Unit Root Tests
- Cointegration Tests
- Error Correction Model
- Empirical Results
- Conclusion
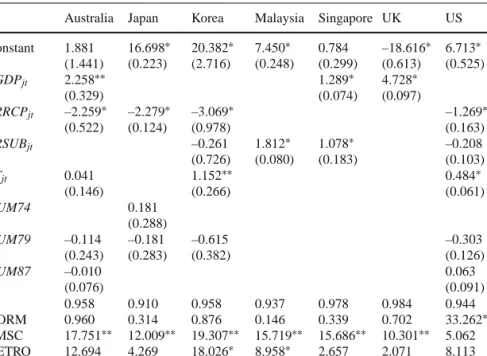
The relative price of tourism in Malaysia is statistically significant in influencing tourist arrivals from both the US and the UK. The results of the error correction model show that income and the relative price of tourism in Malaysia significantly affect tourist arrivals from the US and the UK.
Modelling Tourism Demand in Tunisia Using Cointegration and Error Correction Models
- Introduction
- Determinants of Demand and Model Specification
- The Determinants of Tourism Demand
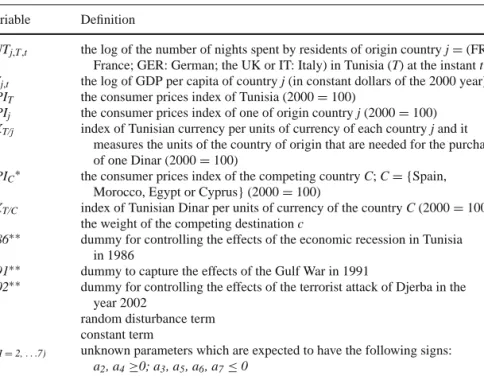
- The Model Specification and Data
- Cointegration Analysis
- Estimation Results by Johansen Cointegration Procedure
- Tests for Weak Exogeneity
- Empirical Results and Policy Recommendations
- Error Correction Models .1 Estimation of ECM
- Graphical Representation of Long-Run Residuals and Dependent Variables in First Difference Level
- Conclusion
In addition, many similar studies on European tourism demand in Mediterranean countries have shown that the long-term income elasticity of tourism demand is high. Finally, the meaning of the dummies points to a high vulnerability of tourism demand in Tunisia in relation to adverse events.
Determinants of Length of Stay – A Parametric Survival Analysis
Introduction
This paper argues that survival analysis, or time-to-event analysis (reading, departure), naturally lends itself to the study of length of stay. To avoid this problem, Gokovali et al. 2007), like this paper, use parametric models for survival analysis to estimate the determinants of length of stay for a sample of tourists departing from a Turkish tourist region.
Determinants of Length of Stay
Several socio-demographic individual characteristics and travel characteristics are found to be statistically important determinants of length of stay and therefore have important policy implications. In fact, it should be noted that repeat visitors show a higher probability of experiencing longer stays, which is in line with the findings in Lehto et al. 2004) who claim that repeat visitors exhibit longer stays.
A Parametric Survival Analysis
- Contextual Setting and Data
- Study Methods: An Overview of Survival Analysis
- Model Estimation and Model Selection
- Results
- Conclusion
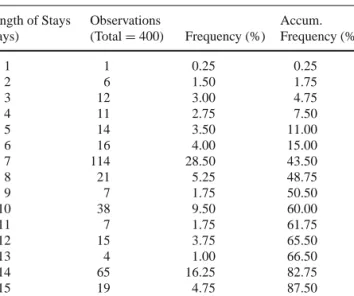
There is therefore no censorship in the data, as all interviewees have reported their length of stay. However, this result for German tourists is only marginally statistically significant in the Weibull model and not statistically significant in the log-logistic model.
Assessment of Tourism Impacts
Is the Time-Varying Parameter Model the Preferred Approach to Tourism Demand
- Introduction
- The TVP Model
- Significance Tests of Forecast Accuracy
- The Morgan-Granger-Newbold (MGN) Test
- The Diebold-Mariano (DM) Test
- The Harvey-Leybourne-Newbold (HLN) Test
- Empirical Results
- Dynamic Elasticity Analysis
- Statistical Test Results
- Summary and Conclusions
The process is repeated until all remaining variables are significant (Song and Witt 2000). Plots of the time series (excluding dummy variables) show that all the variables are trending.
Estimating Tourism Impacts
Using Input–Output and SAM Models in the Balearic Islands
Introduction
Following this well-established tradition, the paper uses a standard IO model to estimate the weight of tourism in the Balearic economy. Estimates of the weight of tourism obtained with the standard IO model are presented in the chapter
The Role of Tourism in the Balearic Economy
The absolute loss of CAIB is 1,052 thousand tourists since 1999 and a drop in the share of CAIB by 3 percentage points. It is clear that the Balearic economy, due to its special structure, is very sensitive to a drop in demand from non-residents.
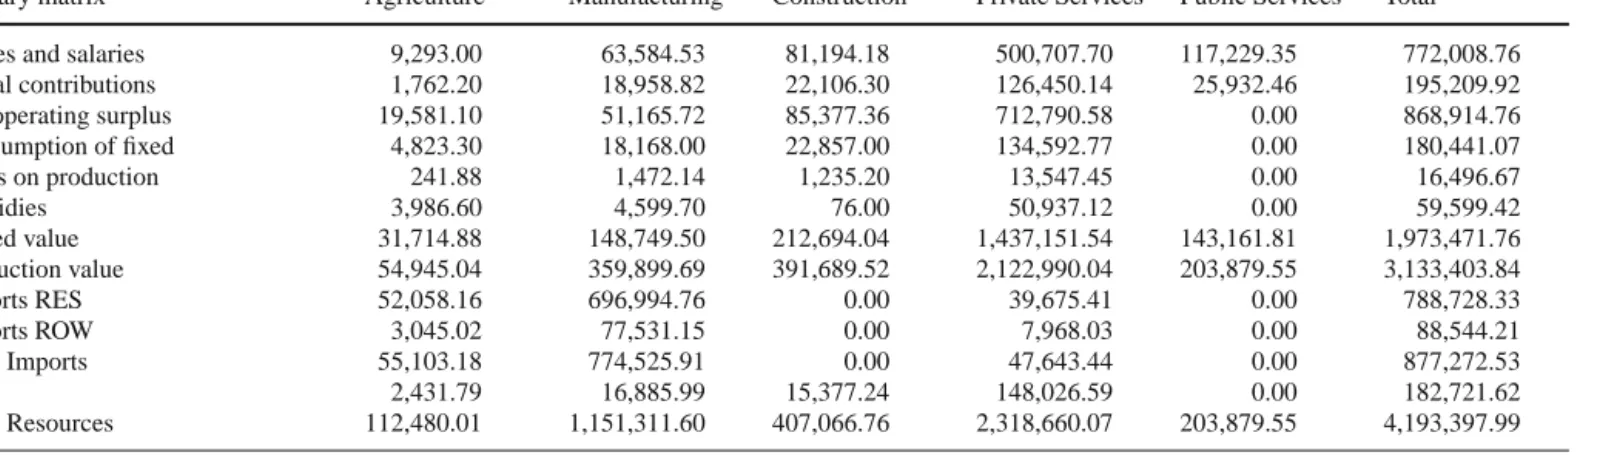
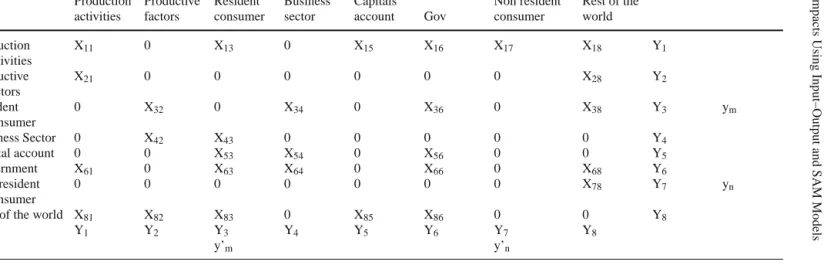
Analytical Framework
It is clear that the peculiar structure of the Balearic economy makes it very sensitive to a decrease in non-resident demand. where AI is the matrix of domestic intermediate input coefficients and the vector of domestic final demand. Their results can be compared with those of the IO model when residents' consumption is endogenous.
The Weight of Tourism in the Balearic Economy
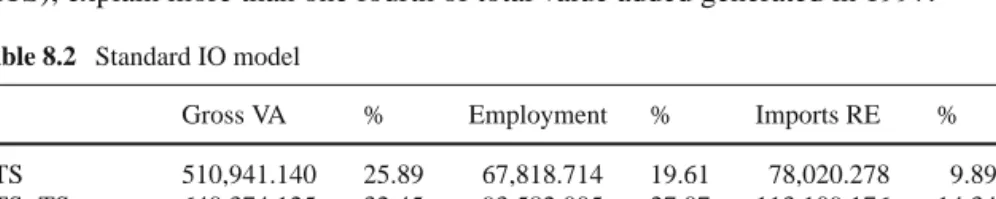
- Standard Input–Output Model Estimates
- Endogenous Residents’ Consumption
- Endogenous Capital Depreciation Investment
To assess the importance of different components of non-resident demand, three partial simulation results are reported in the tables for each model. It is clear that the income generated in the process of meeting the demand of non-residents stimulates the expenditure of residents, which in turn have direct and indirect effects on all sectors of the economy.
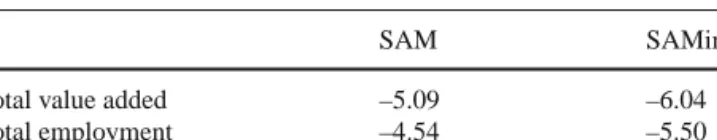
The Effects of a 10% Fall in Non Residents’ Consumption
Thus, a 10% decrease in the heavily tourism sectors, all other things being equal, will result in a decrease in value added that varies from 2.59% with the standard input-output model and 5.12% when both resident consumption and consumption of fixed capital is endogenous. Comparing the figures with the figures in table 8.8, it appears that the effects of a fall in foreigners' consumption are somewhat lower than in the input-output setting.
Conclusions
Adams PD, Parmenter BR (1995) An applied general equilibrium analysis of the economic effects of tourism in a fairly small, fairly open economy. Tohmo T (2005) Economic impacts of cultural events on local economies: an input-output analysis of the Kaustinen Folk Music Festival.
Estimating Tourism Effects on Residents
A Choice Modelling Approach to the Case of Rimini
- Introduction
- The Methodology and the Survey
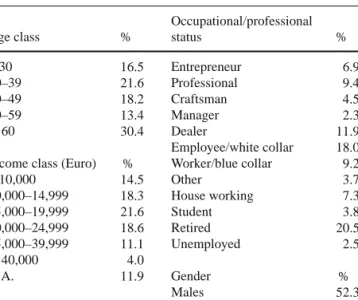
- Residents’ Demographic and Social Characteristics
- Econometric Results
- Conclusion
This reason prompted the inclusion in the research of environmental protection properties. The higher the ratio, the greater the relative weight of the attribute in the scenario.
Willingness to Pay for Airline Services
A Stated Choice Experiment
- Introduction
- Data
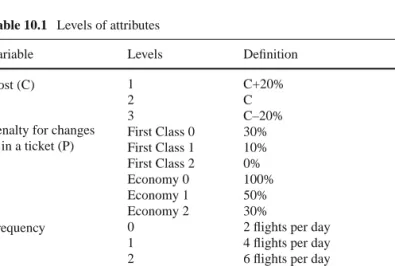
- The Stated Preferences Choice Game
- Descriptive Statistics
- Model
- Benchmark Model
- Microeconometric Model
- Results
- Conclusions
After estimating the models above, it is possible to calculate measures of willingness to pay (WTP) for improvements. To get a sense of the economic importance of these results, we calculate the willingness to pay measures for improvements in the service levels, which are presented in Tables 10.5 and 10.6.
- Introduction
- Brief Literature Review
- Methodology
- Data
- Results and Analysis
- Conclusions
This newspaper uses monthly data on overnight stays in the Azores, segmented by the tourist's country of origin. In the case of the segmented data sample, the lowest MAPE is obtained using the classical decomposition.
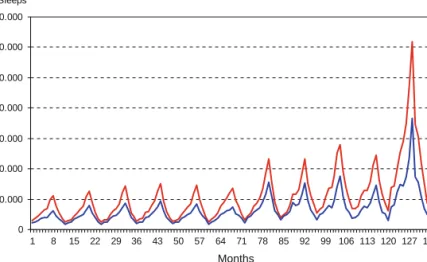
Trends in the Tourist Market