The breadth of the case studies provides a basis for experiences that contribute to a more comprehensive understanding of policy options for improving the resilience of the poor's livelihoods to climate change. A brief history of the development of the climate-smart agricultural approach and its links to climate change.
Case Studies: Policy Response to Improving Adaptation and Adaptive Capacity
Case Studies: System Level Response
Case Studies: Farm Level Response to Improving Adaptation and Adaptive Capacity
Ben Gordon Department of Agricultural and Resource Economics, University of California Berkeley, Berkeley, CA, USA. David Zilberman Department of Agricultural and Resource Economics, University of California Berkeley, Berkeley, CA, USA.
Overview and Conceptual Framework
It also addresses policy issues related to climate change focusing on the implications of empirical findings for the design of effective strategies and policies to support resilience and the implications for agriculture and climate change policies at national, regional and international levels. The IPCC's Fifth Assessment Report released in 2014 found that the effects of climate change are already being felt on agriculture and food security, and negative impacts are most likely in tropical areas where most of the world's poor agricultural populations are located.
1 Overview of the Book
Part I. Conceptual Chapters
The first section provides an overview of international climate change policy followed by an introduction and analysis of CSA and its history. CSA provides a tool to identify locally appropriate solutions for managing agriculture for sustainable development and food security under climate change.
Part II. Country Case Studies
- Vulnerability Measurement and Assessment
- Policy Response to Improving Adaptation and Adaptive Capacity Chapter 10 uses empirical evidence from the Index-based Livestock Insurance
- System Level Response to Improving Adaptation and Adaptive Capacity
- Farm Level Response to Improving Adaptation and Adaptive Capacity
Farmers' perceptions of climate change and adaptation choices are important considerations when designing adaptation strategies. The chapter also discusses the limitations to the adoption of various interventions and the potential for their adoption, and highlights some of the technical and policy implications of current knowledge and knowledge gaps.
Part III. Policy Synthesis and Conclusion
Any dispute relating to the use of FAO works which cannot be settled amicably shall be submitted to arbitration in accordance with the UNCITRAL Rules. Use of the FAO name for any purpose other than attribution and use of the FAO logo shall be subject to a separate written license agreement between FAO and the user and is not authorized as part of this license CC-IGO.
1 Introduction
The Evolution of Climate Change Policy
Developed countries should bear a large part of the responsibility for causing and reducing greenhouse gas emissions. While the EU continued to push for the extension and expansion of the Kyoto Protocol, the US
2 Overview of CSA
In the aftermath of the Hague Conference, two parallel global processes were established regarding CSA policy and science. However, much of the controversy surrounding the CSA concept is related to more fundamental disagreements in global policy debates about climate change and sustainable agriculture.
3 Key Features and Evolution of the CSA Concept
In the next section, we take a closer look at the most prominent of these. 4 CSA Controversies in the Broader Policy Context 4.1 The Role of Carbon Mitigation and Finance in CSA.
4 CSA Controversies in the Broader Policy Context 4.1 The Role of Mitigation and Carbon Finance in CSA
However, the financing flow through these voluntary markets was small compared to that of the formal carbon markets (FAO 2012). At the time of the introduction of the CSA concept, the international carbon offset markets were the largest source of climate finance and therefore much attention was initially paid to its potential to support agricultural transformation in developing countries.
5 CSA and Sustainable Agriculture
The emphasis on the explicit identification of trade-offs in the CSR approach is a response to the lack of such consideration in many of the sustainable agriculture approaches which focus only on the benefits that can be obtained, without ignoring costs and barriers. But the heavy regulatory requirements associated with the development of GMOs have led to the concentration of the industry in the hands of a few large companies (Bennett et al. 2013).
6 Conclusion
At this point there is a greater clarification for the definition of the concept and the methodology for its implementation. Ultimately, the utility of the concept and its implementation will be judged by its effectiveness in integrating responses to climate change into sustainable agricultural development actions on the ground.
Goldstein 2016 “Raising Ambition: State of the Voluntary Carbon Markets 2016” Ecosystem Marketplace Washington DC http://www.forest-trends.org/documents/files/. Scoones, Ian 'The politics of global assessments: the case of the international assessment of agricultural knowledge, science and technology for development (IAASTD)', Journal of Peasant Studies.
An Overview
One mechanism that has received much attention is a carbon sequestration based payment (Seeberg-Elverfeldt et al. 2009). As a first step, the Climate Smart Agriculture (CSA) concept was developed to address the complex issue of achieving sustainable agricultural growth for food security under climate change (FAO Lipper et al. 2014).
2 CSA: The Objectives of the Social Planner
There are a number of potential trade-offs that may arise due to climate change impacts. The dynamic nature of the optimization problem captures the potential trade-offs between choices to improve welfare now versus choices made now to improve welfare under uncertain future outcomes.
3 The Constraints Facing the Social Planner
The ability to adapt to climate change will also be affected by the information dissemination system and the ability of farmers to access weather forecasts and long-term climate forecasts and to incorporate this information into adaptation and management strategies. There is also a need to understand how supply chain innovation works in different regions and how it can be used to introduce new technologies in response to climate change.
4 The Social Planner’s Choice Set
Adaptive capacity is a function of available risk management and risk handling mechanisms, but also includes broader measures to improve decision making under uncertainty. Greater adaptive capacity can increase a system's ability to recover from swings in climatic and biophysical conditions.
5 Towards a Socially Optimal Solution: Expected Features of Model Outcomes
At the system level, adaptive capacity will also be needed to address potential mass migration from areas no longer suitable for agricultural production. Where appropriate and/or external financing is available, adaptive capacity must be built to promote a transition to low-emission strategies for agricultural growth.
6 Concluding Comments
The evolution of agriculture in the future will be determined by its response to climate change. But climate change is just one of the main factors that will change the future of agriculture.
2 The Impact of Climate Change on Agriculture and the Implications
- Rising Temperatures and Migrating Weather
- Rising Sea Levels
- Increased Snowmelt and Timing of Irrigation
- Increased Probability of Extreme Events
- Discussion
In the first part, an overview of the impact of climate change and possible mechanisms of response to it will be given. The timing, extent and locations of the various impacts of climate change are not known with certainty.
3 Innovations for Climate Smart Agriculture
Technological Innovations
- Micro, Farm-Level Approaches
- Farm System Approaches
Technologies for increasing the efficiency of input use Often, there is a significant gap between the level of inputs applied and the amount used by the crop. Weather Information Dissemination Technologies There is significant evidence that the availability of weather information, including its implications for irrigation (evaporative losses), enables farmers to modify their irrigation and pest control strategies, leading to significant increase in yield and water savings and other data (Parker and Zilberman 1996).
Managerial Innovations
- Micro, Farm-Level Approaches
- Farm System Approaches
Insurance products Reduced weather stability due to climate change increases the value of risk management strategies. Therefore, the development of insurance strategies to address climate change must proceed with caution.
Institutional Innovations
- Innovations as Part of CSA Programs
- Institutions for Enhancing Various Adaptation Strategies
Mechanisms to address the increase in migration due to climate change will be a priority for climate-smart policy. According to Docherty and Giannini (2009), there is an urgent need to develop innovative approaches to address the problem of climate change refugees.
4 Overcoming Barriers to Innovation in the Era of Climate Change
Research and Refinement
Many of the technologies needed to adapt to and mitigate climate change are being developed in universities in the developed world. The role of public finance may be more essential in some aspects of the innovation process (eg basic research).
Commercialization/Adoption
One of the biggest obstacles to the introduction of new varieties is regulations that hinder dynamic growth. Unintended Consequences of Conservatism While environmental groups are among the most concerned about climate change and have been at the forefront of developing mechanisms to finance mitigation, they sometimes oppose many innovative technologies and institutions that may be part of the solution to the challenges of climate change.
Discussion
For example, with climate change, some areas considered wilderness will have to be converted to agricultural use.
5 Conclusion
On Modeling and Interpreting the Economics of Catastrophic Climate Change.” The Review of Economics and Statistics 91, no. The economics of climate change in agriculture." Mitigation and Adaptation Strategies for Global Change 9, no.
Case Studies: Vulnerability Measurements and Assessment
The use of climatology identifies the sustainability of alternative crop production, beyond the crops traditionally grown in the region. Therefore, this chapter will focus primarily on the usefulness of the surface moisture product and its applications.
2 Methodology
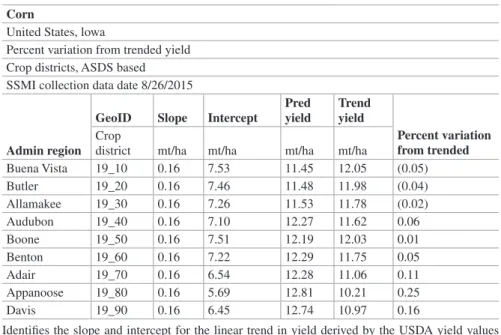
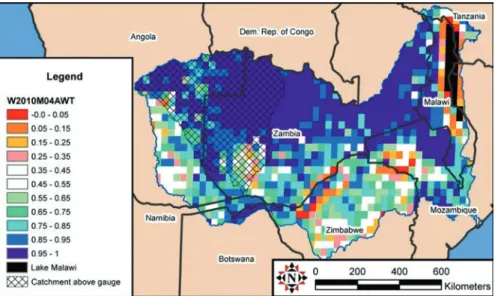
The wetness anomalies have proven valuable in predicting agricultural yields in many parts of the world (Curt Reynold USDA, personal correspondence). Conversely, a value of 0.95 means that it is this wet only 5% of the time in a place and time of year.
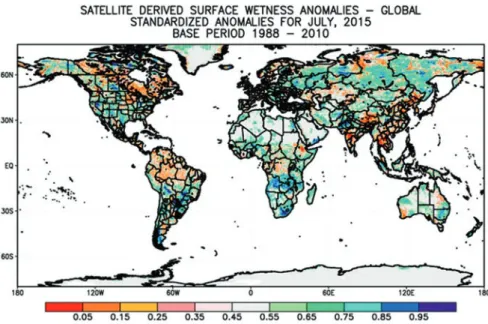
3 Application
Monitoring Crop Yield
The findings of the report present both the deviation from the expected return and the actual return forecast. 4 shows the anomalies for July, which is the most important period in determining the yield.
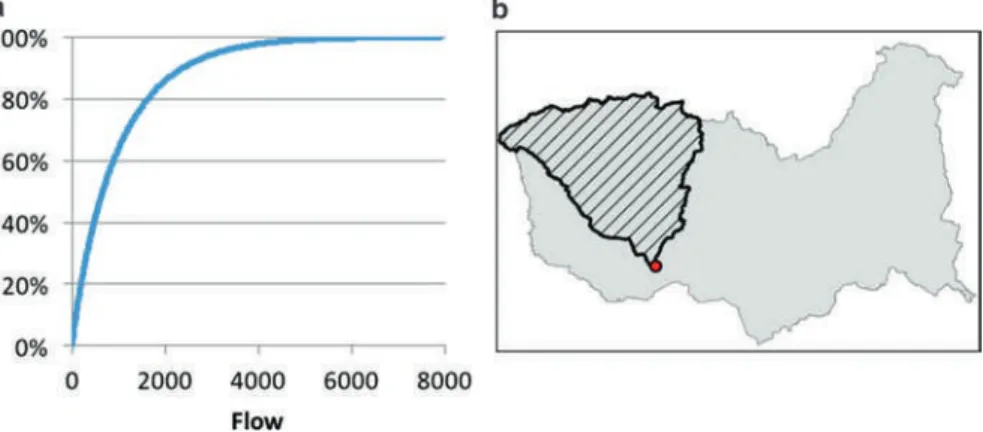
Monitoring River Flow
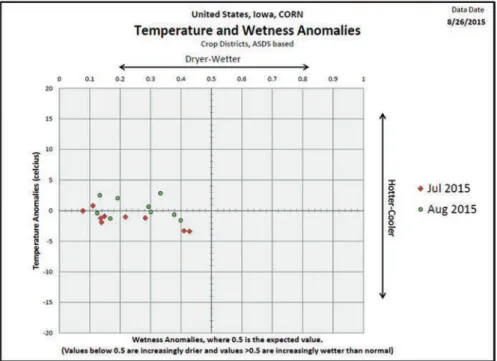
Finally, a scatter diagram of the wetness and temperature deviations for the months of July and August is presented at the crop district level (Fig. 6). Additionally, the BMI provided lead time to the summit of the event, providing a valuable opportunity to implement mitigation strategies.
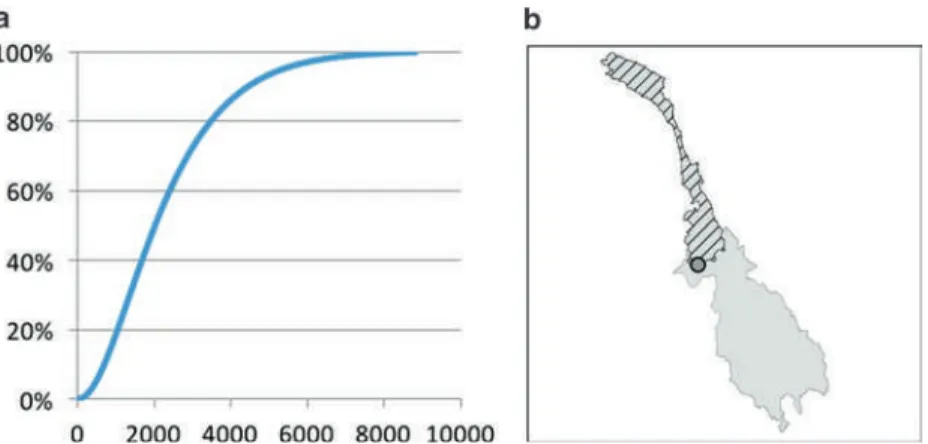
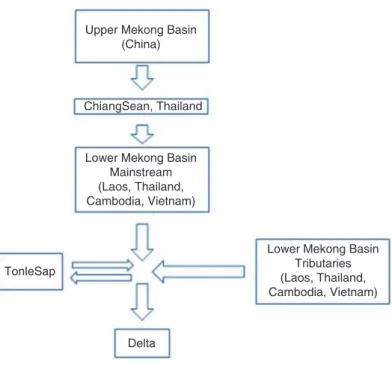
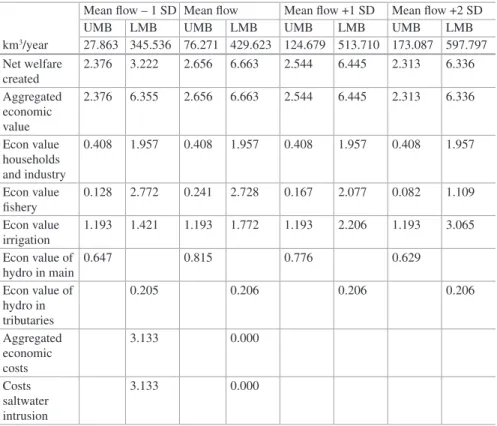
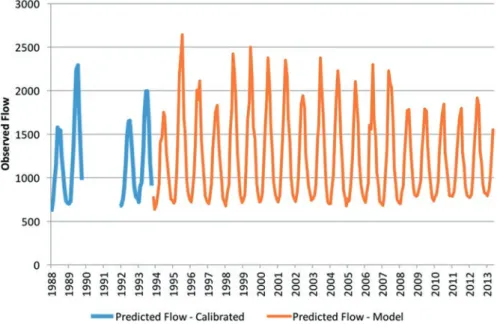
River Basin Management: The Case of the Mekong
- Description of the Model
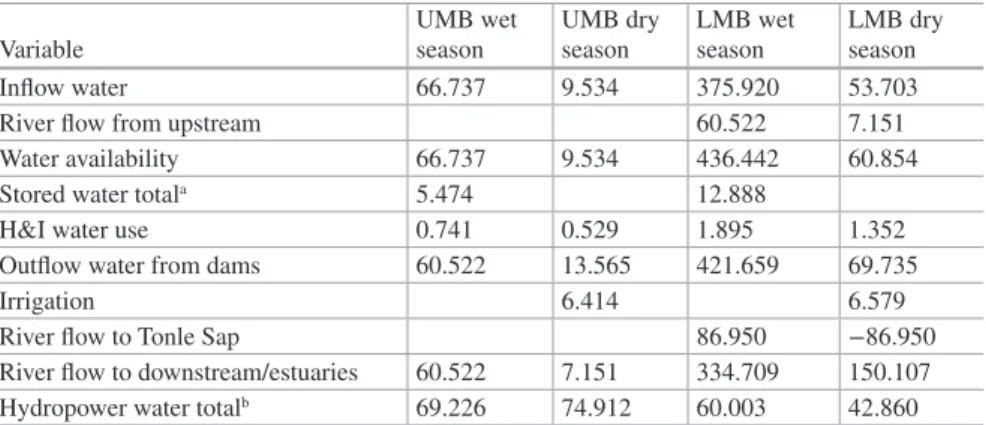
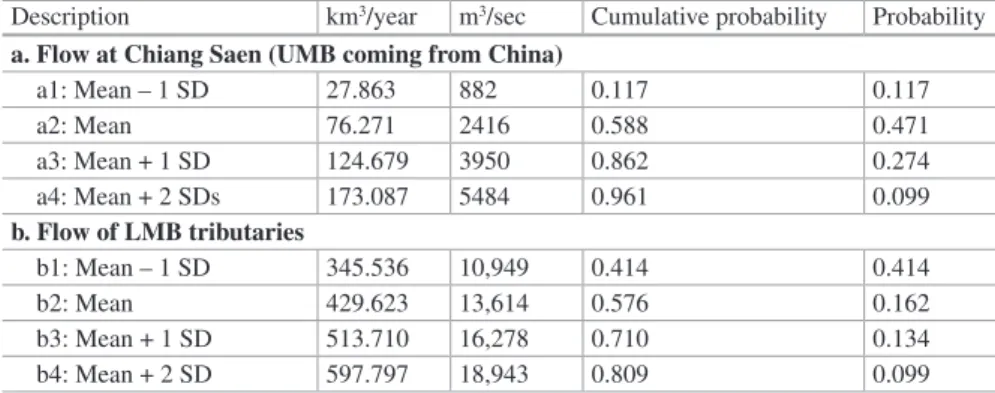
- Applying the BWI to the Mekong Economic Model
- Results of the Economic Model
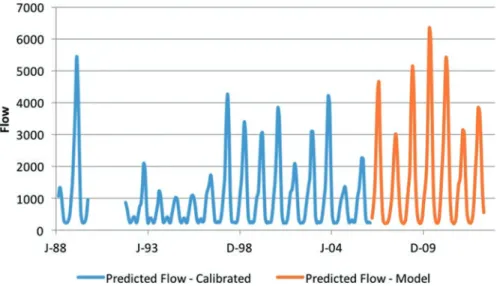
11 Mekong values of runoff (m3/s per month, y-axis) and time (January 1988 to July 2013) show seasonality and interannual variability during calibration (predicted) in the blue (red) period of the time series. However, we wanted to minimize any tuning in order to test the robustness of the model.
4 Concluding Discussion
One of the major obstacles, however, is the confidence of both insurance companies and farmers in the triggering factors. 1999: Accepting the standardized precipitation index: A Calculation algorithm, Journal of the American water resources association.
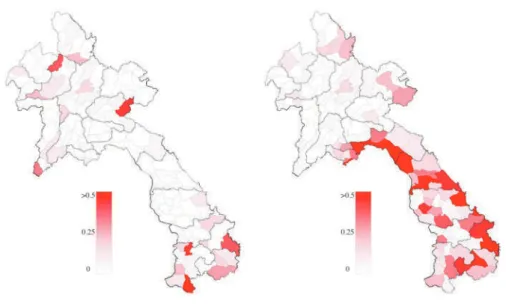
Resilience: Smallholder Rice in Lao PDR
We then review the methodologies used in the literature and discuss the statistical approach used here to estimate the relationship between weather and observed rice yields. Finally, we provide an overview of climate models and use climate projections for our rice yield statistical models to assess the potential impacts of climate change on rice yield in Lao PDR.
2 Background
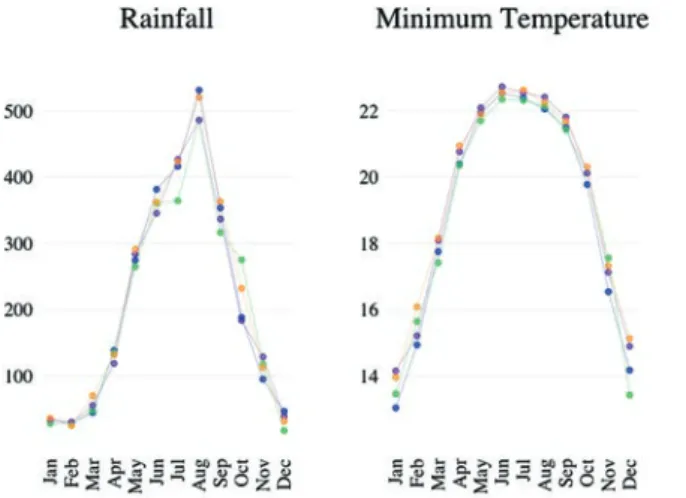
- Overview of Climate Conditions
- Extreme Events
- Rice Production
- Production Systems
- Irrigation
- The Physiological Relationship Between Rice and Weather Inputs
- The Role of Water
- The Role of Temperature
This represents an average annual growth rate of 5.1%, one of the highest in the world. In the early 1990s, it was estimated that 2.1 million ha (or 8.8% of the national territory) were used for slash-and-burn cultivation (Schiller et al. 2001).
3 Analysis I: Estimating the Relationship Between Rice and Climate Change
Methods
- Average Weather Models
- Modeling Extreme Events
District fixed effects control for any unobservable characteristic that varies across districts but is constant over time. Year fixed effects control for any unobservable characteristic that varies across years but is constant across districts.
Data
- Rice Yields
- Weather Conditions
- Extreme Events
- Data Limitations
Consequently, we proceed cautiously using the best available flood countermeasures to assess the impact of flooding on rice production. First of all, detailed rice production statistics have only begun to be collected in recent years.
Results
- Evaluating the Model
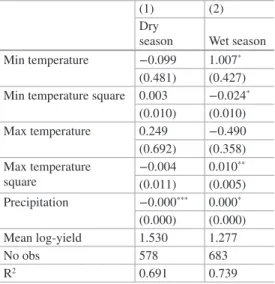
2, we find some evidence that there is a non-linear relationship between temperature and yields as seen in Table 2. The results in Table 2 suggest that elevated daytime temperatures decrease yields up to approximately 24.5 °C, after which they have a positive effect.
4 Analysis II: Projecting Future Rice Production Under Climate Change
Climate Projections
- Selecting GCM Models
- Downscaling Methods
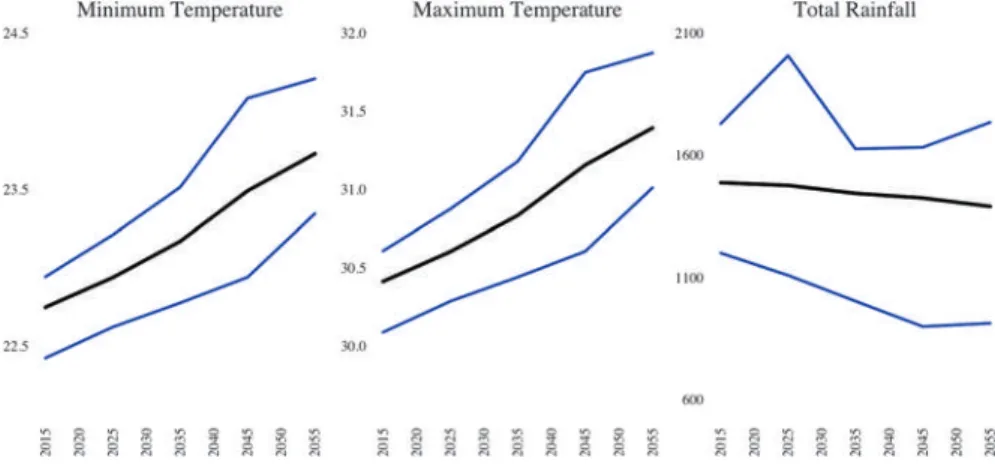
- Climate Projections for Lao PDR
In total, we thus have 42 future climate scenarios, one for each model-scenario pair, each of which can be evaluated over a variety of time frames. This process is repeated for all 42 model-scenario combinations (14 models, 3 scenarios) and the average results are reported as predicted yield changes under climate change for each decade.
Yield Projections
- Methods
- Results
Although computationally tedious, the inclusion of 14 models provides a more representative range of possible future climate conditions, and the high levels of uncertainty associated with predicting future climate. Our models are linear approximations of the yield–weather relationship and thus are best suited to predict how yields respond to perturbations in weather variables only over the observed range of conditions.
5 Summary and Outlook
More concerning are the individuals in the country's mountainous regions that rely on high-altitude production systems. These major shocks can be incredibly damaging, as individuals involved in this production system are most likely unable to become self-sufficient.
6 Conclusions and Extensions
Given that our results rely on this historical data, our model accuracy is tied to the quality of the data. IPCC, "Fourth Assessment Report of the Intergovernmental Panel on Climate Change: Impacts, Adaptation and Vulnerability (Working Group III)." Cambridge University Press, New York.
The Case Study from Thailand and Vietnam
Southeast Asian countries are particularly vulnerable to the downward effects of global climate change due to (i) their long coastlines, (ii) high concentration of human and economic activities in coastal areas, (iii) large and growing populations, and (iv) the importance of agriculture as a source of employment and income (ADB 2009). What determines the farmers' perception of climate change and their decision to adjust agricultural production in response to the effects of perceived climate change.
2 Theoretical Background
The paper proceeds as follows: Section 2 presents the theoretical background for the determinants of individual climate change perceptions and adaptation behavior. More recent models of climate change adaptations have been developed for African countries (Maddison 2007; Deressa et al. 2008; Gbetibouo 2009).
3 Study Regions and Data
The adoption decision is subject to a range of exogenous variables such as household characteristics, socioeconomic and physical factors (Feder et al. 1985). We follow this approach to model the factors influencing climate change perceptions and related adaptation measures, and to explain specific measures for adaptation to climate change.
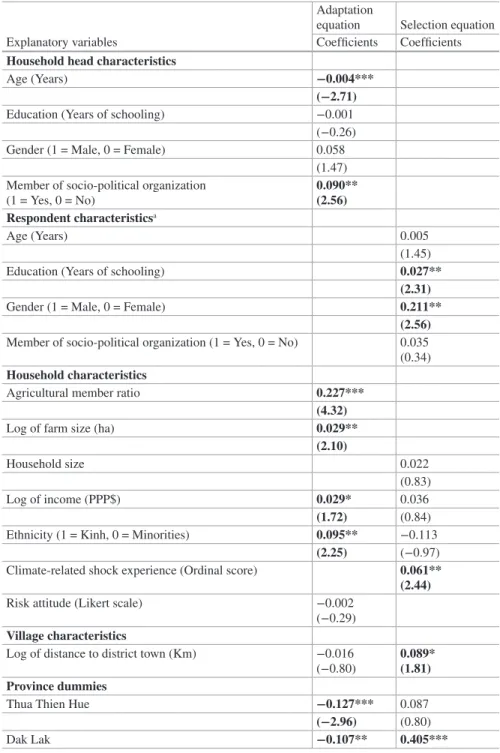
4 Empirical Strategy
Evidence from previous studies shows a positive influence of household head's education on the decision to adapt to climate change (Deressa et al. 2008; Maddison 2007). Membership in a socio-political organization is hypothesized to have a positive effect on the adjustment decision.
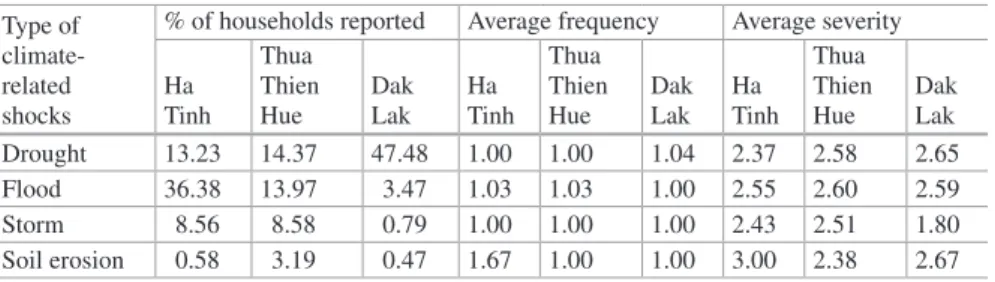
5 Descriptive Results
Overall, of the three provinces in Thailand, Buri Ram province, located in the eastern part of the country and on the border with Cambodia, had the highest number of climate-related shocks reported. In general, the severity is slightly higher in the Vietnamese provinces compared to the provinces in Thailand.
6 Results of Econometric Analysis
This suggests that the multinomial logit model is a suitable specification for modeling farmers' choice of climate change adaptation measures. This is plausible as risk-seeking behavior may make farmers more inclined to undertake climate change adaptation measures.
7 Summary and Conclusions
Report submitted for RETA 6427: A Regional Review of the Economics of Climate Change in Southeast Asia. Contribution of Working Group II to the Fifth Assessment Report of the Intergovernmental Panel on Climate Change.
Climate Change Impacts
Finally, I discuss the magnitude of potential impacts of climate change on corn yield in light of past yield trends. I then present the model results and the associated impacts of uniform warming and provide a discussion of the findings.
2 Data Sources and Summary Statistics
First, I estimate a statistical model of corn yield regressed on weather variables for the US Midwest. 1 Corn yield trends in the US Midwest (Notes: Observations correspond to weighted corn yields for each year.
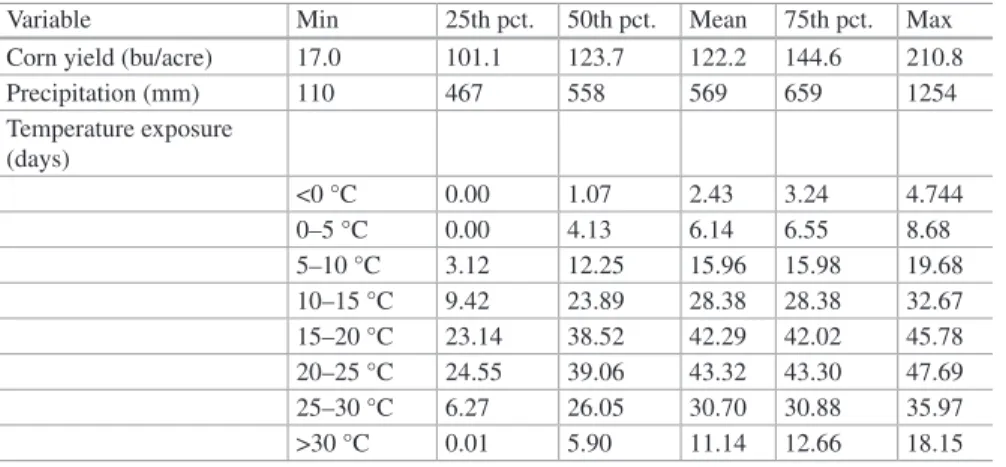
3 Crop Yield Model and Climate Change Impacts
Once the γj parameters are estimated, the marginal effects of temperature exposure can be derived by first multiplying the estimated coefficients by the base matrix. These marginal effects correspond to the marginal effects of each temperature bin on yield.
4 Results and Discussion
Model Results and Warming Impacts
Interestingly, the model predicts increased heterogeneous effects across the sample, as illustrated by the higher variance of predicted impacts for the more severe warming scenario. 4 Maize yield impacts under alternative warming scenarios (Notes: The top row represents the predicted effect of the corresponding warming scenario for each county in the sample.
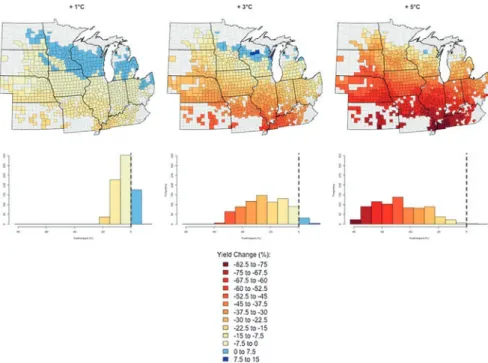
Warming Impacts Against Technological Progress
Roberts and Wolfram Schlenker, “Critical role of extreme heat for corn production in the United States,” Nature Climate Change. Open Access This chapter is distributed under the terms of the Creative Commons Attribution-NonCommercial-ShareAlike 3.0 IGO License (https://creativecommons.org/licenses/by-nc-sa/3.0/ . igo/), which permits any noncommercial use, duplication, adaptation, distribution and reproduction in any media or format, as long as you give appropriate credit to the Food and Agriculture Organization of the United Nations (FAO), provide a link to the Creative Commons license and indicate whether any changes have been made.
The primary objective of this paper is to illustrate how decision support tools can be designed to address the agricultural scale trade-offs associated with changes in climatic conditions. These decision support tools are at the heart of the recommendations called for in the recent U.S.
2 AgBiz Logic as a Decision Support Tool for Addressing CSA
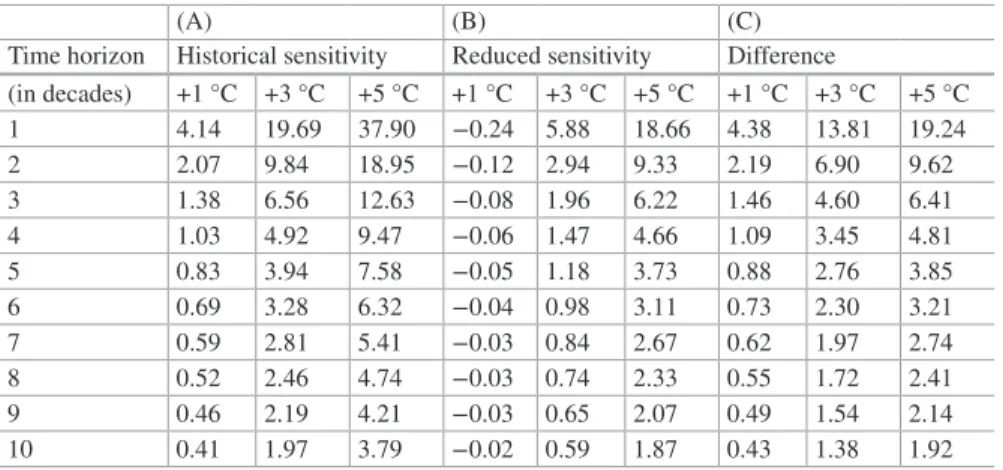
The AgBiz Logic platform provides both a farmer-level decision support tool and an assessment tool for researchers to realistically determine how climate change and climate change policies can and do affect regional agricultural sectors. Reduced climate change information affects predicted yield and production inputs that change over time.
3 Addressing the Farm-Scale Tradeoffs Associated with Changes in Climate
- Initial Setup and Baseline Scenario
- Exploring Climate Change Impacts and Investments in Alternative Cropping Systems
- Profitability of Implementing Investment Strategies
- Assessing Climate Change Implications for Agricultural Leases
The net return is $85 per acre on owned land and $42 per acre on leased land. The NPV of the annual cropping system with the purchase of an additional combine and truck is $500/acre.
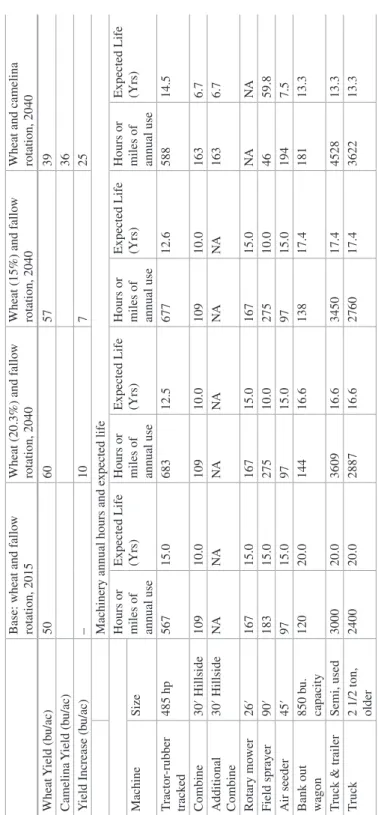
4 Assessing Environmental Impacts
The accumulated net return to the lessee and landowner for a ten-year lease is -$104 and -$40 per acre. For the baseline scenario, since yields and revenues were assumed to be the same between the two systems, the difference in net returns is due to costs.