The manner of their external engagement is different from that of high-income countries. Patarapong Intarakumnerd Technology and Innovation Policy Program, National Graduate Institute of Policy Studies, Tokyo, Japan.
Emerging Challenges for Emerging States
- Middle-Income Trap?
- Early Debate Concerning Development and Underdevelopment
- Globalization and Issues Concerning Emerging States
- How to Cope with the Middle-Income Trap?
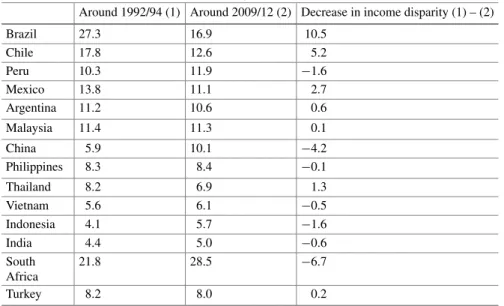
- How to Cope with Social Disparity
- Early Views on Social Disparity in the Developing Countries
- Financial Crisis and Reformulation of Welfare Mechanisms
- Sustainability of the New Social Welfare Schemes
- Pressures for Political Opening
- Early Debate Concerning Democratization in the Developing Countries
- The Third Wave and Its Demise
- Toward a Greater Political Uncertainty
- Can Politics Manage Economic and Social Difficulties?
Many believed that the "end of the Cold War" was accompanied by a clear victory for liberal democracy in the world. After the "end of the Cold War", the ideological influence of democratic principles strengthened.
Images or other third-party material in this chapter are covered under the chapter's Creative Commons license, unless otherwise indicated in a credit line for the material. If the material is not covered by the chapter's Creative Commons license and your intended use is not permitted by legal regulations or exceeds the permitted use, you will need to obtain permission directly from the copyright holder.
Responses to the Middle-Income Trap in China, Malaysia, and Thailand
Rethinking the Middle-Income Trap .1 Studies on the “Middle-Income Trap”
- Several Questions About the Discussion of the Middle-Income Trap
- From “the East Asian Miracle” to “Innovative East Asia”
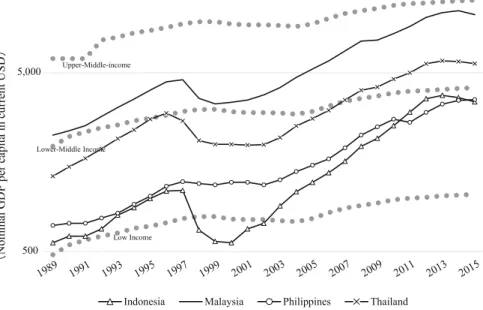
In 1979, Malaysia transitioned to what the World Bank defines as an upper-middle-income country. In contrast, Thailand and China both joined the group of upper-middle-income countries in 2010.
Higher Wages and Lower Labor Productivity .1 End of the Low-Cost Advantage Era
- Labor Productivity in East Asia
It is important to note that the annual growth rate in labor productivity has been consistently higher in Asia than in all other regions of the world. The issue to be raised here is not the annual growth rate of labor productivity in general, but the change in the annual growth rate over time.
Innovation and R&D in East Asia
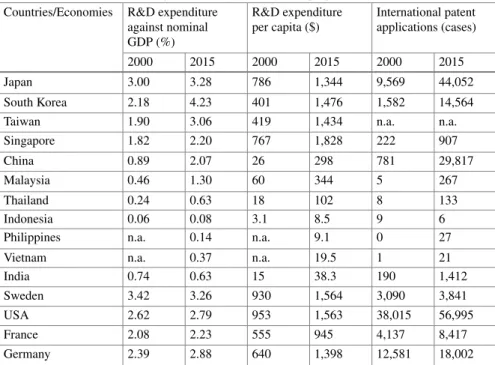
- R&D Activities in Asian NIES, ASEAN Countries, and China
- Strategies to Avoid the Middle-Income Trap
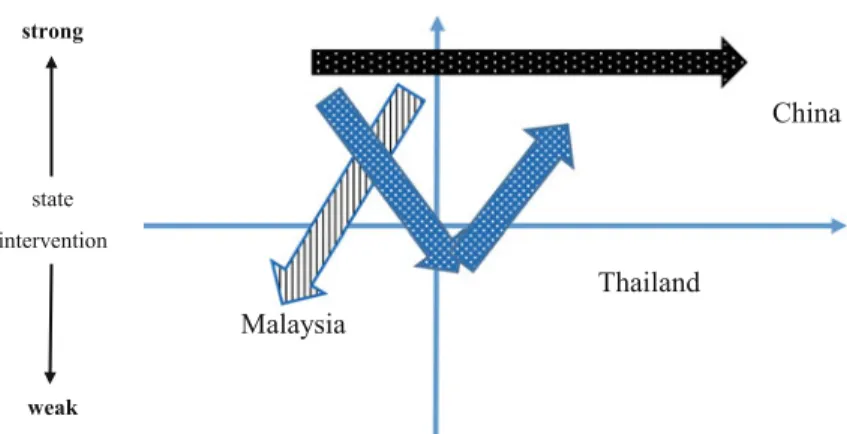
On the other hand, the reference to "leading the future" in the guidelines indicates the government's vision to enable basic research and create new industries from a long-term perspective. However, as we will discuss later, the Prayuth government has sought to restore the country's leadership in economic development since 2014, proposing an ambitious national strategy, “Thailand 4.0”. In this sense, Thailand shows a shift from Group C to Group B and then back to Group C in recent years.
Cases of China, Malaysia, and Thailand .1 China: ADB Policy Options
- Malaysia: From “National Vision Plan” to a “New Economic Model”
- Thailand: Pursuing Thai-ness and Next-Generation Industries
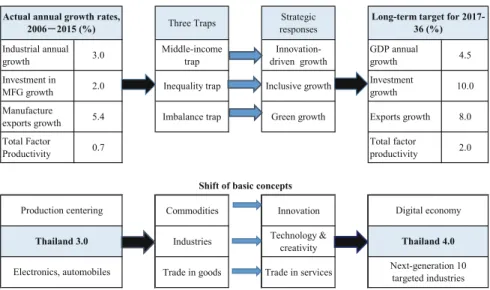
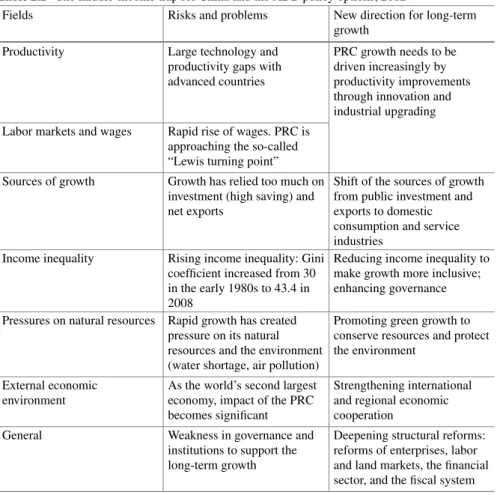
The measure most emphasized in the report is the improvement of productivity through innovation and improvement of the industrial structure. The core projects in Thailand 4.0 are the promotion of next-generation industries (ten industries) and the introduction of the Eastern Economic Corridor or EEC project.
The Role of the State in New Challenges
This is because I do not see transition to a high-income country as the only path available to upper-middle-income countries. 2012b. Growing Beyond the Low-Cost Advantage: How the People's Republic of China Can Avoid the Middle-Income Trap. Manila: ADB.
The Middle-Income Trap in the ASEAN-4 Countries
Middle-Income Trap and the ASEAN-4 .1 Arguments of MIT for East Asia
- How Slow Is the Rate of the Trap Threshold?
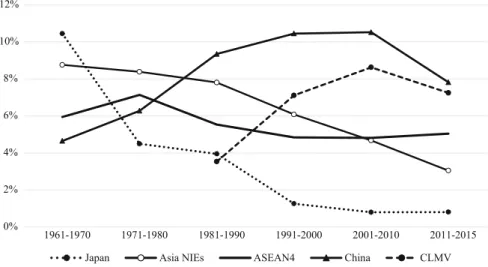
- Historical Growth of the ASEAN-4
This slowdown is a background to the growing fear of MIT for the ASEAN-4 countries. In the 2000s, all ASEAN-4 countries grew at around 5% per year for the decade.
The Flying Geese Pattern from the NXR .1 Explanation of the FGP
- FGP in Trade Structure
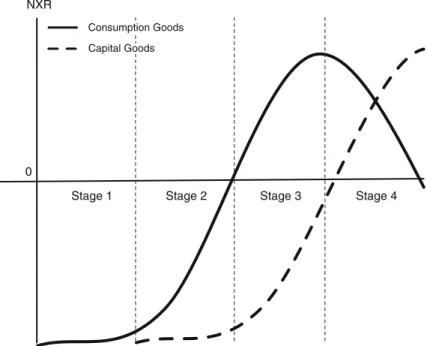
Kojima (1960) attempted to explain that the accumulation of capital (i.e. the Heckscher-Ohlin factor) is the fundamental driving force of the FGP. Thus, China became a successful exporter of consumer goods after the 1990s and upgraded its export structure to be a net exporter of capital goods and spare parts in the 2000s.
Export Structure of the ASEAN-4
- Malaysia
- Thailand
- Indonesia
- The Philippines
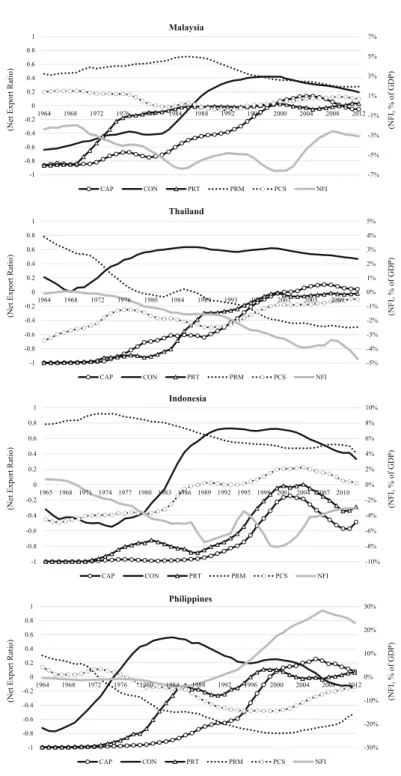
The panel for the Philippines in Fig.3.6 shows the historical changes in the NXRs for the Philippines. However, the NXR for CON began to increase in the late 1960s and became positive in the latter half of the 1970s. NXR for PRT turned positive in the latter half of the 1990s but did not increase since then.
Why Has Industrial Upgrading in the ASEAN-4 Stalled?
- Resource Curse Hypothesis
- Lack of Homegrown MNCs in the Manufacturing Sector
- Two Alternative Approaches to Industrialization
The Philippines is one of the largest earners of net factor income as a percentage of GDP in the world. The reason lies in the difference between consumer goods and parts and capital goods. Proton cannot be part of the ASEAN automotive manufacturing networks because (1) Proton is not an MNC, thus the absence of overseas manufacturing facilities makes it impossible to fully build units or auto parts under AFTA or the predecessor Brand to Brand Complementation/ASEAN Industrial Cooperation (BBC/AICO) scheme.
Conclusion
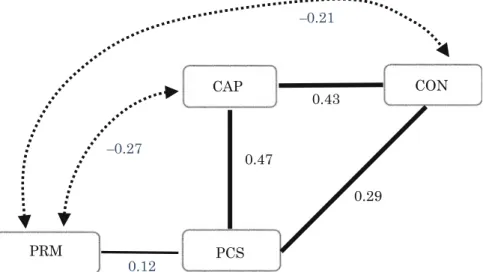
As shown in the analysis above, industrial upgrading in manufacturing parts and capital goods is likely to be limited in FDI because the host country is only one of the many countries that include MNCs in their production networks. Shifting Comparative Advantage in Asia: New Tests of the 'Flying Geese' Model.Journal of Asian Economics. Capital accumulation and the course of industrialization, with special reference to Japan. The Economic Journal70: 757–768.
Emerging States in Latin America: How and Why They Differ from Their Asian
Different Economic Performance
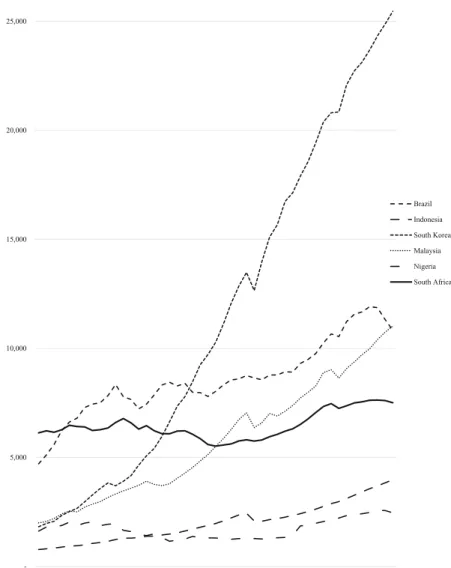
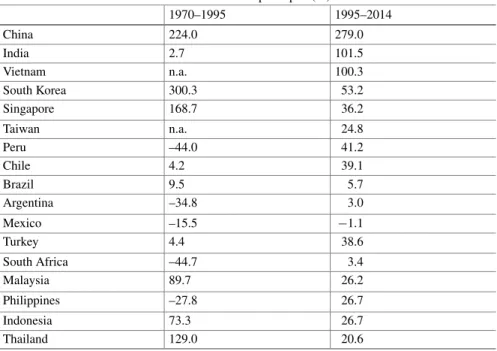
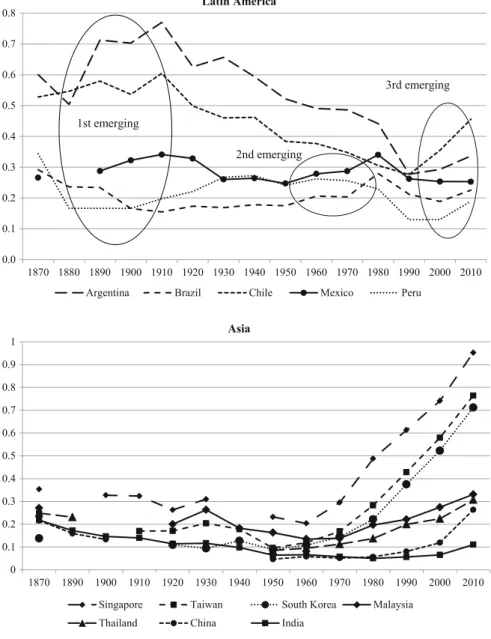
In the upper panel of Fig. 4.1, which reveals the GDP per capita of several Latin American countries (and South Africa) as a percentage of the GDP of the United States, three complementary periods can be distinguished. During the late nineteenth and early twentieth centuries, Argentina, Mexico, Chile (to a lesser extent), and Peru (during a slightly later period) experienced relative improvements in their GDP per capita. However, each period of growth was followed by a period of decline, and despite the recent improvement, the relative GDP per capita of Latin American countries has never regained their historical peaks.
First-Order Causes: Competitiveness of Manufacturing Industries
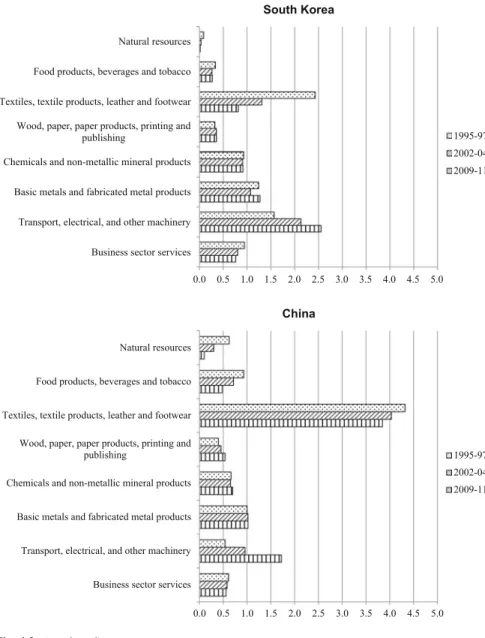
The share of world value added is also high in Brazil, Argentina and Thailand. Asian countries have local content that is lower than that of Latin American countries (except Mexico), but South Korea and China have high and growing shares of world value added. As its name suggests, CASVA is calculated based on the value added to a country's exports.
Second-Order Causes: Political Economy
- R&D and Education
- Fixed Capital Formation
- Capacity to Coordinate
- Intraregional Transaction
- Effectiveness of Public Administration
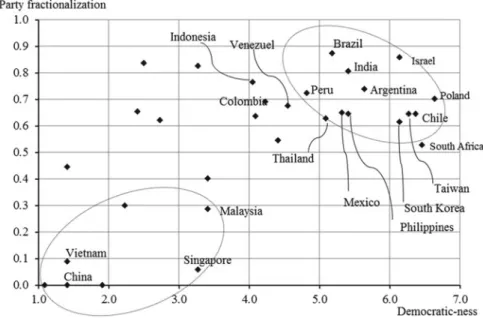
Complementing the executive survey, Table 4.3 reveals the results of general interpersonal trust opinion polls in Latin America and Asia. The difficulty of Latin America partly explains the nature of the Latin American economy characterized by Schneider (2013, Chapter 2). However, India, Taiwan, South Korea, Thailand and the Philippines share the same space as the Latin American countries in Figure 4-9.
Root Causes: Historical Legacies
- High Inequality and Weak Trust
- Weak Intraregional Business Networks
- Public Administration of Average Quality
- High Consumption, Low Investment
Although many Latin American countries gained independence in the first twenty-five years of the nineteenth century, white minority dominance persisted well into the twentieth century. However, towards the end of the nineteenth century, the economic development of Latin American countries became increasingly dependent on the export of agricultural and mining resources to Europe and the United States, which were experiencing rapid industrialization (Bulmer-Thomas 2003, ch. 3). As the ISI faced constraints and Latin American countries were hit by the debt crisis, they dismantled much of the protectionist regime and adopted strongly market-oriented policies (IADB 1997).
Conclusion
In The Cambridge Economic History of Latin America Volume II: The Colonial Era and the Short Nineteenth Century, ed. In The Cambridge Economic History of Latin America Volume I: The Colonial Era and the Short Nineteenth Century, ed. Open Access This chapter is licensed under the terms of the Creative Commons Attribution-NonCommercial-NoDerivatives 4.0 International License (http://creativecommons.org/licenses/by-nc-nd/4.0/), which permits any non-commercial use, sharing, distribution, and reproduction in any medium or format, as long as you give the original and license to the original and license to the original and license. indicate whether you have modified the licensed material.
Economic and Political Networks and Firm Openness: Evidence
Hypotheses and Estimation Methods .1 Benefits of Globalization
- Linkages Between Protectionism, Business and Political Networks, and Trust
- Estimation Method
Managers with fewer business ties to foreign companies are less likely to trust foreign nationals simply because of the lack of direct communication (arrow D). Based on the argument in the previous subsection, we hypothesize that networks with foreign companies and trust towards foreign citizens have a positive effect on pro-globalization views of managers, while networks with domestic companies, trust towards domestic citizens and networks with politicians have a negative effect. Business connections with foreign companies and trust towards foreign citizens positively influence each other, but they are negatively influenced by political ties.
Data .1 Survey
- Variables
- Summary Statistics
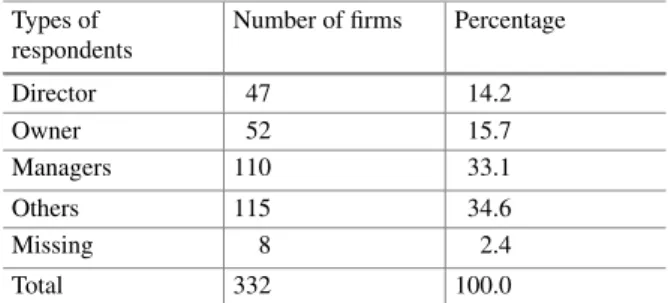
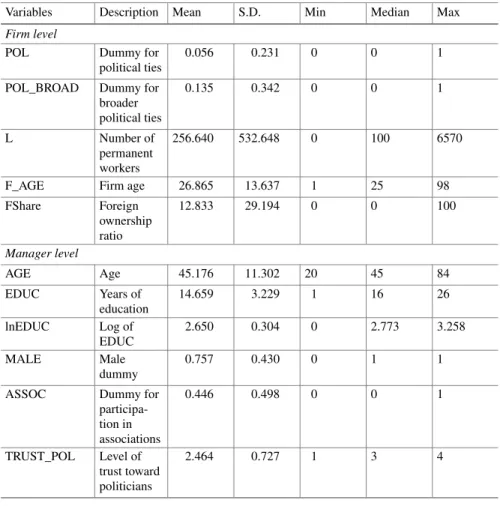
Firm-level variables include the logarithm of the number of permanent employees, firm age and the square of firm age, and the proportion of foreign ownership. Number of transaction partners, i.e. the number of buyers and suppliers reported by companies is small for many companies (Table 5.4). The median number of transaction partners in Indonesia is 5, while the number of overseas partners is zero for 19% of firms.
Estimation Results .1 Benchmark Results
- Alternative Measure of Political Ties
- Discussion
To check the robustness of the results, we repeat the same regressions using an alternative measure of political ties. However, the coefficients for the measurement of political ties are often smaller and less significant here than in the benchmark results. This implies that the narrower definition of political ties explains the empirical model better, probably because the firms'
Conclusion
Welfare gains from foreign direct investment through technology transfer to local suppliers. Journal of International Economics. Learning by Exporting: New Insights from Examining Firm Innovation. Journal of Economics & Management Strategy. Productivity Spillover and Characteristics of Foreign Multinational Plants in Indonesian Manufacturing 1990-1995. Journal of Development Economics.
Industrial Technology Upgrading
Evolution of Manufacturing Industries in Taiwan and Thailand
- Taiwan
- Thailand
In order to commercialize technologies more effectively, in 1979 the government initiated the implementation of the "Science and Technology Development Program". and recruitment of senior scientific and technological personnel” in 1983 were milestones in Taiwan's technological orientation period. The high priority of the subject of “competitiveness” on the government agenda was illustrated by the establishment of the National Commission.
A Comparison of Taiwanese and Thai Policy Instruments Supporting Technology Upgrading
- Tax Incentives
- Grants
- Loans
- Equity Financing
- Capital Market Funding
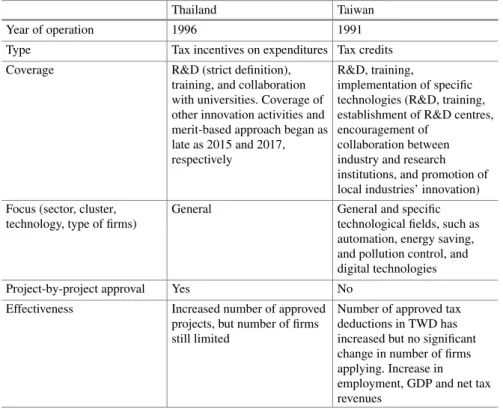
At present, the management of VC funds is supervised by the Ministry of Economic Affairs (MOEA). In the case of Taiwan, the number of new venture capital investments grew due to the government's tax credit policy supporting venture capital firms (the number of new investments grew from 1,155 cases to 1,850 cases between 1998 and 2000). TWSE listing rules require companies to receive a rating advice from the central authority, i.e. the Office of Industrial Development of the Ministry of Economic Affairs (MOEA), to demonstrate their ability to handle evolving technologies.
Institutions Affecting Policy Formulation and Implementation
- Unity and Capability of Government Bureaucracy
- Perception of the Role of Government in Strengthening Private Firms
- Corruption and Attitudes Toward Corruption
- Laws, Regulations and Norms
- Entrepreneurship
- Trust
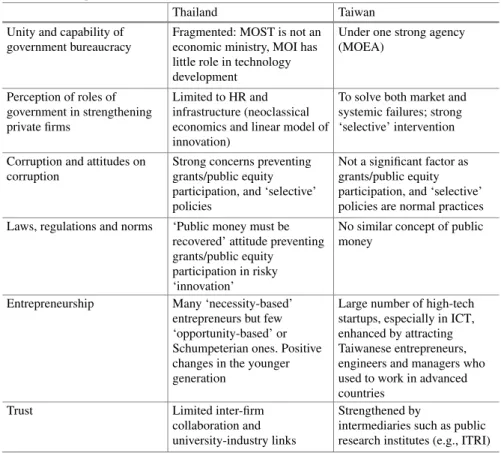
In Taiwan, there are significantly more innovative firms and more patents registered in the US by Taiwanese firms and entities than in Thailand (see Table 6.6). Given that atmosphere, there are few grant and public equity participation schemes, and even fewer selective ones, in Thailand. Therefore, grants, and even direct equity participation by the government in risky corporate activities or in particularly risky types of firms such as start-ups, are quite rare in Thailand.
Conclusion
Servitization of Manufacturing and Revitalization of Industrial Clusters: A Case Study of Taiwan's LIIEP.Journal of the Asia Pacific Economy. The economics of the company's technological change process: the case of Thailand's electronics industry. Competing in the Global Electronics Industry: A Comparative Study of the Innovation Networks of Singapore and Taiwan.Journal of Industry Studies.
Changing Resource-Based
Manufacturing Industry: The Case of the Rubber Industry in Malaysia
- Outlook of the Rubber Industry in Malaysia and Thailand
- Development of the Rubber Industry in Malaysia
- Upstream Segment
- Midstream Segment
- Downstream Segment
- The Development of the Rubber Industry in Thailand .1 Upstream Segment
- Midstream Segment
- Downstream Segment
- Discussion and Implications
However, the timing and sectoral composition of the development of the rubber industry differs in the two countries. This chapter aimed to analyze the progress of the rubber industry in Malaysia and Thailand and explore its development potential in the future. In the downstream segment, private sector initiatives were decisive for the commercialization of the new technologies.
List of Interviews
Marketing Risks and Standards
Compliance: Challenges in Accessing the Global Market for High-Value
Agricultural and Aquacultural Industries
Marketing Risks: Pineapple Exporting Industry in Ghana and Thailand
- Pineapple Industry in Ghana
- Overview
- Risk of Unsold Fruit
- Risk of Demand Shift: MD2
- Summary: Pineapple Industry in Ghana
- Pineapple Industry in Thailand
- Overview
- Role of Processing Industry in Reducing Risk
- Summary: Pineapple Industry in Thailand
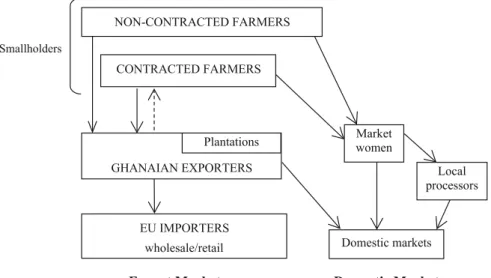
Another marketing risk for pineapple producers in Ghana posed by global markets was the shift in the variety of pineapples that are in demand in the EU. The above analysis showed that marketing risks (with unsold fruit and sudden changes in demand) are significant in the pineapple export industry in Ghana. The main difference between the pineapple industry in Ghana and in Thailand is the large proportion of fruit produced by smallholder farmers in the latter.
Standards Compliance: Export Shrimp Aquaculture in Vietnam and Thailand 3
- Shrimp Industry in Vietnam
- Overview
- High Port Rejection Rates
- Better Management Practice and Disease Outbreak
- Summary: Shrimp Industry in Vietnam
- Shrimp Industry in Thailand
- Overview
- Successful Transformation of Farming Practices
- Role of the Government
- Role of the Private Sector
- Summary: Shrimp Industry in Thailand
To illustrate this, we take an example of the shrimp aquaculture industry in Vietnam and Thailand in this section. While the structure of the shrimp industry in Thailand is similar to that of Vietnam, it presents a very different situation in terms of shrimp farming practices. The government also requires the transfer of MD from sellers to buyers during all stages of shrimp marketing in Thailand.
Conclusion
From smallholders to multinationals: The impact of changing consumer preferences in the EU on the pineapple sector in Ghana. Partial vertical integration, risk reduction and product rejection in the supply chain of high-value exports: the pineapple sector in Ghana. Earnings, Savings and Job Satisfaction in the Labor-Intensive Export Sector: Unskilled Workers in the Cut Flower Industry in Ethiopia. World development.
How Nations Resurge: Overcoming Historical Inequality in South Africa
South Africa as an African Middle-Income State
However, the presence of South Africa in the region is much greater than the size of its GDP. South Africa's deficit in trade in manufactured goods is therefore amply compensated by the export of natural resources. The next section explains the historical origins of social exclusion in South Africa.
The Land Question and the History of Inequality
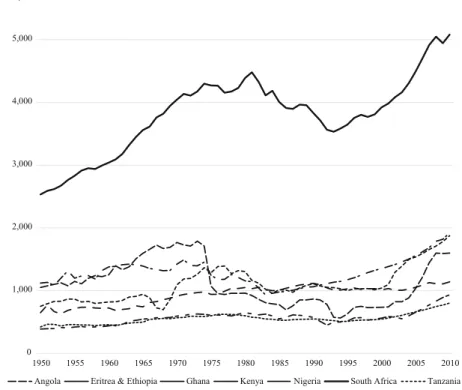
Although the upward shift in South Africa's GDP per capita since the abolition of apartheid in 1994 is evident, the pace of progress is extremely slow. In addition, South Africa has a large number of people who have given up paying futile efforts to find work and are therefore excluded from this narrow category of unemployed. If those chronically unemployed are counted, the unemployment rate (based on the expanded definition) reached 36% in 2016.5 In both definitions, the unemployment rate has not changed significantly in the last two decades.
