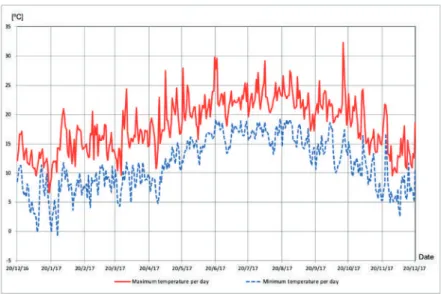
Impact of temperature changes and freezing - thaw cycles on the behavior of asphalt concrete immersed in water containing sodium chloride. Influence of temperature changes and freeze-thaw cycles on the behavior of asphalt concrete immersed in water containing sodium chloride [1].
Methodology 1. Materials
15] studied the impact of salt on the performance of bituminous mixtures when left submerged in seawater subject to freeze-thaw cycles. Özgan and Serin [19] indicated by the void ratio (Vh), the void ratio filled with asphalt (Vf) and the void ratio within mineral aggregate (VMA) parameters; the ultrasonic speed test; and the Marshall Stability (MS) that the effect of the freeze-thaw cycles on the asphalt concrete is of great importance, especially for hot asphalt design.

Results and Discussion
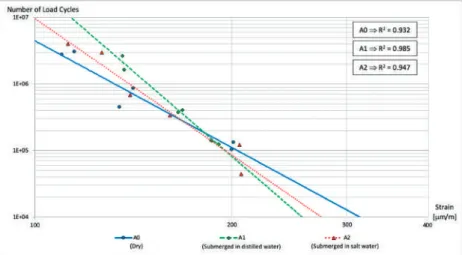
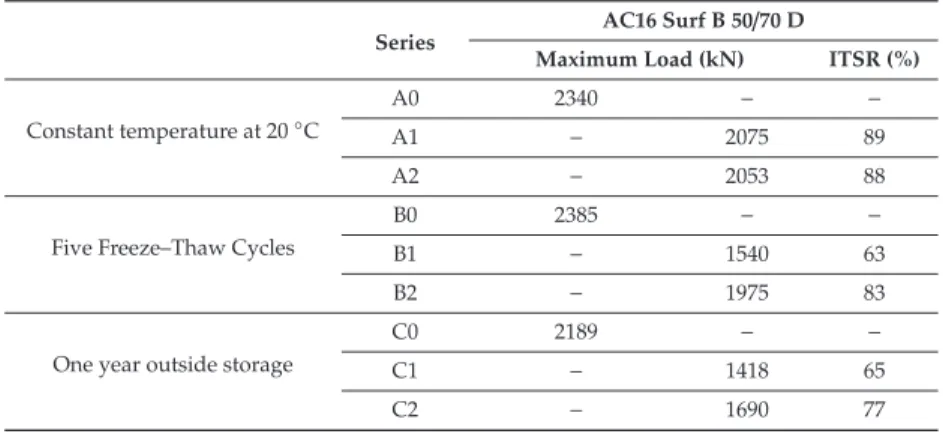
In general, for all the ranges and frequencies tested, the modulus values are greater for the dry range. In the case of the series subjected to five freeze-thaw cycles (B series), the one immersed in salt water (B2) receives more load cycles for any strain range than the other two series (Figure 5).
Conclusions
Freeze-Thaw Effects on Fatigue LIFE of Hot-Mixed Asphalt and Creep Stiffness of Asphalt Binder. Cold Reg. Investigation of certain technical characteristics of asphalt concrete exposed to freeze-thaw cycles. Cold Reg.
MSWI Bottom Ash Application to Resist Sulfate Attack on Concrete
Introduction
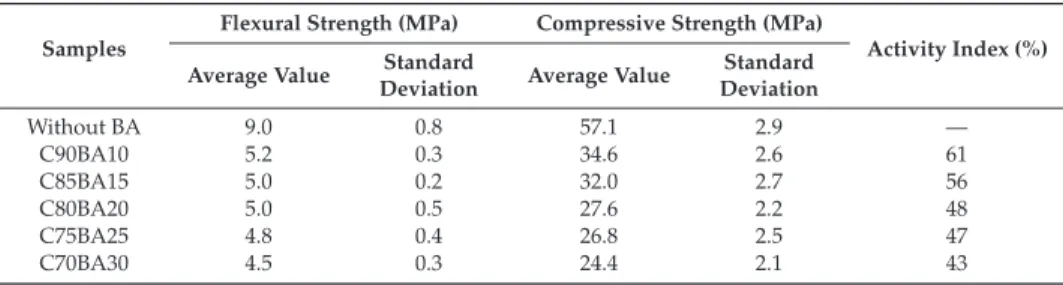
In this study, a strategy to improve the sulfate resistance of concrete by admixing with MSWI fly ash was proposed. However, the use of MSWI fly ash to protect against sulfate attack on concrete has rarely been reported, and the transport and crystallization processes of salt solution in concrete remain unknown.
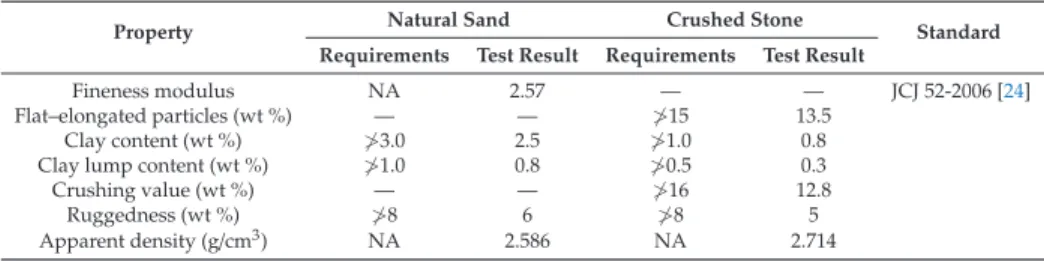
Materials and Methods 1. Materials
Physical attack refers to the destruction of concrete by the crystallization of the salt solution [13]. Figure 7 shows the compressive strength values of the concrete samples with different BA contents after 28 days of curing.
Thermal and Mechanical Properties of Cement Mortar Composite Containing Recycled Expanded Glass
Aggregate and Nano Titanium Dioxide
Results and Discussion 1. Workability
The reduction in water absorption is attributed to the filler effect of nTiO2 and the reduction of the porosity of the cement matrix. Figure 9 shows the influence of the inclusion of EGA and TiO2 on the compressive strength of mortar compositions at different ages. It is observed that the inclusion of EGA significantly reduced the compressive strength of the cement mortar.
It was observed that the compressive strength decreased due to decrease in the density of the sample (CS, E50 and E100 blends).
Experimental Program 1. Materials
The experimental parameters used to determine the seismic performance of specimens were the compressive stress, aspect ratio and the materials of the structural columns. The dimensions and steel arrangement of the specimens must meet the specifications as described in GB/T 41112013. The number and values of cycles were also recorded; (4) two vertical LVDTs were placed on both sides of the bottom beam to measure.
A horizontal LVDT was arranged on one side of the bottom beams to measure horizontal displacement.
Test Results
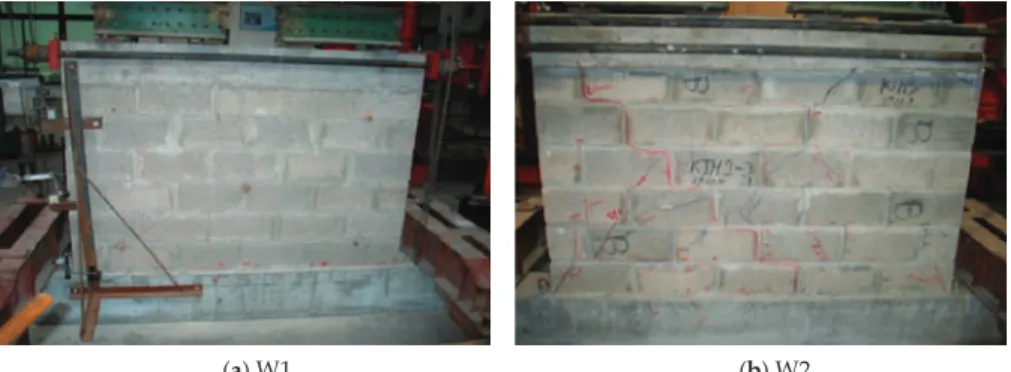
During the initial loading stage, small horizontal cracks gradually appeared between the horizontal mortar cushion and the bottom support of Specimen W2. As the lateral load increased to the ultimate load, the previously formed cracks in the diagonal direction connected and the bearing capacity of specimen W2 dropped rapidly, indicating the destruction of the specimen. As can be seen in Table 4, the ultimate strain and strain to crack of W1 specimens was 98%.
The tear load and final load of the specimen W2 was higher compared to W3, which indicated that the load bearing capacity of specimens decreased with increasing aspect ratio.
Test Analysis 1. Hysteresis Behaviour
It can be seen from Figure 10b, the bearing capacity and the deformation property of the samples W4 and W5 are obviously higher than those of W1, W2 and W3. This figure shows that the stiffness of bare walls gradually decreases with the increase of the displacement. Compared with W1, the stiffness of W2 generally weakened, which indicated that the increase of vertical compression could reduce the degradation rate of the stiffness of specimens.
In the initial phase, the stiffness of the specimens decreases rapidly with the increase in displacement.

Conclusions
The value of the equivalent viscous damping coefficient and energy dissipation per cycle can be observed from Table 7 and Figure 13 respectively. With the increase of the aspect ratio, the ductility of the wall decreased, but the bearing capacity and the energy dissipation performance of samples decreased;. Experimental study on a predictive model of the shrinkage and creep of recycled aggregate concrete.Appl.
The load-carrying capacity degradation coefficients were more than 0.85, indicating that the samples showed a high safety reserve.
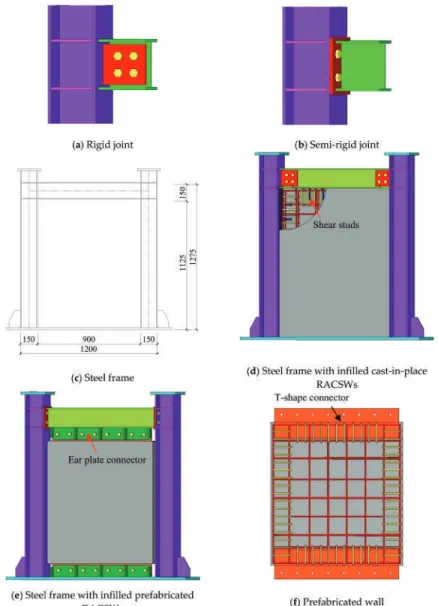
Experimental Program 1. Specimen Design
In this study, two aspects of improvements were considered based on the structure of steel frames filled with concrete shear walls as suggested by the previous scholars. The distance between the bolts was 100 mm and the rapid assembly of the walls and steel frames could be achieved, as illustrated in Figure 1e. The T-shaped connectors were embedded in the concrete wall and welded to the steel bars of the hidden beams (Figure 1f).
FourΦ8 steel bars were in the hidden beams and columns, and the diameter of the 50mm brace spacing was 6mm.
Behavior of Test Specimens 1. General Behavior
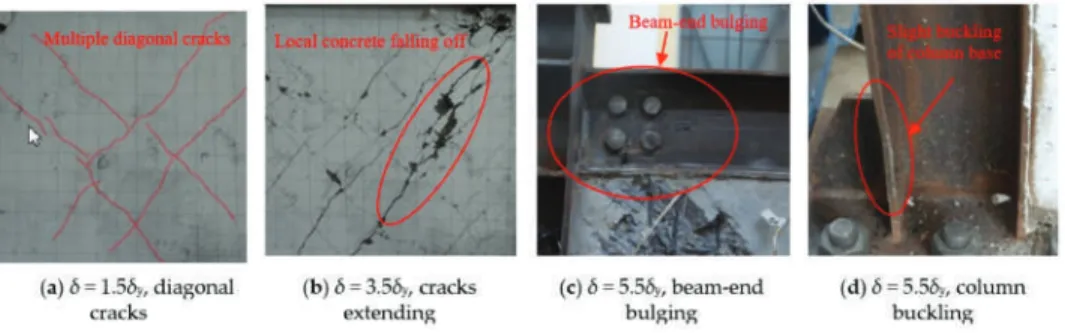
Much concrete fell from the intersection of the cracks along the diagonal when the displacement was 4.5δy. A first crack appeared in the lower right corner of the wall when the load was 140 kN. Cracks in the horizontal direction formed at the bottom of the wall when the displacement was 2.5δy (Figure 7b).
At a load of 80 kN, several small oblique cracks appear along the diagonal direction of the wall.
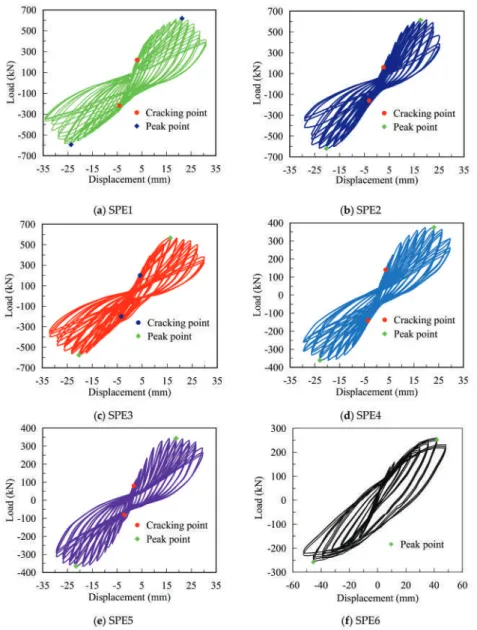
Results and Discussions 1. Hysteretic Curves
The horizontal load was then mainly carried by the steel frame and the load-bearing capacity and lateral stiffness of the test pieces decreased rapidly. The skeletal curves of the samples are S-shaped when the cast-in-place RACSWs are filled. In addition, the connecting stiffness of BCJs slightly influences the strength degradation of the samples of filled prefabricated RACSWs.
The load-bearing capacity degradation coefficients of the test pieces of filled prefabricated RACSWs are more than 0.85.
An Experimental Strain-Based Study on the Working State of Husk Mortar Wallboards with Openings
- HMES Wallboards and Testing Preparation 1. The Configuration and Size of the HMES Wallboards
- The Experimental Results 1. Test Results of Material Test
- Data Analysis 1. FE Model
- Summary and Conclusions
19] calibrated the numerical model according to the eigenvalue analysis and the test of the dynamic identification. The analysis of the strain data provides a proper way to judge whether cracks occur/propagate in the specimen. The intersection of the UFk−FandUBk−Fcurves is the characteristic point of the structural stress state.
The development of the NASE sum will present the characteristic points of the working condition of the HMES wall plate, i.e. the crack load and failure load.
Numerical Study of Bond Slip between Section Steel and Recycled Aggregate Concrete with Full
Replacement Ratio
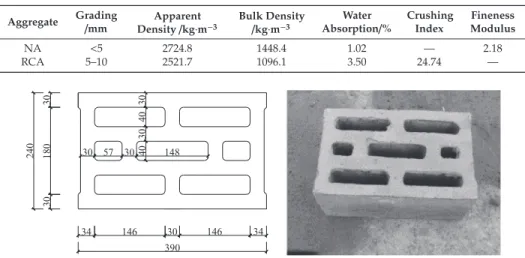
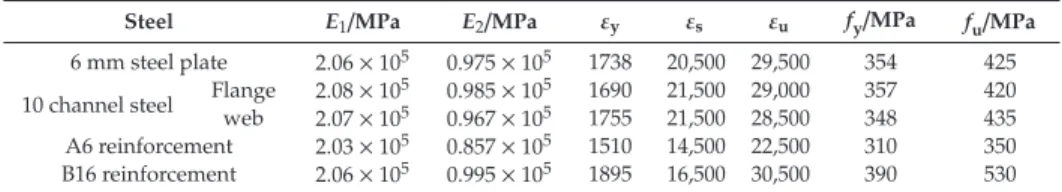
Experimental Programs 1. Materials
The physical properties of the recycled coarse aggregate were measured [28,29] and the results are shown in Table 1. Nine extrusion specimens were designed in the test to study the bond behavior and bond slip between the section steel and RAC. Pre-absorption treatment was performed on recycled coarse aggregate prior to RAC preparation [30,31] and the RAC mix design is shown in Table 4.
Therefore, from the perspective of the section steel, the loading side of the specimen was defined at the bottom and the free end was in the upper part.
Results and Analysis 1. Failure Procedure and Mode
With burst failure, the initial cracks occurred in the middle of the flange or web. The relative bond strength is defined as the ratio of the average bond strength to the tensile strength (τ/ft), and the relative embedded length is defined as the ratio of the embedded length to the height of the steel section (Le/d). The effect of reducing the average initial bond strength is not obvious and the final average bond strength is significantly reduced.
Table 6 indicates that the average final bond strength and the average residual bond strength fit well, but the placement result of the average initial bond strength has a certain deviation.

Numerical Simulation
With the increase in the replacement rate of recycled aggregate, the shrinkage and creep of recycled aggregate concrete increases significantly. Many researchers have conducted relevant research on the importance of shrinkage and creep of RAC. The results show that with the increase in the replacement rate of recycled aggregates, the shrinkage and creep deformation of RAC increases.
Based on the two increasing factors, the RAC shrinkage and creep model is established and the applicability of the model is verified.
Shrinkage and Creep Test of Recycled Aggregate Concrete 1. Materials
23] proposed a model for RAC shrinkage and creep, which considered two factors, the degree of regenerated aggregate and the degree of replacement, and the regression coefficient was used to obtain the influence coefficient expression. This can quantitatively calculate the coefficient of influence of shrinkage and creep of recycled aggregates with different quality and different replacement rates. However, the existing method of proposing a correction coefficient with a certain influence factor fails to establish the RAC shrinkage and creep prediction model.
The compressive strength of the prism of the samples under the same conditions was tested before loading.
Test Results and Analysis 1. Analysis of Shrinkage Test Results
Similar to ordinary concrete, the main cause of shrinkage of RAC cement mortar is hardening, internal moisture loss and deformation caused by volume reduction. The creep coefficient of RAC with a substitution rate of 50% and 100% in Group II was 23.6% and 44.3% higher than that of plain concrete, respectively. The creep rate decreased with time, but the decrease in creep rate for plain concrete close to the RAC creep coefficient was small.
This shows that the water-cement ratio is an important factor affecting the creep of RAC.

Creep and Shrinkage Model of Recycled Aggregate Concrete
Therefore, the shrinkage of concrete depends on the amount and stiffness of the coarse aggregate in concrete. As the rate of replacement increases, the porosity of the bonded mortar increases the rate of concrete shrinkage. The calculated value of the model takes into account the effect of the recycled mortar itself on the shrinkage and creep of the recycled concrete.
At the same time, according to the same research ideas, a complete prediction model of shrinkage and creep of RAC with a full-service life cycle can.
MDPI