According to the World Trade Organization [4], COVID-19 “has led to increases in business-to-consumer (B2C) sales and an increase in business-to-business (B2B) e-commerce.2 The sales are particularly evident. in online sales of medical supplies, household necessities and food products”. 11], “the emerging paradigm of electronic services (e-services) promises to bring the flexibility that the web has brought to document sharing to distributed computing and services”.
TOP 1%
Introduction
The purpose of this research study is to fill the research gap on consumer perception of e-commerce considering the factor of trust and risk. This research study and the results of this research intend to add to the body of knowledge on consumer perceptions of e-commerce that is lacking or non-existent in Pacific Island countries.
Literature review
If the hesitation continues, Fiji may not be able to fully exploit the e-commerce sector. A country with the majority of its population born and living in a period of internet boom would be more loyal to e-commerce services.
Research model and hypothesis
- Perceived risk [PR]
- Perceived trust [PT]
- Perceived usefulness [PU]
- Perceived ease of use [PEOU]
Ease of use is defined as the consumer's perception that the use of the new technology will be free of difficulty and low in complexity. Applying this to the study, ease of use is the consumer's perception that shopping on the Internet requires minimal effort.
Research model
Out of the five principles of usability explained in [41], this paper focuses on the learnability of an e-commerce site; it is "how easy it is for consumers to perform basic tasks the first time they encounter the design". For example, perceived risk negatively affects a consumer's intention to act (H1), while perceived trust positively affects a consumer's intention to act (H5).
Theoretical background
Methodology
A consumer's actual use of e-commerce was used as the dependent variable as it was the most important variable to be measured. Independent variables in our quantitative studies were our consumer's location and access to the Internet.
Results
- H1: perceived risk [PR] negatively influences the consumer’s intention to transact online
- H2: perceived risk [PR] negatively influences perceived ease-of-use [PEOU]
- H3: perceived risk [PR] negatively influences perceived usefulness [PU]
- H4: trust in e-commerce positively influences the perceived risk associated with transacting online
- H5: trust in e-commerce positively influences the consumer ’ s intention to transact online
- H6: trust in e-commerce positively influences perceived ease-of-use [PEOU]
- H7: trust in e-commerce positively influences perceived usefulness [PU]
- H8: perceived ease-of-use positively influences perceived usefulness [PU]
- H9: perceived ease-of-use positively influences the consumer’s intention to transact online
- H10: perceived usefulness positively influences the consumer’s intention to transact online
This implies that there is a relationship between the two that as the consumer's perceived risk in processing transactions increases, the perceived ease of use decreases. This implies that there is a significant relationship between the two that as a consumer's perceived risk of personal information increases, perceived ease of use decreases.
Discussion
Perceived trust positively impacts the intent to transact, ease of use, and usability of an e-commerce site. Similarly, [55] proves that "trust increases the website's perceived usefulness", as well as ease of use.
Conclusion
- Recommendation
- Further research opportunities
Sam Gooundar, Senior Lecturer – Information Systems, University of the Pacific for sharing his wisdom with us during the course of this research. Sam Gondar1*, Kunal Lal1, Ashmita Chand1and Pranav Vyas2 1 The University of the South Pacific, Suva, Fiji. An Investigation of Individuals' Perceived Security and Privacy of the Internet in Malaysia and Its Influence on Their Intention to Use E-.
Digitized educational system
- Digitized teaching and learning
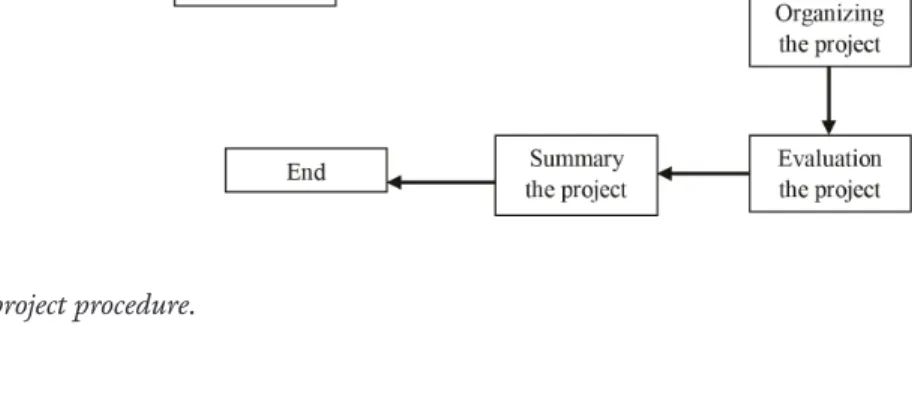
- Project writing and digital data evaluation
- Merged mail and digital worked assignment
- Digital combining for teaching systems
- Teaching and learning with digital systems
Because these papers can be used by many people in the organization, the papers can be lost or moved. The technology available in the space will help spark creativity that can lead to displaying creative ideas [12]. 14]Figure 6 also goes in the same direction as Figure 5 and shows the number of mobile subscriptions.
Conclusion
- Purpose of study
- Research problem
- Educational technologies’ literature See Table 1
2.Are the educational technologies used around the world today available for the Fijian classroom. How many of the key educational technologies available to the Fijian classroom are relevant to them. Although there are a number of educational technologies used in classrooms around the world, the availability and relevance of the available technologies in a Fijian classroom needs to be looked at.
Educational technologies
- Common types of classroom technologies See Table 2
Theoretical framework
Methodology
- A snapshot of educational technologies in a Fijian classroom
- Summary of research and discussion .1 Implementation
They recognize the importance of educational technologies in the Fijian classroom and are making efforts to move forward in the future. Given the challenges described, the importance of educational technologies in the Fijian classroom faces its main argument. The true potential of educational technologies in the form of e-Learning remains to be seen.
Findings
These issues are real, and they slow down the speed at which educational technologies need to be deployed. These are key areas that need to be thoroughly addressed before I recognize the importance of educational technologies in the classroom in Fiji. The key fact here remains that the educational technologies in the sample have limited implementation.
Conclusion
Future directions
Therefore, managers are behind in the ability to make use of such data from patients' voices to improve the quality of the services provided. Word of mouth is one of the most pervasive forms of spreading information about customer experiences. The investigations carried out in this area are international and are only directed at the user's decision and do not examine methods that assist managers in the continuous improvement of the quality of health services.
Background and related work
They can be a substitute, immediately or almost in real time, for the analysis of the users' experience, with the possibility of using automated methods that facilitate their analysis, and it is in this sense that the present study will seek to make a major contribution ; they offer a convenient, safe and cheap mechanism for organizations to hear the users' voices [31, 34], being an important means of alarm to signal the deterioration of the quality of care [16] or, on the other hand, identify successful practices [31]. It is also common for authors to perform sentiment analysis [39] and classify text data according to positive, negative, neutral and/or mixed perspectives. The following model (Figure 1) shows that a systematic collection and analysis of this information by the manager can feed and have a direct impact on the continuous improvement of the quality of health services.
Sample definition and data collection
The definition of the indicators to be included in the study is based on two sources: indicators used in previous investigations (narrative comments, number of stars, gender, number of words) [7, 38] and indicators that are within the scope of this study is defined. (date, location, language, total score of the institution and number of likes). The models chosen for the definition of the categories that will be used in the present study are Quality models, which, although one of them is old, still present current dimensions for the existing services, namely in the scope of health services. Thus, in the 592 OCC selected, 898 sub-comments were identified, which constitute the units of analysis of the present study.
Results and analysis
- Categories for the classification of content generated online by users, in line with the principles of quality in health services
From the previous results, one of the problems that a manager may face when dealing with this data is related to the issue of data reliability. One of the purposes of this investigation was to identify categories for classifying user-generated web content. Thus, the results of this research show that the manager should be aware of the behavior of this indicator when analyzing online data.
Conclusions and future work
Not least because, a large part of the investments made in the health sector were directed to glaring problems such as the increase in the prevalence of chronic diseases as a result of the increase in average life expectancy [44]. Overall, one of the main contributions of the study is to advance the classification of available customer-generated content in a way that is consistent with the prevailing models of service quality, i.e., word of mouth in the healthcare sector: a literature review on the current state of research and future perspectives.
Concept of system 1 Structural elements
- Schematic diagram
- Element of the system and relationship
- Hypothesis
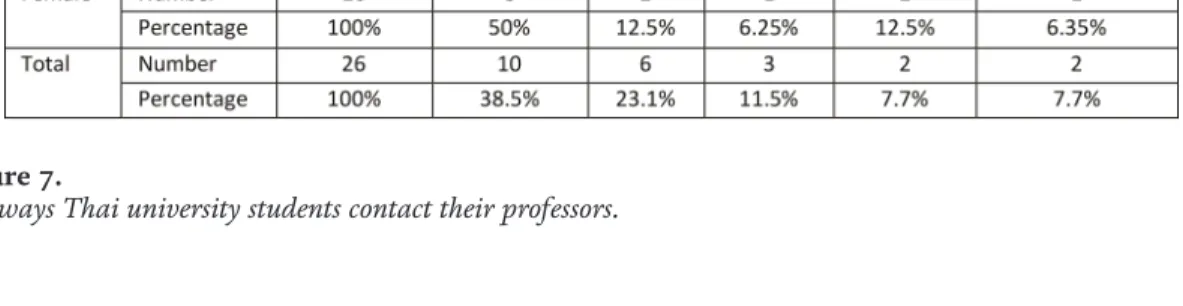
If ICT is used in class, it will be easier for instructors to collect data from students' different types of data; for example, when student responds to subjects given or assigned, instructors will be able to collect students' data in real time [20, 21]. And they will be able to design their instructions to meet students' differentiation and needs, such as optimized group members for project teams (Figure 1, right (A) feedback control). In this point, the main controller will store more different kinds of data, for example, students' performance records, differentiation, attitude, and so on, in the class (Figure 1, right (4)).
Design
Since these hypotheses are tested based on this PDLS model, we designed a practical experiment together with the SPCDA method [44]. Second, after hearing from her about the current situation, we analyzed the problems in her class so that we could find a solution. By identifying the reason why these problems happened to the students, we have to decide for the best.
Solution
Do: Explaining the goals of PELS (answer to students) and collecting data (feedback to Check). Check: Analyze and evaluate student performance through data collected in the previous sections, Start, Plan, and Do.
Results 1 Pilot
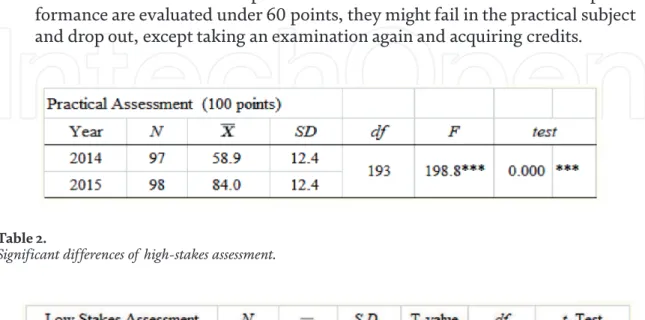
- Examinations
- Comparisons
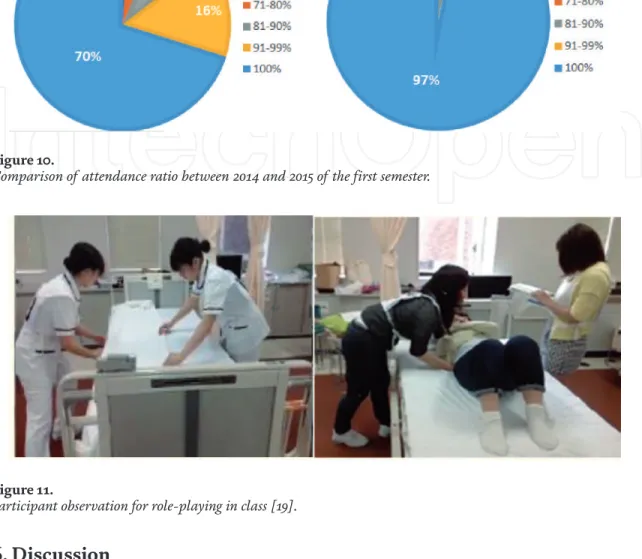
Low-stakes assessment: The results of the post-quiz on the special concept of nursing have become significantly higher than the pre-quiz. High-stakes assessment: The result of practical assessments is significantly higher in 2015 than in 2014. High-stakes assessment (Figure 9): The figure shows the distribution of the students' performance record for practical assessment tests, compared to the results of per the preterm between 2014 and 2015.
Discussion
- Examination of PELA
- Examination of pre- and post-quiz
- Observation
- The relation to the theory of HAL
One reason may have been the feed-forward system, which allowed instructors to retrieve student data as they shaped their instruction based on their personality, needs, etc. (forward control) (hypotheses (a)). The instructor may have learned how to accurately predict the behavior of his students (Feedforward Control). In addition, students' performance may have been significantly improved by their autonomy and activity (feedback control B).
Conclusions
In the second cycle of SPDCK (practical experiment in 2015) they have decided how to combine the members to optimize each team from the characteristics of the students which have been evaluated by the big data processing system (information control) (Figures 1 and 3) [19]. The reports of the observations of the participants are considered, which are compared with the attitude of the students in the classroom, matched with the results of the evaluations. In: IEEE Engineering in Medicine and Biology 37th Annual International Conference (EMBC).